www.impactjournals.com/oncotarget/ Oncotarget, 2017, Vol. 8, (No. 56), pp: 95083-95094
The peripheral immune status of granulocytic myeloid-derived
suppressor cells correlates the survival in advanced gastric
cancer patients receiving cisplatin-based chemotherapy
Hirokazu Shoji1,2, Kohei Tada3, Shigehisa Kitano4, Takashi Nishimura1, Yasuhiro
Shimada1, Kengo Nagashima5, Kazunori Aoki6, Nobuyoshi Hiraoka7, Yoshitaka
Honma1, Satoru Iwasa1, Atsuo Takashima1, Ken Kato1, Narikazu Boku1, Kazufumi
Honda8, Tesshi Yamada2,8, Yuji Heike3 and Tetsuya Hamaguchi1
1Gastrointestinal Medical Oncology Division, National Cancer Center Hospital, Tokyo, Japan
2Course of Advanced Clinical Research of Cancer, Juntendo University Graduate School of Medicine, Tokyo, Japan 3Immunotherapy and Cell Therapy Service, St. Lucas International Hospital, Tokyo, Japan
4Exploratory Oncology Research and Clinical Trial Center, Division of Cancer Immunotherapy, National Cancer Center, Tokyo,
Japan
5Department of Global Clinical Research, Graduate School of Medicine, Chiba University, Chiba, Japan 6Division of Molecular and Cellular Medicine, National Cancer Center Research Institute, Tokyo, Japan 7Division of Molecular Pathology, National Cancer Center Research Institute, Tokyo, Japan
8Division of Chemotherapy and Clinical Research, National Cancer Center Research Institute, Tokyo, Japan
Correspondence to: Yuji Heike, email: heiyuji@luke.ac.jp
Keywords: gastric cancer, peripheral immune status, granulocytic myeloid-derived suppressor cells, chemotherapy, prognosis Received: October 22, 2016 Accepted: April 24, 2017 Published: May 30, 2017
Copyright: Shoji et al. This is an open-access article distributed under the terms of the Creative Commons Attribution License 3.0 (CC BY 3.0), which permits unrestricted use, distribution, and reproduction in any medium, provided the original author and source are credited.
ABSTRACT
Background: The prognostic significance of peripheral immune status in patients with advanced gastric cancer (AGC) remains unclear.
Results: From July 2013 through December 2014, 37 patients were enrolled. Among patients with 25 subsets of immune cells, patients in the high group of granulocytic myeloid-derived suppressor cells (Gr-MDSCs) showed significantly shorter progression-free survival (PFS) than those in the low group (3.98 vs. 8.78 months; hazards ratio (HR), 2.61; p = 0.01). In multivariate analysis, the high Gr-MDSCs value was also associated with shorter PFS (HR, 4.60; 95% confidence interval (CI), 1.79−11.8; p = 0.001). Although significant difference was not found in univariate analysis, the high Gr-MDSCs group was associated with shorter overall survival (OS) (HR, 2.89; 95% CI, 1.23–6.80; p = 0.015) in multivariate analysis.
Materials and Methods: In this explorative prospective study, peripheral blood samples were collected from AGC patients before initiating first-line cisplatin-based chemotherapy (S-1 + cisplatin or S-1 + cisplatin + docetaxel). Peripheral blood mononuclear cells were analyzed for 25 immune subsets by multicolor flow cytometry. PFS and OS were compared between the patients divided into high and low (≥ and < median, respectively) groups based on the median value for each immune cell subset.
Conclusions: The peripheral immune status of Gr-MDSCs appears to affect the prognosis in AGC. Further research is needed to confirm the clinical value of the level of circulating Gr-MDSCs as a prognostic and/or predictive marker in AGC.
INTRODUCTION
Almost one million new cases of gastric cancer were estimated to have occurred in the world in 2012, making it the fifth most common cause of cancer-related death, though its incidence is declining in developed countries [1]. In Japan, gastric cancer is the first most common malignant disease in men and the third in women. While the mortality rate of gastric cancer has been continuously decreasing, it still shows the second highest mortality rate [2]. Systemic chemotherapy is of crucial importance for advanced gastric cancer (AGC) patients, in order to obtain palliation of symptoms and improve survival. However, the prognosis for patients with AGC remains unsatisfied with median survival times of 10–13 months [3, 4].
Immune cells respond to tumor cells and eliminate them in cancer patients. On the other hand, some study showed that the immune system could also prompt tumor progression [5–7]. Therefore, the balance between activation and suppression of immune responses may determine whether cancers avoid detection by immune recognition.
Myeloid-derived suppressor cells (MDSCs), one of the representative immune suppressive cells, are a heterogeneous population of myeloid lineage affecting immature state and having the capacity to suppress T-cell responses. Human MDSCs are classified into CD15+
granulocytic MDSCs (Gr-MDSCs) or CD14+ monocytic
MDSCs (M-MDSCs). As for functional differences, Gr-MDSCs are known to express high levels of arginase and reactive oxygen species (ROS), whereas M-MDSCs express both arginase and inducible nitric oxide synthetase but do not produce high levels of ROS [8]. Several suppressive functions of MDSCs have been suggested such as inhibition of T cell (CD4+ and CD8+) activation,
and increase T cell apoptosis [9, 10]. Recent studies have shown that circulating MDSCs are significantly increased in cancer patients and correlate with clinical cancer stages and metastatic disease [11]. In addition, several studies reported that tumor tissues with high MDSCs infiltration are related to poor prognosis and resistance to various therapies [8, 12].
FoxP3+ T regulatory cells (Tregs), other immune
suppressive cell, accumulate in tumors and increase in the peripheral blood of cancer patients, and the increased Tregs in tumors frequency has been shown to be a marker of poor prognosis in various types of cancers [13, 14].
By contrast, cytotoxic CD4+ or CD8+ T cells
recognize tumor-specific antigen and tumor-associated antigen and exert direct cytotoxic actions against tumor cells. Among the effector T cells, effector memory T cells play an important role for anti-tumor immunity [15, 16].
To date, many retrospective studies have shown the association between these immune cells infiltration and prognosis in various types of tumors. For gastric cancer, several studies have reported a positive association
between the extent of the tumor-infiltrating lymphocyte (TIL) infiltrate and a prognosis [17–19]. However, because the limited opportunities for obtaining resected specimens in AGC patients and TIL analyses are difficult to conduct, alternative immunological parameters in more easily assessable samples for predicting prognosis are needed. The association between peripheral immune status and a prognosis in patients with AGC has not yet been fully cleared to the present time. Thus, we conducted prospective study to quantify 25 immune cell subsets of the lymphocytes in the peripheral blood, and investigate their prognostic impacts in patients with AGC receiving cisplatin-based first-line chemotherapy.
RESULTS
Patient characteristics
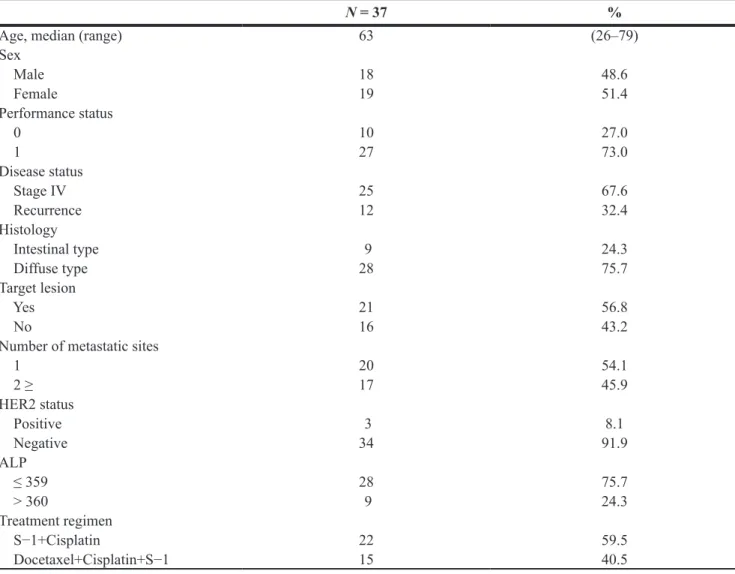
The baseline characteristics of the 37 patients are summarized in Table 1. All patients had good performance status (PS, 0–1). Of 37 patients, 28 (75.7%) were diffuse-type. Twenty-two (59.5%) patients were treated with cisplatin and S-1 (CS), and 15 (40.5%) were treated with docetaxel, cisplatin and S-1 (DCS) (Table 1). A total of 30 (81.0%) patients received second-line chemotherapy (Supplementary Tables 1 and 2).
Clinical course
Median follow-up period was 19.6 months (range; 1.7–22.5). 27 (73.0%) of the 37 patients had died. The median survival time (MST) was 11.7 months (95% CI 8.85–14.2). The median progression-free survival (PFS) was 5.6 months (95% CI 5.56–7.47). No adverse events leading to treatment discontinuation were observed in any patients.
Associations between the quantity of each immune cell subset and PFS
An illustration of the gating strategy and representative dot plots for Gr-MDSCs is shown in Figure 1. The median value of the proportion for Gr-MDSCs was 0.420 % (range, 0.089–7.366). The gating strategy and representative dot plots for other immune cell subsets (M-MDSCs, Tregs, CD4+ or CD8+ T, Dendritic cell (DC),
NK cells, Granzyme B+, Perforin+, or Ki-67+ cells) are shown in Supplementary Figure 1.
Of 37 patients enrolled into this study, analysis of MDSCs was performed in 33 patients. Patients were divided into high (≥ median) and low (< median) groups based on the median value of the proportion for each immune cell subset, and PFS was then compared between each pair of groups (Table 2). The median PFS among patients with Gr-MDSCs high group (4.0 months) was significantly shorter than the median PFS among those
Table 1: Patient characteristics
N = 37 %
Age, median (range) 63 (26–79)
Sex Male 18 48.6 Female 19 51.4 Performance status 0 10 27.0 1 27 73.0 Disease status Stage IV 25 67.6 Recurrence 12 32.4 Histology Intestinal type 9 24.3 Diffuse type 28 75.7 Target lesion Yes 21 56.8 No 16 43.2
Number of metastatic sites
1 20 54.1 2 ≥ 17 45.9 HER2 status Positive 3 8.1 Negative 34 91.9 ALP ≤ 359 28 75.7 > 360 9 24.3 Treatment regimen S−1+Cisplatin 22 59.5 Docetaxel+Cisplatin+S−1 15 40.5
ALP, alkaline phosphatase.
Figure 1: Gating strategy and representative dot plots for granulocytic myeloid-derived suppressor cells (Gr-MDSCs).
with Gr-MDSCs low group (8.8 months) (HR, 2.61; 95%CI, 1.20–5.68; p=0.012; Table 2 and Figure 2). Multivariate analyses demonstrated that the proportion of Gr-MDSCs (HR, 4.60; 95% CI, 1.79―11.8 for high
group vs. low group), having target lesion (HR, 3.43; 95% CI, 1.43―8.22 for yes vs. no), and treatment regimen (HR, 2.77; 95% CI, 1.13―6.80 for DCS regimen vs. CS regimen) were associated with a shorter PFS (Table 3).
Table 2: Association between the quantity of each immune subset and progression-free survival
Factors Hazard ratio* 95% CI p-value
Suppressor cells Granulocytic MDSCs 2.61 1.20–5.68 0.01
Monocytic MDSCs 0.88 0.43–1.82 0.73 CD4+FOXP3+ 0.64 0.32–1.26 0.19 Naïve Tregs 1.00 0.51–1.97 0.99 Effector Tregs 1.01 0.51–2.00 0.98 Effector cells CD3+ 0.79 0.39–1.57 0.49 CD4+ 1.03 0.52–2.04 0.93 Naïve 0.78 0.39–1.56 0.48 Central memory 1.56 0.79–3.07 0.20 Effector memory 0.87 0.44–1.72 0.69
Terminally differentiated effector 0.62 0.31–1.23 0.17
Granzyme B+ 1.14 0.57–2.27 0.71 Perforin+ 0.99 0.50–1.96 0.99 Ki67+ 1.11 0.56–2.18 0.77 CD8+ 0.80 0.40–1.59 0.52 Naïve 1.20 0.61–2.36 0.61 Central memory 0.74 0.38–1.46 0.39 Effector memory 0.65 0.33–1.28 0.21
Terminally differentiated effector 0.65 0.33–1.29 0.21
Granzyme B+ 0.75 0.38–1.49 0.41
Perforin+ 0.85 0.43–1.68 0.65
Ki67+ 0.98 0.50–1.95 0.96
Natural killer 0.78 0.39–1.53 0.47
Antigen presenting cells Myeloid dendritic cells 0.98 0.47–2.04 0.96
Plasmacytoid dendritic cells 0.83 0.40–1.71 0.61
MDSCs, myeloid-derived suppressor cells; Tregs, regulatory T cells. * Low group (< median) in each immune subset was used as a reference.
Figure 2: Progression-free survival curves calculating using the Kaplan-Meier methods for groups classified according to the pretreatment proportion of granulocytic myeloid-derived suppressor cells.
Associations between the quantity of each immune cell subset and overall survival (OS)
Associations between the quantity of each immune cell subset (divided to high and low groups by its median value) and OS are shown in the Table 4. The MST was 8.9 months and 13.9 months in the patients with Gr- MDSCs high and in those with Gr-MDSCs low (p = 0.114; Figure 3), respectively.
The results of the univariate and multivariate analyses are summarized in Table 5. Multivariate analyses demonstrated that the proportion of Gr-MDSCs (HR, 2.89; 95% CI, 1.23―6.80 for high group vs. low group), disease status (HR, 2.81; 95% CI, 1.07―7.36 for stage IV vs. recurrence), and having target lesion (HR, 2.89; 95%
CI, 1.12―7.44 for yes vs. no) were associated with a poor prognosis.
Changes in proportional of Gr-MDSCs during chemotherapy
We investigated the relationship between the changes in proportion of Gr-MDSCs during 1st-line systemic chemotherapy and prognosis. 24 samples at 2nd blood collection were available. The means of % Gr-MDSCs was compared between before (1st blood collection) and after chemotherapy (2nd blood collection) using a paired-t test; however, there was no tendency for changes of %Gr-MDSCs (Supplementary Figure 2A). When dichotomized based on increase or decrease in the
Table 3: Univariate and multivariate Cox regression analyses for progression-free survival
Covariates Univariate Multivariate
HR 95% CI P–value HR 95% CI P–value
Gr-MDSCs
Low Reference Reference
High 2.61 1.20–5.68 0.012 4.60 1.79–11.8 0.001 Age < 65 Reference ≥ 65 0.66 0.30–1.44 0.294 Sex Male Reference Female 0.93 0.45–1.93 0.846 Performance status 0 Reference 1 0.69 0.32–1.48 0.341 Disease status Recurrence Reference Stage IV 1.16 0.55–2.45 0.704 Histology
Intestinal type Reference
Diffuse type 1.30 0.55–3.10 0.548
Target lesion
No Reference Reference
Yes 2.16 1.02–4.60 0.045 3.43 1.43–8.22 0.006
Number of metastatic sites
1 Reference ≥ 2 0.79 0.38–1.63 0.522 HER2 status Negative Reference Positive 1.49 0.20–11.1 0.696 ALP ≤ 359 Reference > 360 1.26 0.57–2.77 0.573 Treatment regimen
Cisplatin+S−1 Reference Reference
Docetaxel+Cisplatin+S−1 1.44 0.68–3.04 0.341 2.77 1.13–6.80 0.026
Table 4: Association between the quantity of each immune subset and overall survival
Factors Hazard ratio* 95% CI p-value
Suppressor cells Granulocytic MDSCs 1.91 0.84–4.31 0.12
Monocytic MDSCs 1.01 0.45–2.26 0.99 CD4+FOXP3+ 0.89 0.42–1.89 0.76 Naïve Tregs 0.79 0.37–1.66 0.53 Effector Tregs 0.94 0.44–1.97 0.86 Effector cells CD3+ 0.61 0.28–1.30 0.20 CD4+ 1.58 0.75–3.35 0.23 Naïve 0.72 0.33–1.54 0.39 Central memory 1.56 0.73–3.31 0.25 Effector memory 0.96 0.46–2.04 0.92
Terminally differentiated effector 0.66 0.31–1.40 0.28
Granzyme B+ 1.88 0.86–4.09 0.11 Perforin+ 1.09 0.51–2.32 0.82 Ki67+ 1.11 0.52–2.33 0.79 CD8+ 0.67 0.32–1.43 0.30 Naïve 0.60 0.28–1.30 0.20 Central memory 0.92 0.44–1.96 0.83 Effector memory 0.72 0.34–1.53 0.40
Terminally differentiated effector 0.91 0.43–1.92 0.81
Granzyme B+ 1.01 0.48–2.12 0.98
Perforin+ 1.06 0.50–2.22 0.89
Ki67+ 0.76 0.36–1.62 0.48
Natural killer 0.98 0.46–2.10 0.96
Antigen presenting cells Myeloid dendritic cells 0.69 0.31–1.56 0.37
Plasmacytoid dendritic cells 0.64 0.28–1.43 0.28
MDSCs, myeloid-derived suppressor cell; Treg, regulatory T cells. * Low group (< median) in each immune subset was used as a reference.
Figure 3: Overall survival curves calculating using the Kaplan-Meier methods for groups classified according to the pretreatment proportion of granulocytic myeloid-derived suppressor cells.
proportion of Gr-MDSCs from baseline versus, there were no correlation with OS (Supplementary Figure 2B).
Immune status proportion of Gr-MDSCs at discontinuing chemotherapy
We next assessed the change of 7 samples, which could be collected at progression. The changes in proportion of Gr-MDSCs at the time of disease
progression from baseline are presented in Table 6. Among the 5 patients with high Gr-MDSCs group at baseline, 4 had a remarkable elevation of the proportion of Gr-MDSCs at disease progression, and had extremely poor survival time. In the patient (no. 33), the proportion of Gr-MDSCs at PD was decreased to 0.610 % from 0.884 %. Interestingly, OS time of the patient was 22.5 months, and he continued to receive subsequent chemotherapy at data cut off.
Table 5: Univariate and multivariate Cox regression analyses for overall survival
Univariate Multivariate
HR 95% CI P–value HR 95% CI P–value
Gr-MDSCs
Low Reference Reference
High 1.91 0.84–4.31 0.114 2.89 1.23–6.80 0.015 Age < 65 Reference ≥ 65 0.79 0.34–1.86 0.592 Sex Male Reference Female 1.03 0.45–2.29 0.949 Performance status 0 Reference 1 1.67 0.66–4.23 0.276 Disease status
Recurrence Reference Reference
Stage IV 2.44 0.96–6.22 0.062 2.81 1.07–7.36 0.035
Histology
Intestinal type Reference
Diffuse type 1.98 0.66–5.92 0.220
Target lesion
No Reference Reference
Yes 2.27 0.98–5.28 0.057 2.89 1.12–7.44 0.028
Number of metastatic sites
1 Reference ≥ 2 1.42 0.63–3.19 0.396 HER2 status Negative Reference Positive 1.64 0.22–12.41 0.631 ALP ≤ 359 Reference > 360 1.50 0.65–3.44 0.344 Treatment regimen Cisplatin+S−1 Reference Docetaxel+Cisplatin+S−1 0.97 0.41–2.29 0.948
Comparison of plasma cytokine concentration according to Gr-MDSCs subgroups
In order to determine whether there is a difference in cytokine concentrations according to Gr-MDSCs subgroups, 8 cytokines in plasma were measured and compared (Supplementary Table 3). The IL-8 level in the Gr-MDSCs high group was significantly higher than that in the Gr-MDSCs low group (mean ± SD, 22.27 ± 11.72 vs. 12.61 ± 6.03; p = 0.01). There were no significant differences in other cytokines, such as IFN-γ, IL-1β, IL-4, IL-6, IL-10, IL-12p70, and TNF-α, between these two groups.
We also analyzed the association between cytokine concentrations and survival (Supplementary Tables 4 and 5). Moreover, we performed multivariate analyses that included cytokines (IL-6 and IL-8 were statistically significant in univariate analyses) in the final models (Tables 3 and 5) as sensitivity analyses (data not shown). In this sensitivity analyses, the peripheral immune status of Gr-MDSCs consistently appears to affect the prognosis in AGC.
DISCUSSION
In this prospective observational study, we analyzed 25 immune cell subsets status, and investigated whether immune cell subsets affected the survival in advanced gastric cancer patients. We found that the high proportion of Gr-MDSCs before chemotherapy was poor prognostic factor for PFS in AGC patients who received cisplatin-based chemotherapy, and tended to be correlated with shorter OS, suggesting that this characteristic might serve as a prognostic factor. This study suggested that immune status may affect the efficacy of chemotherapy in AGC patients.
Many studies reported a survival benefit associated with the presence of TIL [17–22], including gastric cancer. There are very few studies addressed in the clinical significance of MDSCs in gastric cancer tissues. Choi et al. reported the prognostic effects of tumor infiltrating MDSCs. They investigated the frequencies of TILs in
28 surgically resected gastric cancer tissues by using flow cytometry, and showed an increased proportion of MDSCs in tissues was a poor prognostic factor [23]. However, in their study, the association between MDSCs status in peripheral blood and tumor tissues was not investigated. Although information obtained from surgical specimens appear extremely useful, however, TIL analyses are difficult to conduct, giving the limited opportunities for obtaining sufficient specimens in AGC patients. Therefore, we studied the immune cell subsets in peripheral blood samples which were easily obtained with minimally invasive procedure.
In cancer patients, MDSCs in the peripheral blood increase substantially [24–26]. Correlations between circulating number of MDSCs in various types of cancers including gastric cancer and survival have been investigated in two studies so far. Gabitass et al. reported that the high percentage of MDSCs were an independent prognostic factor in patients with pancreatic, esophageal, and gastric cancer [27]. In their report, 25 non-cardia gastric cancer patients were included. Of these, 17 patients were stage IV disease. Wang et al. also found that gastric cancer patients with high MDSCs exhibited a significantly shorter survival time compared with patients with low MDSCs [28]. In the Wang’s study using the similar definition of MDSC subtype to the present study, there was no difference in OS between the high and low groups. The discrepancy between the Wang’s and this study was considered to be caused by the difference in the study population; stage I-IV cases in the Wang’s study and stage IV or recurrent cases in this study.
We assessed how the change in proportion of Gr-MDSC during 1st-line chemotherapy affected OS. Of 37 patients, we could obtained 7 paired pretreatment and 1st-line PD blood samples. In the low group of Gr-MDSCs (n = 2), all patients had comparatively low proportion of Gr-MDSCs at PD, and they had favorable long-term survival. On the other hand, in the high group of Gr-MDSCs at baseline, most patients had high proportion of Gr-MDSCs at PD and they had short-term survival.
Table 6: Changes in the proportion of Gr-MDSCs (%) from baseline and the time of 1st-line
progression
Patient No Regimen Baseline group
Proportion of Gr-MDSCs (%)
OS
(months) (months)PFS Second line therapy Baseline 1st-line PD or 6 months after initiating chemotherapy (whichever comes first)
47 DCS low 0.258 0.148 PD 11.0 (c)** 1.9 CPT-11 35 CS low 0.405 1.223 PD 13.8 4.6 CPT-11 77 DCS high 0.742 6.928 PD 2.0 1.3 PTX 33 DCS high 0.884 0.610 PD 22.5 (c)* 6.6 CPT-11 34 CS high 0.917 1.555 PD 2.4 1.6 PTX 55 CS high 1.157 2.143 PD 5.6 4.0 PTX 30 CS high 2.582 8.789 PD 6.5 5.3 −
Gr-MDSCs, granulocytic myeloid-derived suppressor cells; DCS, docetaxel, cisplatin, plus S-1; CS, cisplatin plus S-1; PD, progressive disease. OS, overall survival; PFS, progression-free survival; CPT-11, irinotecan; PTX, paclitaxel; (c), censored case; *, ongoing treatment at data cut off. **, lost to follow up.
Interestingly, one of five who showed decrease in Gr-MDSCs compared to pretreatment samples, survived long. Preclinical works have suggested that two chemotherapeutic drugs, gemcitabine and 5-fluorouracil (5-FU), deplete MDSCs. As compared to gemcitabine, 5-FU induced a more potent apoptosis-mediated MDSC depletion in vitro and in vivo [29, 30]. Indeed S-1, an oral prodrug of 5-FU, administrated in all patients in our study, that might relate to the changes of MDSCs numbers. Although we could analyze only limited patient samples in high group of Gr-MDSCs, it is speculated that the decrease in Gr-MDSCs level before starting 2nd-line chemotherapy might occur among the rest cases without blood samples available, which could be one of the reasons for not having statistical significance difference in OS between two groups.
We also evaluated plasma cytokines that affect the formation of immune cell subsets. Among eight cytokines, IL-8 was significantly higher in the Gr-MDSCs high group than in the Gr-MDSCs low group. Previous papers showed that IL-8 was contributed to gastrointestinal carcinogenesis through increased recruitment of MDSCs [31]. Furthermore, increased levels of circulating MDSCs were associated with increasing advanced disease stage, increased serum IL-8 levels, and defective T-cell function [32]. From these findings, we suggest that increased IL-8 in our cohort may have contributed to the adverse immune status.
This study has some limitations. First, our study consisted of small number of samples. This resulted in statistical underpowered and limited our ability to identify statistically significant differences among the immune cell subsets. Therefore, the results need to be validated in a prospective manner with sufficient sample size. Second, the possibility that the high population of diffuse-type in our study may affect the immune status cannot be completely excluded. Despite these limitations, our study represents the largest flow cytometric characterization of peripheral immune cell subsets in AGC published so far.
In summary, we explored 25 immune cell subsets in peripheral blood from patients with unresectable AGC before first-line cisplatin-based chemotherapy and identified high proportion of Gr-MDSCs as significant adverse factors for PFS. Furthermore, high proportion of Gr-MDSCs at pretreatment tended to result in a shorter survival period, compared to cases with low proportion of Gr-MDSCs. Further research on a large population is needed in order to validate our results in gastric cancer as well as other types of cancer.
MATERIALS AND METHODS
PatientsPatients with AGC who received systemic first-line systemic chemotherapy between July 2014 and December 2015 at National Cancer Center Hospital were prospectively enrolled.
The eligibility criteria for this study were as follows: 20 years or older; histological proven primary gastric adenocarcinoma; scheduled to receive cisplatin-based first-line chemotherapy (CS regimen or DCS regimen); no active viral infection such as with the human immunodeficiency virus, hepatitis B and/or C. The CS regimen consisted of infusion of cisplatin (60 mg/m2/day)
on day 8 and oral S-1 (80 mg/m2/day) for 3 weeks on
days 1–21 followed by a 2-week rest. The DCS regimen consisted of infusion of docetaxel (40 mg/m2/day) and
cisplatin (60 mg/m2/day) on day 1, and oral S-1 (80 mg/m2/
day) for 2 weeks on days 1–14 followed by a 2-week rest. These treatments were repeated until disease progression, appearance of unacceptable toxicities or patient’s refusal. To evaluate response, systemic computed tomography was repeated every two months.
The following characteristics of patients were collected: age, Eastern Cooperative Oncology Group performance status (ECOG PS), histology, history of gastrectomy, metastatic sites, presence of target lesion according to the response evaluation criteria in solid tumors (RECIST) version 1.1, serum alkaline phosphatase (ALP) level. All of the patients provided informed consent for study registration and blood collection. The study protocol was reviewed and approved by the institutional ethics committee of the National Cancer Center and St. Luke’s International Hospital.
Staining of peripheral blood mononuclear cells
Peripheral blood was collected within 5 days before initiating chemotherapy. The second was performed just before the 3rd cycle (11th week) in the CS cohort or the 3rd cycle (9th week) in the DCS cohort, respectively, and 3rd collection was done at 6 months after initial chemotherapy in both cohorts. In case dicontinuing chemotherapy from any reason before the 2nd or 3rd blood collection, blood was collected at the time of discontinuation. Peripheral blood mononuclear cells (PBMCs) were isolated from peripheral blood by density gradient centrifugation. MDSCs was measured in fresh PBMCs immediately after collection because previous study demonstrated that a part of MDSCs was decreased by cryopreservation [33]. DC was measured at the same time as measurement of MDSCs because common panel was used for both subsets. The rest of PBMCs were cryopreserved and used for measurement of T cells, Tregs, and NK cells.
For staining of intracellular protein (Ki-67, FOXP3, perforin, and granzyme B), FOXP3/Transcription Factor for Staining Buffer Set (eBioscience) was used according to the manufacture’s protocol. 2.5–5 × 10⁵ PBMCs were
suspended with 100 μL staining buffer (PBS containing 2% fetal bovine serum, FBS). The antibodies for surface markers were then added for 30 minutes at 4°C. Used antibodies were as follows; Lineage (Lin, CD3/CD16/ CD19/CD20/CD56) cocktail FITC, CD14-PerCP-Cy5.5, CD11b-APC-Cy7, CD33-PE-Cy7, CD11c-Alexa
Fluor700, CD123-Brilliant Violet 421, CD15-V500, CD3-APC, Ki-67-Alexa Fluor700, CD8-APC-Cy7, Granzyme B-FITC, CD56-PE-CF594 (BD Pharmingen), CD4-Brilliant Violet 650, CD16-PerCP-Cy5.5, CCR7-PerCP-Cy5.5 (Biolegend), FOXP3-PE, CD66b-APC (eBioscience), CD45RA-FITC, HLA-DR-ECD (Beckman Coulter), Perforin-PE (cell sciences). Isotype controls included the appropriate fluorochrome-conjugated mouse IgG1, IgG 1k, or IgG2a k (BD Pharmingen, Biolegend, eBioscience). The stained cells were detected using a LSR II Fortessa with FACS Diva software (BD Biosciences). All analyses were carried out using FlowJo software (Tree star).
Definition and analysis of immune subsets
Twenty-five immune subsets were analyzed in this study. Definitions of immune subsets were as follows; Gr-MDSCs, CD33dimCD15+CD66+CD11b+:
M-MDSCs, Lin−CD14+CD33+CD11b+HLA-DRlow/-: naive
Tregs: CD3+CD4+CD45RA+FOXP3low: effector Tregs,
CD3+CD4+CD45RA-FOXP3high: plasmacytoid DC, Lin−
CD14−CD123+HLA-DRhigh: myeloid DC, Lin−CD14−
CD11c+HLA-DRhigh. T cells were classified as naïve
(CD45RA+CCR7+), central memory (CD45RA−CCR7+),
effector memory (CD45RA−CCR7−), and terminally
differentiated effector cells (CD45RA+CCR7−) in CD4+ or
CD8+ cells. The expression levels of granzyme B, perforin,
and Ki-67 were also assessed in CD4+ or CD8+ T cells.
Appropriate isotype controls were used for cut-off between positivity and negativity.
The proportion of lymphoid subsets was obtained by dividing cell number of each subset by cell number of lymphocyte fraction based on the result from flow cytometry analysis. The proportion of Gr-MDSCs was calculated by dividing the cell number of CD33dimCD15+CD66+CD11b+
cells by the number of PBMCs.
Measurement of cytokines in plasma
Cryopreserved plasma was used for measuring interferon (IFN)-γ, interleukin (IL)-1β, IL-4, IL-6, IL-8, IL-10, IL-12p70, and tumor necrosis factor (TNF)-α. These cytokines were simultaneously measured on an MSD SECTOR Imager 2400 instrument (Meso Scale Discovery, Inc) according to the manufacturer’s protocol.
Statistical analysis
Differences between categorical variables were assessed using the Fisher’s exact tests. Based on the median value of proportion for each immune cell subset, the patients were divided into high (≥ median) and low (< median) groups. The Mann-Whitney U test was used for comparisons of measured values of cytokines. PFS was defined as the time from initiation of chemotherapy until detection of progression. Patients who were lost to
follow-up were treated as censored observations at the last contact. The OS period was defined as the time from initiation of chemotherapy until the date of death or the latest follow-up. Patients who were lost to follow-up were treated as censored cases at the last confirmation of survival. PFS and OS curves were calculated using the Kaplan-Meier method, and compared with the log-rank test. The median follow-up time for survival was calculated by means of the reverse Kaplan–Meier method. For univariate and multivariate analyses, the Cox proportional regression model was used.
All P values are two-sided. P values of < 0.05 were considered to indicate statistical significance, and 95 % confidence intervals were calculated. All statistical analyses were performed using SAS software version 9.4 (SAS Institute, Cary, NC, USA), and Graphpad Prism 5 software package.
ACKNOWLEDGMENTS
We thank all the participants, physicians, nurses and staff members who supported this study. We also thank Kei Nakano-Miura and Tsukasa Shinohara, who provided invaluable technical support.
CONFLICTS OF INTEREST
No potential conflicts of interest were disclosed.
FUNDING
This work was supported in part by JSPS KAKENHI (Grants-in-Aid for Scientific Research), a Grant-in-Aid for Cancer Research from the Ministry of Health, Labor and Welfare of Japan and the National Cancer Center Research and Development Fund (23-A-44 and 26-A-11).
REFERENCES
1. GLOBOCAN 2012: cancer incidence and mortality worldwide. Available from: http://globocan.iarc.fr/Default. aspx [Last accessed 14 February 2016].
2. Katanoda K, Hori M, Matsuda T, Shibata A, Nishino Y, Hattori M, Soda M, Ioka A, Sobue T, Nishimoto H. An updated report on the trends in cancer incidence and mortality in Japan, 1958–2013. Jpn J Clin Oncol. 2015; 45:390–401.
3. Koizumi W, Narahara H, Hara T, Takagane A, Akiya T, Takagi M, Miyashita K, Nishizaki T, Kobayashi O, Takiyama W, Toh Y, Nagaie T, Takagi S, et al. S-1 plus cisplatin versus S-1 alone for first-line treatment of advanced gastric cancer (SPIRITS trial): a phase III trial. Lancet Oncol. 2008; 9:215–221.
4. Yamada Y, Higuchi K, Nishikawa K, Gotoh M, Fuse N, Sugimoto N, Nishina T, Amagai K, Chin K, Niwa Y,
Tsuji A, Imamura H, Tsuda M, et al. Phase III study comparing oxaliplatin plus S-1 with cisplatin plus S-1 in chemotherapy-naive patients with advanced gastric cancer. Ann Oncol. 2015; 26:141–148.
5. Nomi T, Sho M, Akahori T, Hamada K, Kubo A, Kanehiro H, Nakamura S, Enomoto K, Yagita H, Azuma M, Nakajima Y. Clinical significance and therapeutic potential of the programmed death-1 ligand/programmed death-1 pathway in human pancreatic cancer. Clin Cancer Res. 2007; 13:2151–2157.
6. Martinez-Bosch N, Fernandez-Barrena MG, Moreno M, Ortiz-Zapater E, Munne-Collado J, Iglesias M, Andre S, Gabius HJ, Hwang RF, Poirier F, Navas C, Guerra C, Fernandez-Zapico ME, et al. Galectin-1 drives pancreatic carcinogenesis through stroma remodeling and Hedgehog signaling activation. Cancer Res. 2014; 74:3512–3524. 7. Feig C, Jones JO, Kraman M, Wells RJ, Deonarine A,
Chan DS, Connell CM, Roberts EW, Zhao Q, Caballero OL, Teichmann SA, Janowitz T, Jodrell DI, et al. Targeting CXCL12 from FAP-expressing carcinoma-associated fibroblasts synergizes with anti-PD-L1 immunotherapy in pancreatic cancer. Proc Natl Acad Sci USA. 2013; 110:20212–20217. 8. Gabrilovich DI, Ostrand-Rosenberg S, Bronte V.
Coordinated regulation of myeloid cells by tumours. Nat Rev Immunol. 2012; 12:253–268.
9. Kobayashi N, Kubota K, Kato S, Watanabe S, Shimamura T, Kirikoshi H, Saito S, Ueda M, Endo I, Inayama Y, Maeda S, Nakajima A. FOXP3+ regulatory T cells and tumoral indoleamine 2,3-dioxygenase expression predicts the carcinogenesis of intraductal papillary mucinous neoplasms of the pancreas. Pancreatology. 2010; 10:631–640. 10. Ghiringhelli F, Menard C, Terme M, Flament C, Taieb J,
Chaput N, Puig PE, Novault S, Escudier B, Vivier E, Lecesne A, Robert C, Blay JY, et al. CD4+CD25+ regulatory T cells inhibit natural killer cell functions in a transforming growth factor-beta-dependent manner. J Exp Med. 2005; 202:1075–1085.
11. Diaz-Montero CM, Salem ML, Nishimura MI, Garrett-Mayer E, Cole DJ, Montero AJ. Increased circulating myeloid-derived suppressor cells correlate with clinical cancer stage, metastatic tumor burden, and doxorubicin-cyclophosphamide chemotherapy. Cancer Immunol Immunother. 2009; 58:49–59.
12. Mantovani A. The growing diversity and spectrum of action of myeloid-derived suppressor cells. Eur J Immunol. 2010; 40:3317–3320.
13. Bates GJ, Fox SB, Han C, Leek RD, Garcia JF, Harris AL, Banham AH. Quantification of regulatory T cells enables the identification of high-risk breast cancer patients and those at risk of late relapse. J Clin Oncol. 2006; 24:5373–5380. 14. Perrone G, Ruffini PA, Catalano V, Spino C, Santini D,
Muretto P, Spoto C, Zingaretti C, Sisti V, Alessandroni P, Giordani P, Cicetti A, D’Emidio S, et al. Intratumoural FOXP3-positive regulatory T cells are associated with adverse prognosis in radically resected gastric cancer. Eur J Cancer. 2008; 44:1875–1882.
15. Fridman WH, Pages F, Sautes-Fridman C, Galon J. The immune contexture in human tumours: impact on clinical outcome. Nat Rev Cancer. 2012; 12:298–306.
16. Rizvi NA, Hellmann MD, Snyder A, Kvistborg P, Makarov V, Havel JJ, Lee W, Yuan J, Wong P, Ho TS, Miller ML, Rekhtman N, Moreira AL, et al. Cancer immunology. Mutational landscape determines sensitivity to PD-1 blockade in non-small cell lung cancer. Science. 2015; 348:124–128.
17. Lee HE, Chae SW, Lee YJ, Kim MA, Lee HS, Lee BL, Kim WH. Prognostic implications of type and density of tumour-infiltrating lymphocytes in gastric cancer. Br J Cancer. 2008; 99:1704–1711.
18. Kim KJ, Lee KS, Cho HJ, Kim YH, Yang HK, Kim WH, Kang GH. Prognostic implications of tumor-infiltrating FoxP3+ regulatory T cells and CD8+ cytotoxic T cells in microsatellite-unstable gastric cancers. Hum Pathol. 2014; 45:285–293.
19. Kang BW, Seo AN, Yoon S, Bae HI, Jeon SW, Kwon OK, Chung HY, Yu W, Kim JG. Prognostic value of Tumor-infiltrating lymphocytes in Epstein-Barr virus-associated gastric cancer. Ann Oncol. 2016; 27:494–501.
20. Zhang L, Conejo-Garcia JR, Katsaros D, Gimotty PA, Massobrio M, Regnani G, Makrigiannakis A, Gray H, Schlienger K, Liebman MN, Rubin SC, Coukos G. Intratumoral T cells, recurrence, and survival in epithelial ovarian cancer. N Engl J Med. 2003; 348:203–213.
21. Sato E, Olson SH, Ahn J, Bundy B, Nishikawa H, Qian F, Jungbluth AA, Frosina D, Gnjatic S, Ambrosone C, Kepner J, Odunsi T, Ritter G, et al. Intraepithelial CD8+ tumor-infiltrating lymphocytes and a high CD8+/regulatory T cell ratio are associated with favorable prognosis in ovarian cancer. Proc Natl Acad Sci USA. 2005; 102:18538–18543. 22. Galon J, Costes A, Sanchez-Cabo F, Kirilovsky A,
Mlecnik B, Lagorce-Pages C, Tosolini M, Camus M, Berger A, Wind P, Zinzindohoue F, Bruneval P, Cugnenc PH, et al. Type, density, and location of immune cells within human colorectal tumors predict clinical outcome. Science. 2006; 313:1960–1964.
23. Choi HS, Ha SY, Kim HM, Ahn SM, Kang MS, Kim KM, Choi MG, Lee JH, Sohn TS, Bae JM, Kim S, Kang ES. The prognostic effects of tumor infiltrating regulatory T cells and myeloid derived suppressor cells assessed by multicolor flow cytometry in gastric cancer patients. Oncotarget. 2016; 7:7940–7951. https://doi.org/10.18632/oncotarget.6958. 24. Ochoa AC, Zea AH, Hernandez C, Rodriguez PC. Arginase,
prostaglandins, and myeloid-derived suppressor cells in renal cell carcinoma. Clin Cancer Res. 2007; 13:721s–726s. 25. Almand B, Clark JI, Nikitina E, van Beynen J, English NR,
Knight SC, Carbone DP, Gabrilovich DI. Increased production of immature myeloid cells in cancer patients: a mechanism of immunosuppression in cancer. J Immunol. 2001; 166:678–689.
26. Mirza N, Fishman M, Fricke I, Dunn M, Neuger AM, Frost TJ, Lush RM, Antonia S, Gabrilovich DI.
All-trans-retinoic acid improves differentiation of myeloid cells and immune response in cancer patients. Cancer Res. 2006; 66:9299–9307.
27. Gabitass RF, Annels NE, Stocken DD, Pandha HA, Middleton GW. Elevated myeloid-derived suppressor cells in pancreatic, esophageal and gastric cancer are an independent prognostic factor and are associated with significant elevation of the Th2 cytokine interleukin-13. Cancer Immunol Immunother. 2011; 60:1419–1430.
28. Wang L, Chang EW, Wong SC, Ong SM, Chong DQ, Ling KL. Increased myeloid-derived suppressor cells in gastric cancer correlate with cancer stage and plasma S100A8/A9 proinflammatory proteins. J Immunol. 2013; 190:794–804.
29. Vincent J, Mignot G, Chalmin F, Ladoire S, Bruchard M, Chevriaux A, Martin F, Apetoh L, Rebe C, Ghiringhelli F. 5-Fluorouracil selectively kills tumor-associated myeloid-derived suppressor cells resulting in enhanced T cell-dependent antitumor immunity. Cancer Res. 2010; 70:3052–3061.
30. Bruchard M, Mignot G, Derangere V, Chalmin F, Chevriaux A, Vegran F, Boireau W, Simon B, Ryffel B, Connat JL, Kanellopoulos J, Martin F, Rebe C, et al.
Chemotherapy-triggered cathepsin B release in myeloid-derived suppressor cells activates the Nlrp3 inflammasome and promotes tumor growth. Nat Med. 2013; 19:57–64.
31. Asfaha S, Dubeykovskiy AN, Tomita H, Yang X, Stokes S, Shibata W, Friedman RA, Ariyama H, Dubeykovskaya ZA, Muthupalani S, Ericksen R, Frucht H, Fox JG, et al. Mice that express human interleukin-8 have increased mobilization of immature myeloid cells, which exacerbates inflammation and accelerates colon carcinogenesis. Gastroenterology. 2013; 144:155–166.
32. Chi N, Tan Z, Ma K, Bao L, Yun Z. Increased circulating myeloid-derived suppressor cells correlate with cancer stages, interleukin-8 and -6 in prostate cancer. Int J Clin Exp Med. 2014; 7:3181–3192.
33. Kotsakis A, Harasymczuk M, Schilling B, Georgoulias V, Argiris A, Whiteside TL. Myeloid-derived suppressor cell measurements in fresh and cryopreserved blood samples. J Immunol Methods. 2012; 381:14–22.