2
Secular stagnation and endogenous money
Steve Keen
[www.debtdeflation.com/blogs]Copyright: Steve Keen, 2014 You may post comments on this paper at
http://rwer.wordpress.com/comments-on-rwer-issue-no-66/
The crisis of 2007/08 has generated many anomalies for conventional economic theory, not the least that it happened in the first place. Though mainstream economic thought has many channels, the common belief before this crisis was that either crises cannot occur (Edward C. Prescott, 1999), or that the odds of such events had either been reduced (Ben Bernanke, 2002) or eliminated (Robert E. Lucas, Jr., 2003) courtesy of the scientific understanding of the economy that mainstream theory had developed.
This anomaly remains unresolved, but time has added another that is more pressing: the fact that the downturn has persisted for so long after the crisis. Recently Larry Summers suggested a feasible explanation in a speech at the IMF. “Secular stagnation”, Summers suggested, was the real explanation for the continuing slump, and it had been with us for long before this crisis began. Its visibility was obscured by the Subprime Bubble, but once that burst, it was evident.
This hypothesis asserts, in effect, that the crisis itself was a second-order event: the main event was a tendency to inadequate private sector demand which may have existed for decades, and has only been masked by a sequence of bubbles. The policy implication of this hypothesis is that generating adequate demand to ensure full employment in the future may require a permanent stimulus from the government – meaning both the Congress and the Fed – and perhaps the regular creation of asset market bubbles.
What could be causing the secular stagnation – if it exists? Krugman (Paul Krugman, 2013b) noted a couple of factors: a slowdown in population growth (which is obviously happening: see Figure 1); and “a Bob Gordonesque decline in innovation” (which is rather more conjectural).
Though Summers’ thesis has its mainstream critics, there’s a chorus of New Keynesian support for the “secular stagnation” argument, which implies it will soon become the conventional explanation for the persistence of this slump long after the initial financial crisis has passed.
Krugman’s change of tune here is representative. His most recent book-length foray into what caused the crisis – and what policy would get us out of it – was entitled End This Depression NOW!. The title, as well as the book’s contents, proclaimed that this crisis could be ended “in the blink of an eye”. All it would take, Krugman then proposed, was a sufficiently large fiscal stimulus to help us escape the “Zero Lower Bound”:
The sources of our suffering are relatively trivial in the scheme of things, and could be fixed quickly and fairly easily if enough people in positions of power understood the realities…
One main theme of this book has been that in a deeply depressed economy, in which the interest rates that the monetary authorities can control are near zero, we need more, not less, government spending. A burst of federal
3
spending is what ended the Great Depression, and we desperately need something similar today. (Paul Krugman, 2012, pp. 23, 231)
Figure 1: Population growth rates are slowing
1950 1955 1960 1965 1970 1975 1980 1985 1990 1995 2000 2005 2010 20150 0.5
1 1.5 2
USA Annual population growth
www.debtdeflation.com/blogs
P
er
ce
n
t p
.a
.
Post-Summers, Krugman is suggesting that a short, sharp burst of government spending will not be enough to restore “the old normal”. Instead, to achieve pre-crisis rates of growth in future – and pre-crisis levels of unemployment – permanent government deficits, and permanent Federal Reserve spiking of the asset market punch via QE and the like, may be required.
Not only that, but past apparent growth successes – such as The Period Previously Known as The Great Moderation – may simply have been above-stagnation rates of growth motivated by bubbles:
So how can you reconcile repeated bubbles with an economy showing no sign of inflationary pressures? Summers’s answer is that we may be an economy that needs bubbles just to achieve something near full employment – that in the absence of bubbles the economy has a negative natural rate of interest. And this hasn’t just been true since the 2008 financial crisis; it has arguably been true, although perhaps with increasing severity, since the 1980s. (Paul Krugman, 2013b)
This argument elevates the “Zero Lower Bound” from being merely an explanation for the Great Recession to a General Theory of Macroeconomics: if the ZLB is a permanent state of affairs given secular stagnation, then permanent government stimulus and permanent bubbles may be needed to overcome it:
One way to get there would be to reconstruct our whole monetary system – say, eliminate paper money and pay negative interest rates on deposits.
4
Another way would be to take advantage of the next boom – whether it’s a bubble or driven by expansionary fiscal policy – to push inflation substantially higher, and keep it there. Or maybe, possibly, we could go the Krugman 1998/Abe 2013 route of pushing up inflation through the sheer power of self-fulfilling expectations. (Paul Krugman, 2013b)
So is secular stagnation the answer to the puzzle of why the economy hasn’t recovered post the crisis? And is permanently blowing bubbles (as well as permanent fiscal deficits) the solution?
Firstly there is ample evidence for a slowdown in the rate of economic growth over time – as well as its precipitate fall during and after the crisis.
Figure 2: A secular slowdown in growth caused by a secular trend to stagnation?
1950 1955 1960 1965 1970 1975 1980 1985 1990 1995 2000 2005 2010 20155 −4 −3 −2 − 1 − 0 1 2 3 4 5 6 7 8 9 10 11 12 13 14 15
Nominal
Real
US annual growth rate
www.debtdeflation.com/blogs
P
er
ce
n
t p
.a
.
0 CrisisThe growth rate was as high as 4.4% p.a. on average from 1950-1970, but fell to about 3.2% p.a. from 1970-2000 and was only 2.7% in the Naughties prior to the crisis – after which it has plunged to an average of just 0.9% p.a. (see Table 1).
Table 1: US Real growth rates per annum by decade
Start End Growth rate p.y. for decade Growth rate since 1950
1950 1960 4.2 4.2 1960 1970 4.6 4.4 1970 1980 3.2 4 1980 1990 3.1 3.8 1990 2000 3.2 3.7 2000 2008 2.7 3.5 2008 Now 0.9 3.3
5
So the sustained growth rate of the US economy is lower now than it was in the 1950s– 1970s, and the undoubted demographic trend that Krugman nominates is clearly one factor in this decline.
Another factor that Krugman alludes to in his post is the rise in household debt during 1980-2010 – which at first glance is incompatible with the “Loanable Funds” model of lending to which he subscribes.1 In the Loanable Funds model, the aggregate level of debt (and changes in that level) are irrelevant to macroeconomics – only the distribution of debt can have significance:
Ignoring the foreign component, or looking at the world as a whole, we see that the overall level of debt makes no difference to aggregate net worth – one person’s liability is another person’s asset. It follows that the level of debt matters only if the distribution of net worth matters, if highly indebted players face different constraints from players with low debt. (Paul Krugman, 2012a, p. 146)
Furthermore, the distribution of debt can only have macroeconomic significance at peculiar times, when the market mechanism is unable to function because the “natural rate of interest” – the real interest rate that will clear the market for Loanable Funds, and lead to zero inflation with other markets (including labor) in equilibrium – is negative.
Prior to Summers’ thesis, Krugman had argued that this peculiar period began in 2008 when the economy entered a “Liquidity Trap”. Private debt matters during a Liquidity Trap because lenders, worried about the capacity of borrowers to repay, impose a limit on debt that forces borrowers to repay their debt and spend less. To maintain the full-employment equilibrium, people who were once lenders have to spend more to compensate for the fall in spending by now debt-constrained borrowers.
But lenders are patient people, who by definition have a lower rate of time preference than borrowers, who are impatient people:
Now, if people are borrowing, other people must be lending. What induced the necessary lending? Higher real interest rates, which encouraged “patient” economic agents to spend less than their incomes while the impatient spent more. (Krugman, “Deleveraging and the Depression Gang”)
The problem in a Liquidity Trap is that rates can’t go low enough to encourage patient agents to spend enough to compensate for the decline in spending by now debt-constrained impatient agents.
You might think that the process would be symmetric: debtors pay down their debt, while creditors are correspondingly induced to spend more by low real interest rates. And it would be symmetric if the shock were small enough. In fact, however, the deleveraging shock has been so large that we’re hard up
1 I won’t consider other potential causes here. These range from the rather more dubious suggestion
of a decline in innovation made by Krugman, to factors that Neoclassical economists like Krugman dismiss but others have proposed as major factors – such as the relocation of production from the USA to low wage countries – to factors on which there is more agreement, such as the rise in inequality.
6
against the zero lower bound; interest rates can’t go low enough. And so we have a persistent excess of desired saving over desired investment, which is to say persistently inadequate demand, which is to say a depression. (Krugman, “Deleveraging and the Depression Gang”)
After Summers, Krugman started to surmise that the economy may have been experiencing secular stagnation since 1985, and that only the rise in household debt masked this phenomenon. Consequently the level and rate of change of private debt could have been macroeconomically significant not merely since 2008, but since as long ago as 1985.
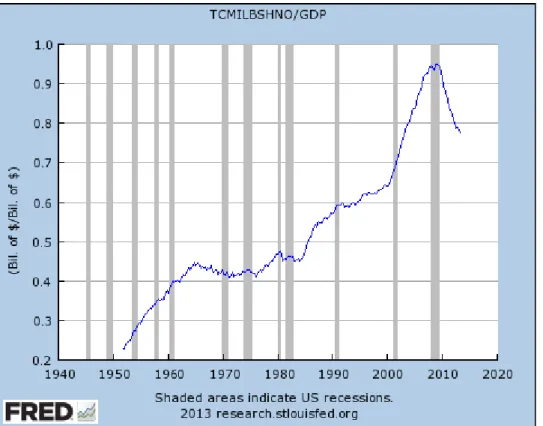
Figure 3: Ratio of household debt to GDP
Commenting on the data (Figure 3, sourced from the St Louis Fed’s excellent FRED database, is taken from Krugman’s post), Krugman noted that perhaps the increase in debt from 1985 on masked the tendency to secular stagnation. Crucially, he proposed that the “natural rate of interest” was negative perhaps since 1985, and only the demand from borrowers kept actual rates positive. This in turn implied that, absent bubbles in the stock and housing markets, the economy would have been in a liquidity trap since 1985:
There was a sharp increase in the ratio after World War II, but from a low base, as families moved to the suburbs and all that. Then there were about 25 years of rough stability, from 1960 to around 1985. After that, however, household debt rose rapidly and inexorably, until the crisis struck.
So with all that household borrowing, you might have expected the period 1985-2007 to be one of strong inflationary pressure, high interest rates, or both. In fact, you see neither – this was the era of the Great Moderation, a time of low inflation and generally low interest rates. Without all that increase in household debt, interest rates would presumably have to have been
7
considerably lower – maybe negative. In other words, you can argue that our economy has been trying to get into the liquidity trap for a number of years, and that it only avoided the trap for a while thanks to successive bubbles.
In general, the Loanable Funds model denies that private debt matters macroeconomically, as Krugman put it emphatically in a series of blog posts in 2012:
Keen then goes on to assert that lending is, by definition (at least as I understand it), an addition to aggregate demand. I guess I don't get that at all. If I decide to cut back on my spending and stash the funds in a bank, which lends them out to someone else, this doesn't have to represent a net increase in demand. Yes, in some (many) cases lending is associated with higher demand, because resources are being transferred to people with a higher propensity to spend; but Keen seems to be saying something else, and I'm not sure what. I think it has something to do with the notion that creating money = creating demand, but again that isn't right in any model I understand. (Paul Krugman, 2012b. Emphasis added).
However, the Summers conjecture provides a means by which private debt could assume macroeconomic significance since 1985 within the Loanable Funds model. Once secular stagnation commenced – driven, in this conjecture, by the actual drop in the rate of growth of population and a hypothesized decline in innovation – the economy was effectively in a liquidity trap, and somehow rising debt hid it from view.
That is the broad brush, but I expect that explaining this while remaining true to the Loanable Funds model will not be an easy task—since, like a Liquidity Trap itself, the Loanable Funds model is not symmetric. Whereas Krugman was able to explain how private debt causes aggregate demand to fall when debt is falling and remain true to the Loanable Funds model (in which banks are mere intermediaries and both banks and money can be ignored – see Gauti B. Eggertsson and Paul Krugman, 2012), it will be much harder to explain how debt adds to aggregate demand when it is rising. This case is easily made in an Endogenous Money model in which banks create new spending power, but it fundamentally clashes with Loanable Funds in which lending simply redistributes existing spending power from lenders to borrowers. Nonetheless, Krugman has made such a statement in a post-Summers blog:
Debt was rising by around 2 percent of GDP annually; that’s not going to happen in future, which a naïve calculation suggests means a reduction in demand, other things equal, of around 2 percent of GDP. (Paul Krugman, 2013a)
If he manages to produce such a model, and if it still maintains the Loanable Funds framework, then the model will need to show that private debt affects aggregate demand only during a period of either secular stagnation or a liquidity slump – otherwise the secular-stagnation-augmented Loanable Funds model will be a capitulation in all but name to the Endogenous Money camp (Nick Rowe, 2013).2 Assuming that this is what Krugman will
2
Nick Rowe has shown how my oft-repeated shorthand that aggregate demand is income plus the
change in debt can be expressed in a Neoclassical manner, so long as one acknowledges the Endogenous Money case that bank lending creates new money: “Aggregate actual nominal income equals aggregate expected nominal income plus amount of new money created by the banking system minus increase in the stock of money demanded.” However as well as abandoning Loanable
8
attempt, I want to consider the empirical evidence on the relevance of private debt to macroeconomics. If it is indeed true that private debt only mattered post-1985, then this is compatible with a secular-stagnation-augmented Loanable Funds model – whatever that may turn out to be. But if private debt matters before 1985, when secular stagnation was clearly not an issue, then this points in the direction of Endogenous Money being the empirically correct model.
I will consider two indicators: the correlation between change in aggregate private nonfinancial sector debt and unemployment, and the correlation between the acceleration of aggregate private nonfinancial sector debt3 and the change in unemployment. I am also using two much longer time series for debt and unemployment. Figure 4 extends Krugman’s FRED chart by including business sector debt as well (click here to see how this data was compiled – and a longer term estimate for US debt that extends back to 1834: the data is downloadable from here). The unemployment data shown in Figure 5 is compiled from BLS and NBER statistics and Lebergott’s estimates (Stanley Lebergott, 1986, 1954, Christina Romer, 1986) and extends back to 1890.
Figure 4: Long term series on American private debt
1890 1900 1910 1920 1930 1940 1950 1960 1970 1980 1990 2000 2010 20200 20 40 60 80 100 120 140 160 180 200
Household
Non-financial Business
Total Private Non-Financial
Private sector debt since 1900
www.debtdeflation.com/blogs
P
er
ce
n
t o
f G
D
P
Funds, this perspective requires abandoning equilibrium analysis as well: “We are talking about a Hayekian process in which individuals' plans and expectations are mutually inconsistent in aggregate. We are talking about a disequilibrium process in which people's plans and expectations get revised in the light of the surprises that occur because of that mutual inconsistency.” I see both these as positive developments, but the habitual methods of Neoclassical economics may mean that these developments will not last.
3 Defined as the change in the change in debt over a year (to crudely smooth the extremely volatile
9
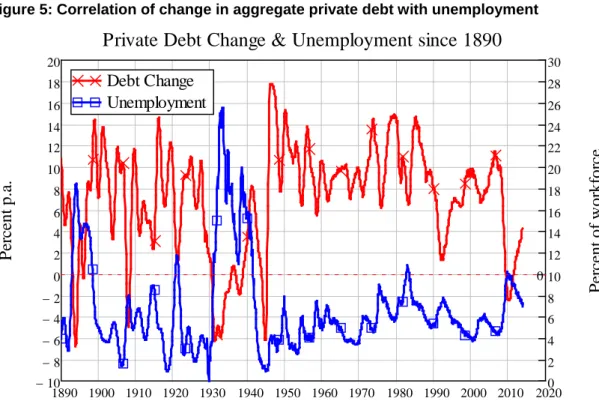
Figure 5: Correlation of change in aggregate private debt with unemployment
1890 1900 1910 1920 1930 1940 1950 1960 1970 1980 1990 2000 2010 2020 10 − 8 − 6 − 4 − 2 − 0 2 4 6 8 10 12 14 16 18 20 0 2 4 6 8 10 12 14 16 18 20 22 24 26 28 30
Debt Change
Unemployment
Private Debt Change & Unemployment since 1890
www.debtdeflation.com/blogs
P
er
ce
n
t p
.a
.
P
er
ce
n
t o
f w
o
rk
fo
rc
e
0Correlation is not causation as the cliché goes, but a correlation coefficient of -0.57 over almost 125 years implies that the change in debt has macroeconomic significance at all times – and not just during either secular stagnation or liquidity traps.
Table 2: Correlation of change in aggregate private debt with unemployment by decade Correlation with level of unemployment
Start End Percentage change Change as percent of GDP
1890 2013 -0.57 -0.51 1890 1930 -0.59 -0.6 1930 1940 -0.36 -0.38 1940 1950 0.15 0.32 1950 1960 -0.48 -0.28 1960 1970 -0.33 -0.58 1970 1980 -0.41 -0.37 1980 1990 -0.27 -0.55 1990 2000 -0.95 -0.95 2000 2013 -0.97 -0.95
Shorter time spans emphasize the point that neither secular stagnation nor liquidity traps can be invoked to explain why changes in the level of private debt have macroeconomic significance. Secular stagnation surely didn’t apply between 1890 and 1930, yet the correlation is-0.6; neither secular stagnation nor a liquidity trap applied in the period from 1950 till 1970, yet the correlation is substantial in those years as well.
10
The correlation clearly jumps dramatically in the period after the Stock Market Crash of 1987, but that is more comfortably consistent with the basic Endogenous Money case that I have been making – that new private debt created by the banking sector adds to aggregate demand – than it will be with any secular-stagnation-augmented Loanable Funds model. The debt acceleration data (Michael Biggs and Thomas Mayer, 2010, Michael Biggs et al., 2010) hammers this point even further. Figure 6 shows the acceleration of aggregate private sector debt and change in unemployment from 1955 (three years after quarterly data on debt first became available) till now. The correlation between the two series is -0.69.
Figure 6: Correlation of acceleration in aggregate private debt with change in unemployment
1955 1960 1965 1970 1975 1980 1985 1990 1995 2000 2005 2010 2015 15 −14 −13 −12 −11 −10 −−9 8 −7 −6 −5 −4 −3 −2 −1 −0 1 2 3 4 5 6 7 180 168 156 144 132 120 108 96 84 72 60 48 36 24 12 0 12 −24 −36 −48 −60 −72 −84 −
Debt Acceleration
Unemployment Change
Debt Acceleration and Unemployment Change
www.debtdeflation.com/blogs
P
er
ce
nt
of
G
D
P
p.a
. p.a
.
P
er
ce
nt
p.a
. (
inve
rt
ed)
0 2008As with the change in debt and unemployment correlation, shorter time spans underline the message that private debt matters at all times. Though the correlation is strikingly higher since 1987 – a date I emphasize because I believe that Greenspan’s actions in rescuing that bubble then led to the Ponzi economy that America has since become – it is high throughout, including in times when neither “secular stagnation” nor a “liquidity trap” can be invoked. Table 3: Correlation of acceleration in aggregate private debt with change in unemployment by decade
Start End Correlation 1950 2013 -0.6 1950 1960 -0.53 1960 1970 -0.61 1970 1980 -0.79 1980 1990 -0.6 1990 2000 -0.86 2000 2013 -0.89
11
I await the IS-LM or New Keynesian DSGE model that Krugman will presumably produce to provide an explanation for the persistence of the crisis in terms that, however tortured, emanate from conventional economic logic in which banks and money are ignored (though private debt is finally considered), and in which everything happens in equilibrium. But however clever it might be, it will not be consistent with the data.
References
Bernanke, Ben. 2002. "Deflation: Making Sure "It" Doesn't Happen Here," Washington: Federal Reserve Board.
Biggs, Michael and Thomas Mayer. 2010. "The Output Gap Conundrum." Intereconomics/Review of European Economic Policy, 45(1), 11-16.
Biggs, Michael; Thomas Mayer and Andreas Pick. 2010. "Credit and Economic Recovery: Demystifying Phoenix Miracles." SSRN eLibrary.
Eggertsson, Gauti B. and Paul Krugman. 2012. "Debt, Deleveraging, and the Liquidity Trap: A Fisher-Minsky-Koo Approach." Quarterly Journal of Economics, 127, 1469–513.
Krugman, Paul. 2012a. End This Depression Now! New York: W.W. Norton.
____. 2012b. "Minsky and Methodology (Wonkish)," The Conscience of a Liberal. New York: New York Times.
____. 2013a. "Secular Stagnation Arithmetic," P. Krugman, The Conscience of a Liberal. New York: New York Times.
____. 2013b. "Secular Stagnation, Coalmines, Bubbles, and Larry Summers," P. Krugman, The Conscience of a Liberal. New York: New York Times.
Lebergott, Stanley. 1986. "Discussion of Romer and Weir Papers." The Journal of Economic History, 46(2), 367-71.
____. 1954. "Measuring Unemployment." The Review of Economics and Statistics, 36(4), 390-400. Lucas, Robert E., Jr. 2003. "Macroeconomic Priorities." American Economic Review, 93(1), 1-14. Prescott, Edward C. 1999. "Some Observations on the Great Depression." Federal Reserve Bank of Minneapolis Quarterly Review, 23(1), 25-31.
Romer, Christina. 1986. "Spurious Volatility in Historical Unemployment Data." Journal of Political Economy, 94(1), 1-37.
Rowe, Nick. 2013. "What Steve Keen Is Maybe Trying to Say," N. Rowe, Worthwhile Canadian Initiative. Canada: Nick Rowe.
Author contact: debunking@gmail.com ___________________________ SUGGESTED CITATION:
Steve Keen, “Secular stagnation and endogenous money”, real-world economics review, issue no. 66, xx January 2014, pp. 2-11, http://www.paecon.net/PAEReview/issue66/Keen66.pdf
You may post and read comments on this paper at http://rwer.wordpress.com/comments-on-rwer-issue-no-66/