ABSTRACT
Alanna Smith: Effects of Dual-Frequency Ultrasound Excitation on the Cavitation of Microbubble Contrast Agents for Use in Tumor Ablation Therapy
(Under the direction of Paul Dayton)
Background: Ultrasound ablation therapy has emerged as a potential cancer tumor treatment because of its ability to selectively destroy tissue in a targeted region. However, the required energy can cause surface burns on the skin, and the treatment is limited to tumors within a specified size and location. Ultrasound microbubble contrast agents can be used to improve therapeutic ultrasound treatments. Phospholipid shelled microbubbles have the advantage of an increased life span, as well as the flexibility to withstand expansion and contraction, while a perfluorocarbon core increases the desired bioeffects by providing additional cavitation nuclei. Single-frequency ultrasound excitation of microbubbles has been explored as a method of enhancing ablation treatments. This study explored the effects of dual-frequency ultrasound on the cavitation of microbubble contrast agents for use in ablation therapies. I propose that a single element transducer is capable of emitting a dual-frequency waveform that, in combination with microbubble contrast agents, allows increased cavitation at a lower pressure, potentially
expanding the applications of ultrasound tumor ablation while making high intensity focused ultrasound therapies safer and more efficient.
transmitted onto a capillary flow phantom containing phospholipid microbubbles with a perfluorocarbon core flowing at a rate of 0.1 mL.min-1. The acoustic signal received from the microbubbles was analyzed for the frequency response. The de Jong model for bubble oscillation was then used to characterize the bubble response when exposed to the dual-frequency waveforms.
Results: The results show that the cavitation signal caused by a single element transducer can be improved by including an additional frequency component. The 20% 1.5 MHz/80% 3.0 MHz waveform, 25% 1.5 MHz/75% 3.0 MHz waveform, 75% 1.5 MHz/25% 3.0 MHz waveform, and 80% 1.5 MHz/20% 3.0 MHz dual-frequency waveforms showed increased cavitation compared to the 100% 3.0 MHz single frequency waveform. The 80% 1.5 MHz/20% 3.0 MHz dual-frequency waveform showed increased cavitation compared to the 100% 1.5 MHz single-frequency waveform. In addition, the 80% 1.5 MHz/20% 3.0 MHz dual-single-frequency waveform caused equivalent cavitation as the 100% 1.5 MHz single-frequency waveform, but at 45% lower pressure.
Conclusions: A dual-frequency waveform transmitted from a single element transducer can generate cavitation energies greater than a single frequency waveform. Manipulation of the ratio of dual frequencies can be used to further enhance desired bioeffects. This demonstration of cavitation enhancement using dual-frequency waveforms emitted from a single element
ACKNOWLEDGMENTS
I would like to acknowledge Anthony Novell, Linsey Moyer, Heath Martin, and Paul Sheeran for technical support. I would also like to acknowledge funding in part by an
TABLE OF CONTENTS
LIST OF TABLES
LIST OF FIGURES
Figure 1- Flow phantom and support………..5
Figure 2- Transducer alignment and electronic set-up………6
Figure 3- Transducer and Flow Phantom Orientation……….6
Figure 4- Single- and dual-frequency generated waveforms………7-8 Figure 5- Frequency response for each waveform……….11
Figure 6- Cavitation spectra for each waveform………12
Figure 7- Microbubble simulation, frequency spectrum………13
CHAPTER 1: INTRODUCTION
Due to its low cost, portability, and safety, ultrasound has emerged as an important diagnostic and therapeutic clinical tool. Ultrasound waves are transmitted as a sound wave that, upon hitting a boundary region in the body, reflects a signal back to the receiver [1]. Using the speed of sound in soft tissue and the time elapsed before the signal is received, the distance of the object from the ultrasound transducer can be determined, and an image can be produced [2].
Diagnostically, ultrasound is used to image a developing fetus, blood vessel blockages, and cancerous masses, among other abnormalities in soft tissue. Ultrasound has been further expanded to detect differences in healthy and diseased tissue by utilizing acoustic radiation force impulse imaging. By “pushing” on the tissue, ultrasound can detect differences in elasticity of regions of the same type of tissue [3]. Clinicians can use this application of ultrasound to monitor degenerative tissue disease progression and plaque buildup in vessels, in addition to other applications.
Ultrasound can be used as a therapeutic tool to induce physiological changes within the body. By modifying the frequency components and the energy of the waveform, ultrasound can cause localized temperature increases, microjet stream formation, and cavitation in a targeted region [4-7]. Combinations of the mentioned bioeffects can be used to enhance current therapies for cancer treatment and drug delivery [8, 9].
enhances their permeability in a process known as sonoporation. With an increased
permeability, drug delivery is enhanced [11-13]. Delivery of a thromogenic drug to the site of vascular endothelial cell damage can cause a thrombus to form, blocking the vessel and preventing the flow of nutrients to a tumor [14, 15].
At higher frequencies, typically above 1.0 MHz, ultrasound causes a localized increase in temperature and excites pockets of gas in the tissue. When the ultrasound wave is transmitted, mechanical energy is directed at a tissue region. As the tissue absorbs the energy, the
temperature of the region increases [16]. The increase in temperature in the target region causes non-repairable damage to the cell’s nucleoprotein structure, effectively killing the cell and causing localized ablation [17]. Applying this treatment to a tumor region can cause targeted destruction of tumor cells while minimizing damage to healthy tissue. To improve accuracy, treatments are guided by magnetic resonance imaging or additional ultrasound imaging [18]. Due to the success of ultrasound ablation in clinical trials, the Federal Drug Administration has approved the therapy for treatment of uterine fibroids [19], and researchers are working to apply the treatment to other tumors.
Microbubbles have been shown to increase cavitation-related bioeffects previously discussed by providing additional cavitation nuclei [22, 23]. Colloidal microbubbles have many beneficial properties that lend well to their use with cavitation applications [24-29]. Many shell compositions can be used, but phospholipid shells are the most advantageous due to their low surface tension and ability to expand and contract without chain entanglement [30, 31]. The shell also increases the stability of the microbubble, ensuring it reaches the site of cavitation.
Microbubble-enhanced therapeutic ultrasound has primarily been explored using single-frequency waveforms. Due to the clinical application limitations, many researchers have proposed different mechanisms to enhance cavitation and ablation without decreasing the safety of therapeutic ultrasound treatments. Dual-frequency ultrasound excitation has been proposed as a method to increase the amount of energy delivered to the targeted region without increasing the required pressure. Previously, dual-frequency ultrasound excitation was performed using
CHAPTER 2: MATERIALS AND METHODS
2.1 Microbubble preparation
Polydisperse decafluorobutane microbubbles were formulated as previously described [33]. Dissolution of glycero-3-phosphocholine (DSPC) and 1,2-distearoyl-sn-glycero-3-phosphoethanolamine-N-methoxy(polyethylene-glycol)-2000 (DSPE-PEG2000) in a 9:1 molar ratio and a total lipid concentration of 1.0 milligrams/milliliter, as previously described (Mullin et al 2011). Lipids were purchased from Avanti Polar Lipids (Alabaster, AL, USA). The excipient solution was comprised of phosphate-buffered saline (PBS), propylene glycol, and glycerol (16:3:1). 1.5 milliliters of the resulting solution was pipetted into a 3 milliliter glass vial and gas exchanged with decafluorobutane (FluoroMed, Round Rock, TX, USA) to replace the free and dissolved air. A Vialmix shaker (Bristol-Myers-Squibb, New York, NY) was used to generate microbubbles via mechanical agitation.
2.2 Experimental system
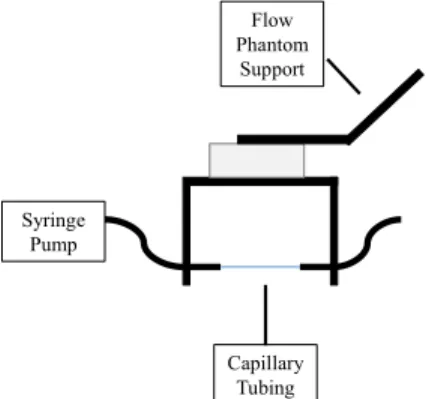
Syringe Pump
Capillary Tubing
Flow Phantom
Support
Figure 1: Flow Phantom and Support. Syringe pump dispenses microbubble solution into tubing, which is stabilized by the phantom support.
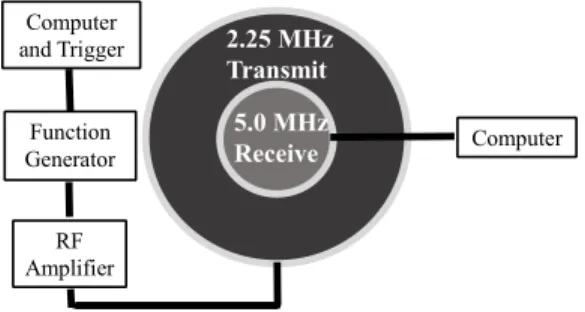
Two transducers aligned coaxially and confocally were used to simultaneously generate the dual frequency waveform and receive the acoustic response from the microbubbles. The outer transducer, a 2.25 MHz donut immersion transducer (Panametrics NDT V30039) with a diameter of 38.1 millimeters and a focal length of 50.8 millimeters, was used to transmit the signal. The inner transducer, a 5.0 MHz immersion transducer (NDT Panametrics V309) with a diameter of 12.7 millimeters and the same focal length of the outer transducer, was used to receive the signal. The transmit transducer had a bandwidth from 0.99 MHz to 2.97 MHz. The transmit transducer was selected for its ability to transmit both 1.5 MHz and 3.0 MHz frequencies. The receive transducer had a frequency bandwidth from 3.17 MHz to 7.3 MHz. The receive transducer was selected for its ability to detect a wide range of acoustic signals from the microbubbles. The waveforms were generated by an arbitrary waveform generator (Sony Tektronix AWG 2021). The outer transducer was driven by a RF-power amplifier (Electronic Navigation Industries 3200L) (Figure 2). Both transducers were attached to a manual 3-D positioning device and submerged in the water tank with the flow phantom. The transducers were oriented
2.25 MHz Transmit
5.0 MHz
Receive Computer
Computer and Trigger
Function Generator
RF Amplifier
Figure 2: Transducer Alignment and Electronic Set-up. The outer 2.25 MHz transducer transmitted the waveforms. The inner 5.0 MHz transducer received acoustic signal from the microbubbles.
Syringe Pump
Capillary tube with flowing microbubbles
(1:100,000 dilution)
Figure 3: Transducer and Flow Phantom Orientation. Overhead view. The 2.25MHz transducer is oriented perpendicular to the flow phantom support, and the capillary tubing is angled at 45 degrees from the transducer focus.
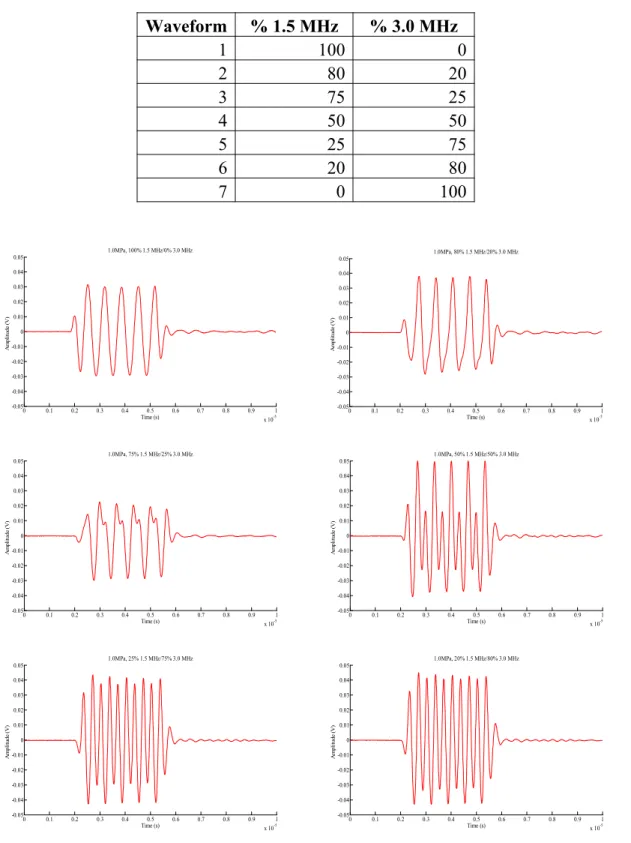
2.3 Waveform Generation
Table 1: Ratios of 1.5 MHz and 3.0 MHz for each waveform.
Waveform % 1.5 MHz % 3.0 MHz
1 100 0
2 80 20
3 75 25
4 50 50
5 25 75
6 20 80
7 0 100
0 0.1 0.2 0.3 0.4 0.5 0.6 0.7 0.8 0.9 1
x 10-5
-0.05 -0.04 -0.03 -0.02 -0.01 0 0.01 0.02 0.03 0.04 0.05 Time (s) A m pl it ud e (V )
1.0MPa, 100% 1.5 MHz/0% 3.0 MHz
0 0.1 0.2 0.3 0.4 0.5 0.6 0.7 0.8 0.9 1
x 10-5
-0.05 -0.04 -0.03 -0.02 -0.01 0 0.01 0.02 0.03 0.04 0.05 Time (s) A m pl it ud e (V )
1.0MPa, 80% 1.5 MHz/20% 3.0 MHz
0 0.1 0.2 0.3 0.4 0.5 0.6 0.7 0.8 0.9 1
x 10-5
-0.05 -0.04 -0.03 -0.02 -0.01 0 0.01 0.02 0.03 0.04 0.05 Time (s) A m pl it ud e (V )
1.0MPa, 75% 1.5 MHz/25% 3.0 MHz
0 0.1 0.2 0.3 0.4 0.5 0.6 0.7 0.8 0.9 1
x 10-5
-0.05 -0.04 -0.03 -0.02 -0.01 0 0.01 0.02 0.03 0.04 0.05 Time (s) A m pl it ud e (V )
1.0MPa, 50% 1.5 MHz/50% 3.0 MHz
0 0.1 0.2 0.3 0.4 0.5 0.6 0.7 0.8 0.9 1
x 10-5
-0.05 -0.04 -0.03 -0.02 -0.01 0 0.01 0.02 0.03 0.04 0.05 Time (s) A m pl it ud e (V )
1.0MPa, 25% 1.5 MHz/75% 3.0 MHz
0 0.1 0.2 0.3 0.4 0.5 0.6 0.7 0.8 0.9 1
x 10-5
-0.05 -0.04 -0.03 -0.02 -0.01 0 0.01 0.02 0.03 0.04 0.05 Time (s) A m pl it ud e (V )
0 0.1 0.2 0.3 0.4 0.5 0.6 0.7 0.8 0.9 1
x 10-5
-0.05 -0.04 -0.03 -0.02 -0.01 0 0.01 0.02 0.03 0.04 0.05 Time (s) A m pl it ud e (V )
1.0MPa, 0% 1.5 MHz/100% 3.0 MHz
Figure 4: Single- and Dual-Frequency Generated Waveforms. From top left to right: 100% 1.5 MHz/0% 3.0 MHz, 80% 1.5 MHz/20% 3.0 MHz, 75% 1.5 MHz/25% 3.0 MHz, 50% 1.5 MHz/50% 3.0 MHz, 25% 1.5 MHz/75% 3.0 MHz, 20% 1.5 MHz/80%
3.0 MHz, and 0% 1.5 MHz/100% 3.0 MHz.
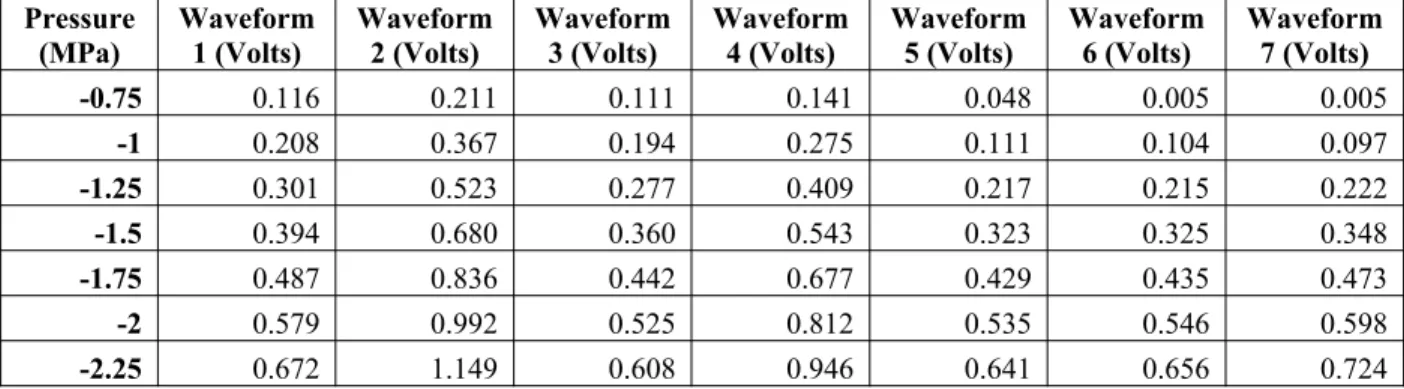
2.4 Hydrophone pressure calibrations
Prior to collecting experimental data, a hydrophone was used to calibrate the pressure for each waveform. The hydrophone was connected to an automatic 3-D motion stage. A Labview program was used to control the movements of the motion stage. A raster scan was performed, with twelve measurements taken in a 3.0 millimeter by 3.0 millimeter grid at voltage amplitudes ranging from 0.1 volts to 0.8 volts for each of the seven dual frequency waveforms. These measurements were used to identify the focus of the transducer. Using the results, voltage amplitudes were found for pressures ranging from -0.75 MPa to -2.25 MPa, in 0.25 MPa increments, for each of the seven waveforms. Results are summarized in Table 2.
Table 2: Equivalent voltage amplitudes for each pressure for all waveforms.
Pressure (MPa) Waveform 1 (Volts) Waveform 2 (Volts) Waveform 3 (Volts) Waveform 4 (Volts) Waveform 5 (Volts) Waveform 6 (Volts) Waveform 7 (Volts)
-0.75 0.116 0.211 0.111 0.141 0.048 0.005 0.005
-1 0.208 0.367 0.194 0.275 0.111 0.104 0.097
-1.25 0.301 0.523 0.277 0.409 0.217 0.215 0.222
-1.5 0.394 0.680 0.360 0.543 0.323 0.325 0.348
-1.75 0.487 0.836 0.442 0.677 0.429 0.435 0.473
-2 0.579 0.992 0.525 0.812 0.535 0.546 0.598
-2.25 0.672 1.149 0.608 0.946 0.641 0.656 0.724
2.5 Experimental procedure
Prior to all experiments, a square acrylic water tank was filled with room temperature deionized water and degassed for twenty minutes. The coaxial confocal transducers were submerged in the degassed water perpendicular and 50.8 millimeters from the flow phantom support. The flow phantom was oriented at 45 degrees from the transducers. Air was flown through the flow phantom, then the manual positioning devices were adjusted for both the transducers and the flow phantom until the optimal signal was received. When the transducers were correctly positioned, the microbubbles were diluted 1:100,000 in PBS. A syringe pump was used to flow the microbubble solution through the phantom at a rate of 0.1 milliliters per minute.
Data acquisition was performed using a custom Labview program and GPIB interface to the 5.0 MHz inner transducer. For each waveform, the corresponding amplitude for each pressure was entered into the arbitrary waveform generator and the acoustic responses from microbubbles were recorded. One hundred acoustic responses were collected for each waveform at each pressure.
2.6 Experimental data analysis
signal was used to determine the frequency response of the acoustic microbubble response. The intensity of the frequency response at each pressure was then plotted for each waveform.
2.7 Bubble response simulation
CHAPTER 3: RESULTS
3.1 Experimental results
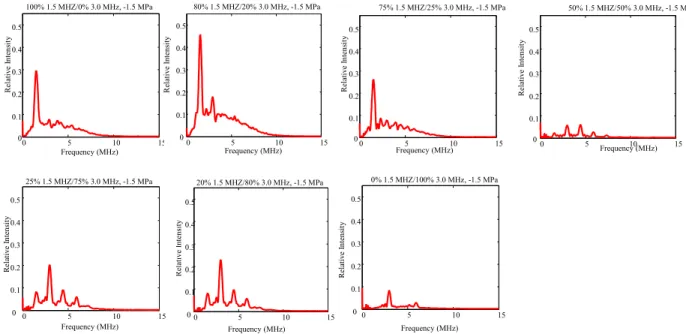
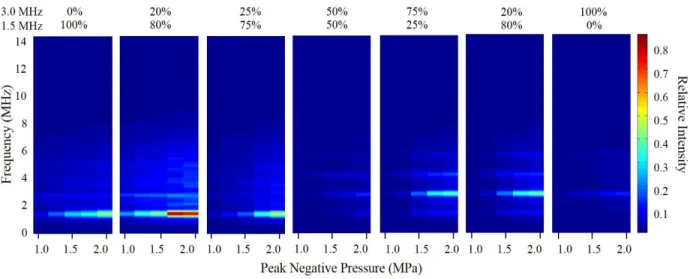
The generated waveforms in Figure 4 were transmitted onto the capillary flow tube at the voltage amplitudes for each pressure as listed in Table 2. Using Matlab programming, the microbubble signals above the background threshold were used to determine the frequency response. The frequency was then plotted against relative intensity. The average frequency response for -1.5MPa for each waveform is seen in Figure 5. The frequency response of the acoustic signal was analyzed and plotted against the change in pressure for each waveform. The cavitation spectra of all waveforms is seen in Figure 6.
0 5 10 15
0 0.1 0.2 0.3 0.4 0.5 Frequency (MHz) R el at iv e In te ns it y
100% 1.5 MHZ/0% 3.0 MHz, -1.5 MPa
0 5 10 15
0 0.1 0.2 0.3 0.4 0.5 Frequency (MHz) R el at iv e In te ns it y
80% 1.5 MHZ/20% 3.0 MHz, -1.5 MPa
0 5 10 15
0 0.1 0.2 0.3 0.4 0.5 Frequency (MHz) R el at iv e In te ns it y
75% 1.5 MHZ/25% 3.0 MHz, -1.5 MPa
0 5 10 15
0 0.1 0.2 0.3 0.4 0.5 Frequency (MHz) R el at iv e In te ns it y
50% 1.5 MHZ/50% 3.0 MHz, -1.5 MPa
0 5 10 15
0 0.1 0.2 0.3 0.4 0.5 Frequency (MHz) R el at iv e In te ns it y
20% 1.5 MHZ/80% 3.0 MHz, -1.5 MPa
0 5 10 15
0 0.1 0.2 0.3 0.4 0.5 Frequency (MHz) R el at iv e In te ns it y
0% 1.5 MHZ/100% 3.0 MHz, -1.5 MPa
0 5 10 15
0 0.1 0.2 0.3 0.4 0.5 Frequency (MHz) R el at iv e In te ns it y
25% 1.5 MHZ/75% 3.0 MHz, -1.5 MPa
Figure 6: Cavitation Spectra for all seven waveforms.
The results show that the cavitation signal caused by a single element transducer can be improved by including an additional frequency component. The 20% 1.5 MHz/80% 3.0 MHz waveform, 25% 1.5 MHz/75% 3.0 MHz waveform, 75% 1.5 MHz/25% 3.0 MHz waveform, and 80% 1.5 MHz/20% 3.0 MHz dual-frequency waveforms showed increased cavitation compared to the 100% 3.0 MHz single frequency waveform. The 80% 1.5 MHz/20% 3.0 MHz dual-frequency waveform showed increased cavitation compared to the 100% 1.5 MHz single-frequency waveform. In addition, the 80% 1.5 MHz/20% 3.0 MHz dual-single-frequency waveform caused equivalent cavitation as the 100% 1.5 MHz single-frequency waveform, but at 45% lower pressure.
3.2 Simulation results
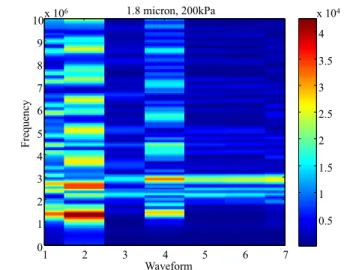
dual-frequency waveform also has the greatest oscillation radius. These results confirmed the experimental results and the hypothesis that a dual-frequency waveform will cause greater cavitation.
1.8 micron, 200kPa
Waveform Fr eq ue nc y
1 2 3 4 5 6 7
0 1 2 3 4 5 6 7 8 9
10x 106
0.5 1 1.5 2 2.5 3 3.5 4
x 104
Figure 7: Frequency response for all waveforms for 1.8 micrometer bubble at 200 kPa.
2 3 4 5 6 7 8 9
x 10-6 -2 -1 0 1 2 3 4x 10
-6 Time (s) B ub bl e ra di us ( m )
1.8 micron Bubble Oscillation, 200kPa
100% 1.5 MHz 80% 1.5 MHz/20% 3.0 MHz 100% 3.0 MHz
CHAPTER 4: DISCUSSION
4.1 Impact
Based off of the results, a dual-frequency waveform has an advantage to single frequency waveforms when performing cavitation experiments using a single element transducer. Many different methods exist to induce cavitation using dual-frequency signals, which have been shown to enhance the effects of therapeutic ultrasound. Previously explored methods require two transducers, and thus require more precise positioning to achieve the desired effects. Using one transducer also reduces the cost of the treatment for the patient.
The results also indicate that the same level of single-frequency cavitation can be obtained using a dual-frequency waveform, but at a lower pressure. A lower pressure will emit less dispersed energy, potentially reducing the severity of surface burns on the patient.
The results of the simulation confirm the results of the experimental analysis. At a microbubble radius of 1.8 micrometers, the intensity of the frequency response is greatest for the 80% 1.5 MHz/20% 3.0 MHz dual-frequency waveform. In the simulations, larger microbubbles showed similar responses to our experimental data. Larger microbubbles have a resonance frequency closer to the frequency used in our experiments, so these microbubbles emitted more energy. Thus, larger bubbles will be best suited for cavitation induced by dual-frequency waveforms. Smaller bubbles, having a higher resonance frequency, are better suited for higher frequency applications.
Thus, the predictions of the de Jong model are limited in their application to dual-frequency cavitation simulations. The de Jong model also provided a simulation for only one size of microbubble at a time. The microbubble solution used in this experiment contained a
polydisperse population of microbubbles. A more accurate simulation would consider a range of microbubble sizes simultaneously.
4.2 Future steps
In future experiments, the effects of phase on the combinations of the dual-frequencies will be explored. After optimizing the phase, the waveforms will be tested in chicken breast to determine the effect of the waveforms on tissue. The results will be coupled with heating data to determine whether dual-frequency ultrasound minimizes surface burns and more effectively focuses heat. In addition, other mechanisms of generating a dual frequency waveform will be tested and compared to the proposed method.
CHAPTER 5: CONCLUSION
REFERENCES
1. Szabo, TL. 2014., Diagnostic Ultrasound Imaging Inside and Out. Elselvier, Oxford. 2. Holmes JH, Howry DH, Posakony GJ, Cushman CR. Ultrasonic visualization of soft tissue
structures in the body. Trans Am Climatol Assoc. 1954; 66: 208-225.
3. Nightingale KR, Palmeri ML, Nightingale RW, Trahey GE. On the feasibility of remote palpation using acoustic radiation force. J Acoust Soc Am. 2001; 110: 625-634.
4. Yu T, Wang Z, Mason TJ. A review of research into the uses of low level ultrasound in cancer therapy. Ultrasonics. 2004; 11: 95-103.
5. Sulick KS, Mcnamara WB, Didenko Y. Hot spot conditions during multi-bubble cavitation, in Crum LA, Mason TJ, Reisz JK, Suslick KS. Sonochemistry and sonoluminscence. 1999; 192-204.
6. Ciuti P, Dezhkunov NV, Francescutto A, Kulak AI, Iernetti G. Cavitation activity stimulation by low frequency field pulses. Ultrason. Sonochem. 2000; 7: 213-216.
7. Tang H, Wang CC, Blankschtein D, Langer R. An investigation of the role of cavitation in low frequency ultrasound mediated transdermal drug transport. Pharm. Res. 2002; 19: 1160-1169.
8. Corry PM, Spanos WJ, Tilchen EJ, Barlogie B, Barkely HT, Armour EP. Combined ultrasound and radiation therapy of human superficial tumors. Radiology. 1982; 145: 165-169.
9. Fry FJ, Johnson LK. Tumor irradiation with intense ultrasound. Ultrasound Med Biol. 1978; 4: 337-341.
Ultrasound and microbubble-targeted delivery of macromolecules is regulated by induction of endocytosis and pore formation. Circ Res, 2009; 104: 679-687.
11. Miller MW, Miller DL, Brayman AA. A review of in vitro bioeffects of inertial ultrasonic cavitation from a mechanistic perspective. Ultrasound Med Biol. 1996; 22: 1131-1154. 12. Qui Y, Luo Y, Zhang Y, Cui W, Zhang D, Wu J, Zhang J, Tu J. The correlation between
acoustic cavitation and sonoporation involved in ultrasound-mediated DNA transfection with polyethylenimine (PEI) in vitro. J. Control. Release. 2010; 145: 40-48.
13. Dyson M. Non-thermal cellular effects of ultrasound. Brit. J. Cancer. 1982; 45: 165-171. 14. Poliachik SL, Chandler WL, Mourad PD, Ollos RJ, Crum LA. Activation, aggregation, and
adhesion of platelets exposed to high intensity focused ultrasound. Ultrasound Med Biol.
2001; 27: 1567-1576.
15. Hwang JH, Brayman AA, Reidy MA, Matula TJ, Kimmey MB, Crum LA. Vascular effects induced by combined 1-MHz ultrasound and microbubble contrast agent treatments in vivo.
Ultrasound Med Biol. 2005; 31 (4): 553-564.
16. Corry PM, Jabboury K, Armour EP, Kong JS. Human cancer treatment with ultrasound.
IEEE Trans Son Ultrason. 1984; 31(5): 444-456.
17. Corry PM, Robinson S, Getz S. Hyperthermia effects of DNA repair mechanisms.
Radiology. 1977; 123: 475-482.
18. Morita Y, Ito N, Hikida H, Takeuchi S, Nakamura K, Ohashi H. Non-invasive magnetic resonance imaging-guided focused ultrasound treatment for uterine fibroids: early experience. Eur J Obstet Gynecol Reprod Biol. 2008; 139:199 –203.
20. Sirsi SR, Borden MA. Microbubble compositions, properties, and biomedical applications.
Bubble Science, Eng and Tech. 2009; 1: 3-17.
21. Seya PM, Fouqueray M, Ngo J, Poizat A, Inserra C, Béra JC. Sonoporation of adherent cells under regulated ultrasound cavitation conditions. Ultrasound Med Biol. 2015; 41(4): 1009-1019.
22. Kajiyama K, Yoshinaka K, Takagi S, Matsumoto Y. Micro-bubble enhanced HIFU. Physics Procedia. 2010; 3: 305-314.
23. Tu J, Hwang JH, Matula TJ, Brayman AA, Crum LA. Intravascular inertial cavitation activity detection and quantification in vivo with Optison. Ultrasound Med Biol. 2006; 32: 1601-1609.
24. Unger EX, Porter T, Culp W, Labell R, Matsunaga T, Zutshi R. Therapeutic applications of lipid-coated microbubbles. Adv. Drug Delivery Rev. 2004; 56: 1291-1314.
25. Ferrara K, Pollard R, Borden M. Ultrasound microbubble contrast agents: fundamentals and application to gene and drug delivery. Ann. Rev. Biomed. Eng. 2007; 9: 415-447.
26. Lindner JR. Microbubbles in medical imaging: current applications and future directions.
Nat. Rev. Drug Discovery. 2004; 3: 527-532.
27. Feinstein, SB. The powerful microbubble: From bench to bedside, from intravascular tracer to therapeutic delivery system, and beyond. Am. J. Phys. 2004; 287: H450-H457.
28. Dayton PA, Rychak JJ. Molecular ultrasound imaging using microbubble contrast agents.
Front. Biosci. 2007; 12: 5124-5142.
30. Duncan PB, Needham D. Test of the Epstein−Plesset model for gas microparticle dissolution in aqueous media: effect of surface tension and gas undersaturation in solution. Langmuir. 2004; 20: 2567-2578.
31. Dayton PA, Morgan KE, Klibanov AL, Brandenburger GH, Ferrara KW. Optical and acoustical observations of the effects of ultrasound on contrast agents. IEEE Trans. Ultrason. Ferroelectr. Freq. Control. 1999; 46: 220-232.
32. Ma J, Guo S, Wu D, Geng X, Jiang X. Design, Fabrication and Characterization of a Single Aperture 1.5 MHz / 3 MHz Dual Frequency HIFU Transducer. IEEE Trans Ultrason Ferroelectr Freq Control. 2013; 60(7): 1519-1529.