ABSTRACT
Glioblastoma (GBM), the most common and malignant primary brain tumor, is currently
incurable and the most recent advance in treatment yields a median survival of only 12-‐15
months.
1-‐3To account for GBM’s heterogeneity, molecular diagnostics may be used to enable
mutation specific treatment and improve patient outcomes.
4Mutations in PIK3CA, the
p110α subunit of phosphatidylinositide 3-‐kinase (PI3K), are important in pathogenesis of other
cancers, and drugs targeting PI3K are in clinical development.
5-‐8In 12% of GBM, PIK3CA is
mutated and recurrent mutations are distributed across three functional domains (adaptor-‐
binding, helical, and kinase).
6As their role in GBM tumorigenesis is unknown, we examined six
mutations known to occur in GBM, two per mutated domain, for activation of biochemical
signaling through phosphorylation of downstream targets ATK and S6. These mutations were
introduced into immortalized human astrocytes, with and without oncogenic RAS.
9We
determined that the downstream signaling molecule AKT is activated by all of the mutations in
human astrocytes, with the greatest increase caused by mutations in the helical and kinase
domains. The presence of oncogenic RAS cooperated with the helical and kinase domain
mutations to activate signaling. Mutations in the adaptor-‐binding domain appear to increase
signaling independently of oncogenic RAS. Mutations in PIK3CA therefore differentially increase
signaling, leading to differing phenotypes and possible differential response to PI3K inhibitors.
By understanding the consequences of differing mutations, GBM diagnosis and treatment can
be improved.
INTRODUCTION
Class I phosphatidylinositide 3-‐kinases (PI3K) are activated by receptor tyrosine kinases
(RTK) and have an established role in cancer biology, making them an important target for
research and drug development.
10In general, phosphatidylinositide 3-‐kinase proteins form a
diverse family of related enzymes, whose members are divided into three classes based on
their structural features and lipid substrates.
8, 11Class II and III members do not have a well-‐
established role in cancer, however signaling by Class I members has been shown to promote
cellular survival, proliferation, and migration, along with other hallmarks of cancer.
5, 8, 11, 12These proteins are heterodimeric, with our focus being on the catalytic subunit encoded by
PIK3CA and the regulatory subunit encoded by PIK3R1 due to their frequent mutation in
cancer.
6The catalytic subunit produces a phosphatidylinositol-‐3,4,5-‐triphosphate (PIP
3)
secondary messenger from membrane bound phosphatidylinositol-‐4,5-‐bisphosphate (PIP
2) and
the regulatory subunit inhibits this activity. There are many upstream signals interacting
specifically with each subunit, and the ability of these signals to activate signaling depends on
the catalytic isoform present in the heterodimer.
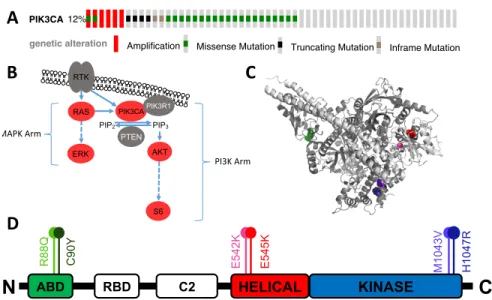
8, 11, 13In GBM, three PI3K pathway genes are frequently mutated: PIK3CA (12%) (Fig. 1A),
PIK3R1 (12%), and PTEN (41%).
5, 14, 15These mutations are mutually exclusive, suggesting that
they all activate PI3K signaling and that a mutation in one is sufficient to promote
tumorigenesis. Mutations in PIK3R1 and PTEN have been shown to be transformative in brain
tissue, and although PIK3CA mutations are presumed to drive gliomagenesis based on
the oncogene RAS from the mitogen-‐activated protein kinase (MAPK) arm of the RTK pathway
(Fig. 1B). PIK3CA mutations in GBM are spread across the protein, with recurring mutations in
the helical, kinase, and adaptor binding (ABD) domains (Fig. 1C, 1D).
7The helical (E542K and
E545K) and kinase (H1047R) domain mutations have been shown to initiate tumorigenesis and
promote progression in non-‐brain tissues, such as breast.
16-‐18Structural analysis has been used
to predict the mechanisms of mutations in these three domains.
13, 19-‐23Helical domain
mutations are predicted to disrupt inhibitory interactions between PIK3R1 and PIK3CA, leading
to signaling activation. Kinase domain mutations are predicted to alter the conformation of the
PIK3CA protein’s activation loop, resulting in increased binding to the cellular membrane and
therefore increased catalytic efficiency. ABD mutations are predicted to alter the conformation
of the kinase domain, leading to an increase in the protein’s enzymatic activity. Helical domain
mutations have been found to require RAS for signaling activation but not PIK3R1 in non-‐brain
models, whereas the opposite is true for kinase domain mutations.
24The role of RAS and
PIK3R1 is unclear for ABD mutations.
To determine if PIK3CA mutations differentially activate PI3K signaling based on the
mutated domain, we selected six specific mutations known to occur in GBM (R88Q, C90Y,
E542K, E545K, M1043V, and H1047R) (Fig. 1D) and introduced them into immortalized
astrocytes with and without oncogenic RAS. The use of cultured genetically engineered cells has
important advantages over other preclinical models, as they allow direct genotype to
phenotype conclusions.
9, 25These cells are also more experimentally manageable, and can be
expressing the HPV oncogenes E6 and E7 to inhibit the TP53 and RB pathways and expression of
hTERT for telomere maintenance.
9These genetic modifications are required for culture of
astrocytes, but do not transform the cells or make them tumorigenic.
9The mutations were also
introduced into astrocytes that express oncogenic HRAS (NHARAS), as a way to examine effects
between the PI3K and MAPK effector arms of the RTK pathway.
9Both of these effector arms
are frequently mutated and activated in GBM.
6We propose that signaling activation is
dependent not only on the specific gene that is mutated but also on the precise location within
the mutated protein. Even though mutations in all three functional domains of PIK3CA are
assumed to activate signaling, drive tumor growth, and predict PI3K inhibitor activity, none of
these assumptions has yet been successfully experimentally tested. The validity of these
mechanisms must be proven to provide a rational basis for developing individualized therapy.
MATERIALS AND METHODS
Tissue Culture
Immortalized normal human astrocytes (NHA) with and without oncogenic H-‐RAS were a gift
from Dr. Russell O. Pieper.
9All cell lines were maintained in Dulbecco’s Modified Eagle’s
Medium supplemented with 10% FBS and 1% Penn/Strep (complete DMEM) at 37ºC and 5%
CO
2.
PIK3CA Mutagenesis
HA-‐tagged wildtype PIK3CA (PIK3CA
wt, pBABE-‐puro-‐HAPIK3CA), HA-‐tagged GFP (GFP, pDEST-‐
Flag-‐HA-‐GFP), pENTR4 vector (pENTR4-‐no-‐ccDB), and third generation lentiviral Gateway
destination vector (pLenti-‐PGK-‐Hygro-‐DEST) plasmids were purchased from Addgene
via ligation into the pENTR4 vector. Point mutagenesis of PIK3CA was performed in the pENTR4
vector using the Q5 Site-‐Directed Mutagenesis Kit (New England Biolabs, Ipswich, MA)
according to manufacturer’s instructions generating the six PIK3CA mutants (PIK3CA
mut: R88Q,
C90Y, E542K, E545K, M1043V, H1047R). The sequence of each mutated gene was confirmed
with Sanger sequencing (Genewiz, South Plainfield, NJ). Each gene (GFP, PIK3CA
wt, and six
PIK3CA
mut) was transferred from the pENTR4 vector to the pLenti-‐PGK-‐Hygro-‐DEST vector by
recombination as previously described.
26Lentivirus Production
Lentiviral particles containing GFP, PIK3CA
wt, or individual PIK3CA
mutwere generated using
293FT cells (Invitrogen, Grand Island, NY). Briefly, 5 x 10
5cells were plated on 10 cm plates in
complete DMEM supplemented with 2 mM GlutaMAX (Invitrogen), 0.1 mM MEM Non-‐Essential
Amino Acids (Invitrogen), and 1 mM sodium pyruvate (Invitrogen) (293FT medium). The next
day medium was replaced with fresh 293FT medium without Penn/Strep, and with 9 μg GFP,
PIK3CA
wt, or PIK3CA
mutpDEST vector plasmids, 9 μg pLP1, 3.6 μg pLP, and 1.89 μg pMD2.G
transfected into these cells using Lipofectamine 2000 (Invitrogen) according to the
manufacturer’s instructions. After 24 hours, medium was exchanged for new 293FT medium
supplemented with 1 M HEPES (Invitrogen). At 48 and 72 hours post-‐transfection, viral
supernatants were collected and fresh 293FT medium supplemented with 1M HEPES was
added. Viral supernatants from each time point were filtered through a 45 μm PES filter, and
stored at 4ºC until all time points could be pooled, aliquoted, and stored at -‐80ºC.
Creation of Stable Cell Lines
NHA and NHARAS cells were plated at 135,000 and 120,000 cells per plate on 6 cm plates and
infected with lentiviral particles after two days. Viral particles and cells were incubated
overnight in complete DMEM containing 8 μg/ml polybrene (Sigma-‐Aldrich, St. Louis, MO) at
37ºC and 5% CO
2. Two days post-‐infection, transduced cells were selected by culture in
complete DMEM with 300 μg/ml hygromycin B for 14 days. Stable gene expression was
confirmed by immunoblot for the HA tag on GFP, PIK3CA
wtand PIK3CA
mut.
Immunoblot
NHA and NHARAS cells were serum starved in 0.5% FBS for 24 hours, harvested, lysed, and
quantified by BCA (Pierce BCA Protein Assay Kit, Thermo Scientific, Waltham, MA). Protein
samples (20 μg) were separated by gradient (8-‐16%) SDS-‐PAGE (Bio-‐Rad, Hercules, CA) and
transferred to PDVF membranes (EMD Millipore Corp, Billerica, MA). The membranes were
probed with primary antibodies against GAPDH (EMD Millipore Corp, Billerica, MA, MAB374) at
1:7000, AKT (Cell Signaling Technology, Danvers, MA, CST2920S) at 1:3000, phospho AKT
(Ser473) (Cell Signaling Technology, Danvers, MA, CST4060) at 1:3000, phospho S6
(Ser240/244) (Cell Signaling Technology, Danvers, MA, CST2215) at 1:3000, ERK (Cell Signaling
Technology, Danvers, MA, CST4696) at 1:3000, and phospho ERK (Thr202/Tyr204) (Cell
Western ECL Substrate, Bio-‐Rad) on an Image Quant LAS 4000 (GE Healthcare). Immunoblot
images were analyzed using ImageJ (NIH, Bethesda, MD), normalized to GAPDH, normalized to
an external standard, and expression levels were set relative to parental, uninfected cells.
Immunoblots were performed with 1 (NHA) and 3 – 4 (NHARAS) experimental replicates.
Differences between cell lines were determined by one-‐way ANOVA tests using Tukey’s post-‐
tests for multiple comparisons in GraphPad Prism 5 (La Jolla, CA). For statistical analysis P values
< 0.05 were considered to be significant.
RESULTS
Figure 1: PIK3CA mutations in GBM. (A) Occurrence of PIK3CA mutations in a sampling of 273 GBM patients, courtesy of cBioPortal.14 (B) Abbreviated figure of the MAPK and PI3K arms of the RTK pathway, proteins examined in this paper are red, and dashed lines indicate multiple steps. (C) PyMOL (Schrödinger, New York City, NY) generated protein model with mutation locations marked. (D) Simplified protein diagram showing mutation locations within protein domains, R88Q and M1043V are rare mutations, C90Y is unique to GBM, and E542K, E545K and H1047R are “hot-‐spot” mutations seen in other cancers.
RAS PIP2 PTEN PIP3 AKT PIK3CA RTK ERK S6 PIK3R1 PI3K%Arm% MAPK%Arm%
A"
B"
C"
D"
N
H1047R M1 04 3V E5 42 K E5 45 KR88Q C90Y
C
ABD RBD C2 HELICAL KINASE
PIK3CA 12%
genetic alteration Amplification Missense Mutation Truncating Mutation Inframe Mutation
PIK3CA 12%
genetic alteration Amplification Missense Mutation Truncating Mutation Inframe Mutation
PIK3CA 12%
genetic alteration Amplification Missense Mutation Truncating Mutation Inframe Mutation
PIK3CA 12%
genetic alteration Amplification Missense Mutation Truncating Mutation Inframe Mutation
PIK3CA 12%
genetic alteration Amplification Missense Mutation Truncating Mutation Inframe Mutation
PIK3CA 12%
genetic alteration Amplification Missense Mutation Truncating Mutation Inframe Mutation
PIK3CA 12%
Figure 2: PI3K signaling in PIK3CA mutant NHA (A) Immunoblot of cell lysates probed for the HA tagged PIK3CA, phosphorylated AKT, total AKT, GAPDH (loading control), and phosphorylated S6 (B) Plot of HA levels relative to PIK3CAwt. (C) Plot of pAKT levels relative to parental NHAs. (D) Plot of pS6 levels relative to parental NHAs.
Figure 3: PI3K signaling in PIK3CA mutant NHARAS. (A) Immunoblot of cell lysates probed for HA tag, phosphorylated AKT, total AKT, phosphorylated ERK, total ERK, GAPDH (loading control), and phosphorylated S6. (B) Plot of HA levels relative to PIK3CAwt. (C) Plot of pAKT levels relative to parental. (D) Plot of pS6 levels relative to parental. (*) dictates significant difference from parental and (**) dictates significant difference from PIK3CAwt.
A"
B"
C"
D"
A"
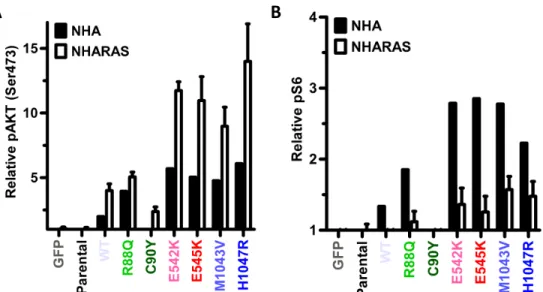
Figure 4: Comparison of phosphorylated AKT and phosphorylated S6 between NHA and NHARAS cells. (A) Plot of pAKT in NHA and NHARAS relative to parental cells. (B) Plot of pS6 in NHA and NHARAS relative to parental cells.