INFLUENZA VIRUS INFECTION—CAN FATTY ACIDS CHANGE INFECTIVITY?
By Kelly Liu
Honors Essay
Department of Nutrition
University of North Carolina
2018
Approved:
______________________________ Advisor
______________________________
Abstract
Kelly Liu: Influenza Viral Infection—Can Fatty Acids Change Infectivity?
The 2009 H1N1 pandemic identified obesity as a risk factor not only for complications and death related to influenza but also as a risk factor for infection despite vaccination.7, 10, 11 The virus replicates by budding from the host cell membrane, and this project aims to determine if the differential fatty acid composition of obese individuals’ serum may be responsible for the increased infectivity.8 Lung epithelial cells (A549) were grown in palmitate (16:0), oleic acid (18:1), or linoleic acid (18:2) at different concentrations, exposed to 128 HAU influenza virus, and the amount of infectious virus produced in each condition was determined by the TCID50 assay protocol. At 2 hours post-infection, the viral titer of cells incubated in 50 !"
polyunsaturated fatty acid (PUFA), 1.47×10! TCID
50, was significantly greater than that of
cells incubated in 200 !" PUFA, 2.37×10! TCID
50, 50 !" monounsaturated fatty acid
(MUFA), 1.38×10! TCID
50, and 50 !" saturated fatty acid (SFA), 1.33×10! TCID50. At 5
hours post-infection, the TCID50 from cells incubated in 50 !" PUFA, 1.00×10! TCID50,
was significantly greater than that of cells incubated in 50 !" MUFA, 2.85×10! TCID 50,
and control vehicle, 1.00×10! TCID
50. Cells incubated in 50 !" PUFA also produced a
TABLE OF CONTENTS
Introduction………1-4
Materials and Methods………...……4-7
Results………...8-13
Discussion……..………...14-17
Introduction
Influenza is a seasonal virus that causes annual epidemics, resulting in 3 to 5 million
cases of illness and 290,000 to 650,000 influenza related deaths yearly.7 The influenza
viruses A and B are typically the types that cause seasonal epidemics in humans.6 Various
factors increase one’s risk of influenza related complications including age and chronic
medical conditions; however, the 2009 H1N1 pandemic of influenza A brought a new risk
factor to light: obesity.7, 10 Obesity is defined as an adult having a Body Mass Index
(BMI= !"#$!! !"!!"#!! !" !!"!) equal to or greater than 30 or a child having a BMI equal to or greater
than the 85th percentile for their age and height.13 This is of particular concern in the United
States, as data from the 2013-2014 National Health and Nutritional Examination Surveys
indicates that 37.7% of adults are obese and 16.7% of children and adolescents aged 2 to 19
years old are obese. In addition, 32.5% of U.S. adults are overweight and considered to be at
an increased risk of obesity.13 National trends of increasing obesity are concerning with its
newfound role in influenza infection and complication. There is a higher risk of
influenza-related hospitalization for those who have a BMI equal to or greater than 30 and an increased
odds of death correlating with a BMI equal to or greater than 40.10 In addition to increasing
risk of influenza-related complications and death, obesity similarly increases risk of influenza
infection, even if the individual is vaccinated. In comparison to healthy weight counterparts,
vaccinated obese individuals have twice the risk of contracting the flu.11 The exact role of
obesity in increasing risk of influenza infection and complication has yet to be determined.
The influenza virus is an enveloped virus with a lipid bilayer containing
hemagglutinin, neuraminidase, and matrix 2 protein.18 The subtype of illness is based on the
pandemic influenza strain was H1N1, as it had subtypes hemagglutinin 1 and neuraminidase
1.6 The virus infects the host cell and replicates via budding off the plasma membrane of the
infected host.8 Infection begins as hemagglutinin on the lipid bilayer of the virus binds to a
sialic acid residue on the host cell, and the virus enters the host via receptor-mediated
endocytosis. With endocytosis, the virus is in an endosome that has a pH of 5 to 6, which
triggers fusion of the viral and endosomal membranes. Following transcription and
replication of the viral genome, viral particles bud from the apical side of the host cell
membrane.18 It is hypothesized that the aggregation of hemagglutinin and neuraminidase in
lipid rafts of the host cell membrane causes a change in the curvature of the membrane, thus
initiating viral budding.17
It has been determined that the influenza viral envelope contains a higher ratio of
saturated fatty acids to unsaturated fatty acids in comparison to the host cell.8, 17 A previous
study by Kohn et al. examined the effects of incubating various viruses, including Influenza
A, with various fatty acids, such as linoleic acid (18:2), oleic acid (18:1), and stearic acid
(18:0).8 Fatty acids are capable of a wide array of direct effects on a cell as well as creating
downstream effects. Incorporation of fatty acids into a cellular membrane changes the
membrane fluidity and permeability.5 While unsaturated fatty acids increase membrane
fluidity by being unable to pack close together due to kinks introduced by double bonds,
saturated fatty acids lack a double bond and are able to pack close together, increasing
membrane rigidity.21 The study concluded that the incubation with unsaturated fatty acids led
to loss of viral infectivity likely due to the structural changes in the viral membrane caused
by the incorporation of the unsaturated fatty acids; however, reduced infectivity was not
contain more saturated fatty acids in comparison to unsaturated fatty acids and are therefore
more “rigid,” the incorporation of unsaturated fatty acids into the viral envelope disrupts its
ability to replicate via budding.8
In regards to obesity, this condition yields a myriad of physiological symptoms that
are detrimental to an individual’s health. It is associated with high blood pressure, Type 2
Diabetes, heart disease, non-alcoholic fatty liver disease, metabolic syndrome, and more.12
One consequence of obesity with a possible role in influenza infection is elevated serum fatty
acid levels. Increased serum levels are likely a consequence of a greater release of free fatty
acids in obese individuals compared to lean individuals due to larger adipose stores in the
obese.3 The elevation in plasma levels primarily reflects an increase in the serum levels of
saturated fatty acids rather than all types of fatty acids.21 From a population-based cohort
study of 4,232 subjects, it was determined that elevated serum palmitate (16:0) levels
correlate with abdominal obesity and a higher BMI, whereas serum linoleic acid (18:2) and
alpha-linoleic acid (18:3) levels are inversely related to abdominal obesity and BMI.1 With
this in mind, it is a question whether composition and levels of serum fatty acid may be
contributing to obese individuals’ increased risk of influenza infection.
As abdominally obese individuals typically have elevated amounts of serum saturated
fatty acids, our research investigates this as a possible mechanism explaining the greater
incidence of influenza infection in obese individuals.1 In this study, A549 cells were
incubated with various fatty acids at a low concentration and high concentration. A549 cells
are cancerous lung epithelial cells widely used in influenza infection studies.9 It has been
confirmed that A549 cells incorporate serum fatty acids into their membranes with
polyunsaturated fatty acids at different concentrations, we may begin to determine if an
elevation of a particular fatty acid in serum is enhancing obese individuals’ risk for influenza
infection. Following a 24-hour incubation period, the A549 cells were infected with
Influenza Virus H1N1 Strain A/PR/8/34. Aliquots of the supernatant were later removed
from the cells and used to determine the amount of infectious virus produced using the
TCID50 assay protocol, or the 50% Tissue Culture Infectious Dose. The TCID50 indicates the
amount of infectious viral titer that is able to produce cytopathic effects in 50% of inoculate
cells.15 As influenza does not produce cytopathic effects in its host cells, hemagglutination
was assessed instead.
With this supporting background information, my hypothesis is that the amount of
viral titer will be the greatest from A549 cells incubated with the media containing palmitate
in comparison to that of cells incubated with either oleic acid or linoleic acid. The
incorporation of the saturated fatty acids into the host cell membrane will not adversely affect
viral budding and will thus yield the greatest amount of viral reproduction. Cells incubated
with monounsaturated fatty acids will produce a decreased viral titer, as the incorporation of
unsaturated fatty acids into the host cell membrane is unfavorable for the more “rigid” viral
envelope. Because the incorporation of polyunsaturated fatty acids will produce a more fluid
host cell plasma membrane, the cells incubated with polyunsaturated fatty acids will produce
the least amount of viral titer due to the disruption of viral budding.
Materials and Methods Cell Lines
A549 and MDCK cells were grown separately and regularly split. Both cell lines
L-glutamine, and 1mM sodium pyruvate with additional 10% fetal calf serum, L-L-glutamine,
and penicillin/streptomycin.
Fatty Acid Preparations
Solutions of 5mM palmitate (16:0), oleic acid (18:1), linoleic acid (18:2), and a
control of 1:1 ethanol to water were prepared. First, 60 mg of solid bovine serum albumin
was combined into 5 mL of water to make 1% fatty acid free bovine serum albumin. The
solution was stirred for 30 minutes, and additional water was added to reach 6 mL of 1% FA
free BSA.
To prepare the control vehicle, 965 !" 1% FA free BSA with 10 !" butylated
hydroxytoulene, 12.5 !" of ethanol, and 12.5 !" of water. To prepare the palmitic acid
solution, 965 !" 1% FA free BSA was combined with 10 !" BHT and 25 !" of 200 mM
palmitic acid. The oleic acid and linoleic acid solutions were prepared similarly to the
palmitic acid solution, using oleic acid and linoleic acid respectively in place of palmitic
acid. BHT functions as an antioxidant in the solution to minimize fatty acid oxidation.
The fatty acid solutions and control were placed in an incubator shaker at 37°C for 45
minutes to allow the fatty acids to conjugate to albumin. All solutions were then sterile
filtered. The final 5mM solutions and the control solution were kept frozen at -20°C.
Fatty Acid Incorporation and Viral Infection
A549 cells were split into 24-well plates, using 0.20 mL of cells and 1.25 mL of
DMEM media. The plates were incubated overnight at 37°C. From each 5 mM fatty acid
solution, two dilutions of 50 !" and 200 !" were made using DMEM without FBS. Each
plate of cells was inoculated with 1 mL of either concentration of palmitic acid, oleic acid, or
control vehicle, and another row of cells on each plate was solely incubated with DMEM no
FBS. The plates were then incubated for 24 hours at 37°C.
Following the 24-hour incubation period, cells were inoculated with 128 HAU of
Influenza Virus H1N1 Strain A/PR/8/34. The plates were then incubated at 37°C for one
hour. Next, 1 mL of the corresponding fatty acid concentration media was added back to the
cells. The plates were placed in the incubator at 37°C again for an hour. An aliquot of 100 !"
was removed from each well, and the plates were placed back in the incubator. Aliquots of
100 !" were taken from the supernatant at the hour mark for 6 hours, then at 24 hours and 48
hours from addition of virus. Virus aliquots were stored in -80°C.
Influenza Virus TCID5015
The following Influenza Virus TCID50 procedure was repeated for each hour aliquot
of each fatty acid condition.
First, trypsin with EDTA was added to a confluent 75 cm2 flask of Madin-Darby
Canine Kidney cells, and the cells were re-suspended in 40 mL of DMEM per flask. Then,
100 !" of cells was dispensed into each well of the 96-well round-bottom plates. The cells
were incubated overnight at 37°C.
Serum-free DMEM with trypsin was prepared by adding 0.8 mL of 0.25% trypsin
without EDTA per 100 mL DMEM. Then, 180 !" of the trypsin-containing media was added
to each well of sterile, round-bottom 96-well plates. To prepare the virus dilutions, 20 !" of
the viral aliquot was added to the first well in each column. Using a multichannel pipet, the
first row of wells containing the virus suspension was mixed, and 20 !" was transferred from
row 1 to row 2. This process was completed down to the 6th row, changing tips between each
The media was removed from the plate containing the MDCK cells. Using a
multichannel pipette, 100 !" of the virus dilution was transferred to the corresponding well
containing MDCK cells. The plate was incubated for 5 days at 37°C.
A hemagglutination assay was used to determine the tissue culture infectious dose
that will infect 50% of inoculated cells (TCID50). A 0.5% turkey red blood cell suspension
was prepared, and 50 !" of the solution was dispensed into each well of the plate. The plate
was left to settle for 2 hours, after which hemagglutination was assessed to determine the
TCID50.
The TCID50 is a measure of the amount of infectious viral titer produced. It indicates
the amount of virus necessary to produce cytopathic effects in 50% of the cells that are
inoculated with the virus. As the influenza virus does not produce cytopathic effects on the
host cell, a modified version of the TCID50 assay protocol was used. Hemagglutination was
assessed as the equivalent of cytopathic effects in the host cell. Hemagglutination occurs if
the viral hemagglutinin protein is able to bind the turkey red blood cells in sufficient amounts
to create a “mat”. If hemagglutination does not occur, the turkey red blood cells settle as a
single red button in the well. The presence of hemagglutination is determined to be positive,
and the presence of a red blood cell button is determined to be negative. The following
equation was used to determine the TCID50 of each plate using the results from the
hemagglutination assay.
!"#$%&!!"
!"" !" = dilution where> 50%have CPE+
%!"#$%$&' !"#$%!"%!!"%
Results
The results of the TCID50 were assessed in various manners to determine if there was
a significant relationship between the amount of infectious viral titer produced and the type
of fatty acid in the media or the concentration of the fatty acids in the media. Using the
statistical software PRISM, an outlier was identified and removed from the data. The outlier
was a TCID50 value of 4.22×10! TCID50 at 2 hours following initial infection in the control
group.
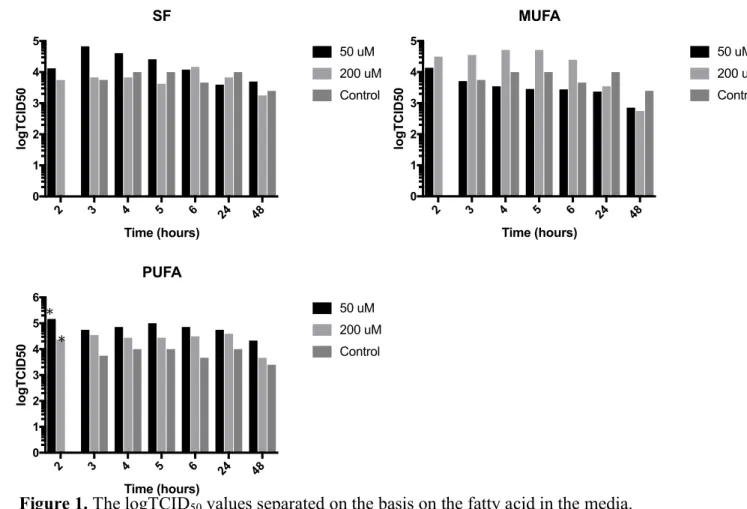
Separating the results by the type of fatty acid used in the media for in the 24-hour
incubation period yielded the graphs shown in Figure 1. A 2-way ANOVA comparing
TCID50 values of the cells grown in the 50 !" SFA media, 200 !" SFA media, and the
control yielded no significant difference between any conditions at any time. This was also
true for the TCID50 values of the cells grown in the monounsaturated fatty acid medias. A
2-way ANOVA comparing the TCID50 values of the conditions for the cells grown in the
polyunsaturated fatty acid medias indicated that after 2 hours of initial infection the TCID50
of the cells grown in 50 !" PUFA media, 1.47×10! TCID
50, was significantly greater than
the TCID50 of the cells grown in 200 !" PUFA media, 2.37×10! TCID50 (p-value = 0.0271;
95 CI 10252, 236348). With the cells grown in the PUFA containing media there is a general
trend that at every hour the cells grown in the 50 !" PUFA media have the greatest TCID50,
followed by those grown in the 200 !" PUFA solution, and the control cells yield the lowest
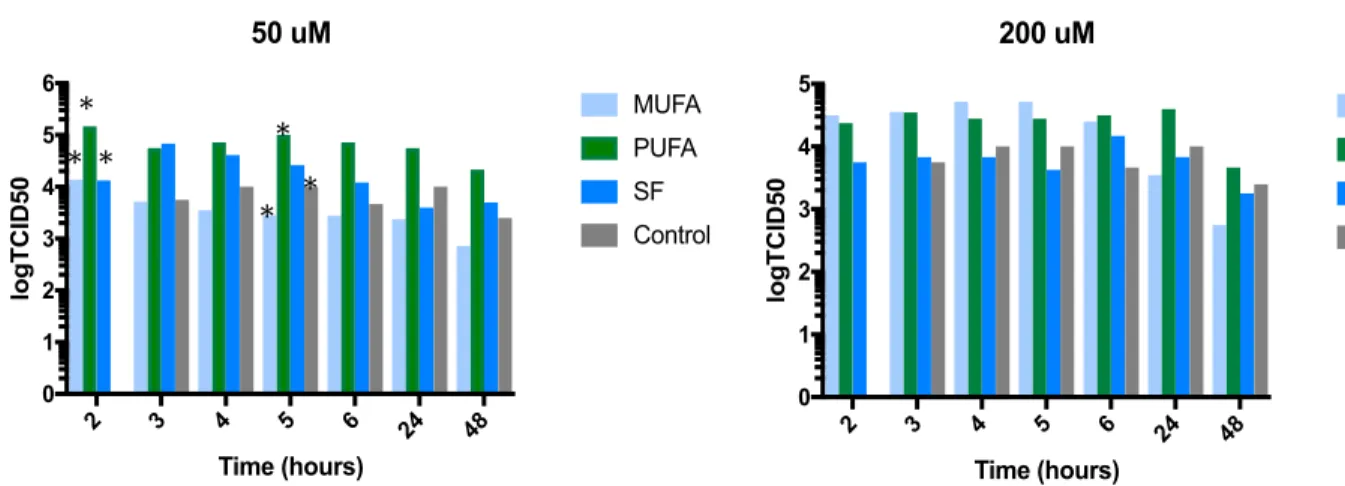
The TCID50 values were also separated and analyzed based on concentration of fatty
acid in the media, as shown in Figure 2. A 2-way ANOVA of TCID50 values from cells
grown in 200 !" fatty acid medias indicate no difference between the TCID50 values of cells
grown in any fatty acid media at any hour. A 2-way ANOVA of TCID50 values from cells
grown in 50 !" fatty acid medias indicates that at 2 hours following initial infection, the
TCID50 value of the cells grown in PUFA media, 1.47×10! TCID50, was significantly
greater than the TCID50 of the cells grown in MUFA media, 1.38×10! TCID50 (p-2 3 4 5 6 24 48
0 1 2 3 4 5 Time (hours) logTCID50 SF 50 uM 200 uM Control
2 3 4 5 6 24 48 0 1 2 3 4 5 Time (hours) logTCID50 MUFA 50 uM 200 uM Control
2 3 4 5 6 24 48 0 1 2 3 4 5 6 Time (hours) logTCID50 PUFA 50 uM 200 uM Control * *
Figure 1. The logTCID50 values separated on the basis on the fatty acid in the media.
Though there was no significance between the viral titers in the measures from cells incubated in saturated fatty acid or monounsaturated fatty acid, the viral titer from cells incubating in 50 !" PUFA was significantly greater than the titer measured from cells incubating in 200 !" PUFA. An outlier value of 4.22×10! TCID
50 at 2 hours in the
1.33×10! TCID
50 (p-value=0.0021; 95 CI 46232, 221168). In addition, at 5 hours following
initial infection, the TCID50 of the cells grown in PUFA media, 7.20×10! TCID50, is
significantly greater than the TCID50 of the cells grown in MUFA media, 2.78×10! TCID50
(p-value= 0.0265, 95 CI -184618, -9682), and it is also significantly greater than the TCID50
of the cells grown in the control media, 4.64×10! TCID
50 (p-value= 0.0425, 95 CI 2532,
177468).
Figure 2. The logTCID50 values separted on the basis of concentration of the fatty acid
media. At 2 hours post-infection in 50 uM media, the cells in PUFA containing media had a signifincantly higher viral titer than those in the MUFA and SFA containing media. At 5 hours post-infection in 50 uM media, the cells in PUFA containing media also had a significantly higher viral titer than those in the MUFA containing media and control group. There was no signifncance between the viral titers measured from cells incubating in any fatty acid media at 200 uM. An outlier value of 4.22×10! TCID
50 at 2 hours in the control
group was removed.
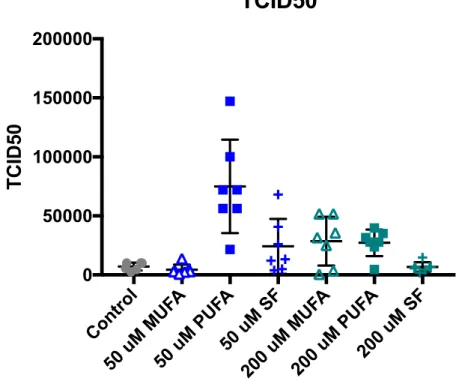
A one-way ANOVA was performed to examine differences between the mean TCID50 values of the various conditions and the control, as shown in Figure 3. The mean
TCID50 from the cells grown in the 50 !" PUFA media, 7.4986×10! TCID50 was
significantly greater than the TCID50 from the cells grown in the control media, 7.128×10!
TCID50 (p-value<0.0001; 95 CI -102165, -33550), the TCID50 from cells grown in the 50 !"
MUFA media, 4.451×10! TCID
50 (p-value<0.0001; 95 CI -104102, -36966), and the 2 3 4 5 6 24 48
0 1 2 3 4 5 6 Time (hours) logTCID50 50 uM MUFA PUFA SF Control
TCID50 from the cells grown in the 50 !" SFA media, 6.679×10! TCID50 (p-value=
0.0006; 95 CI 17223, 84360). The mean TCID50 from the cells grown in 50 !" PUFA were
also signifincalty greater than the mean TCID50 from the cells grown in 200 !" MUFA,
2.8553×10! TCID
50 (p-value= 0.0019; 95 CI 12864, 80001), the mean TCID50 from the
cells grown in 200 !" PUFA, 2.7206×10! TCID
50 (p-value= 0.0013, 95 CI 14212, 81348),
and the mean TCID50 from the cells grown in 200 !" SFA, 6.679×10! TCID50
(p-value<0.0001; 95 CI 34739, 101875).
Figure 3. TCID50 values at each time point following initial infection (2 hr, 3 hr, 4 hr, 5 hr, 6
hr, 24 hr, 48 hr) for cells incubating in each fatty acid media condition and the vehicle control. An outlier value of 4.22×10! TCID
50 in the control group was removed. The mean
TCID50 value was statistically greater than the mean TCID50 values of the other conditions.
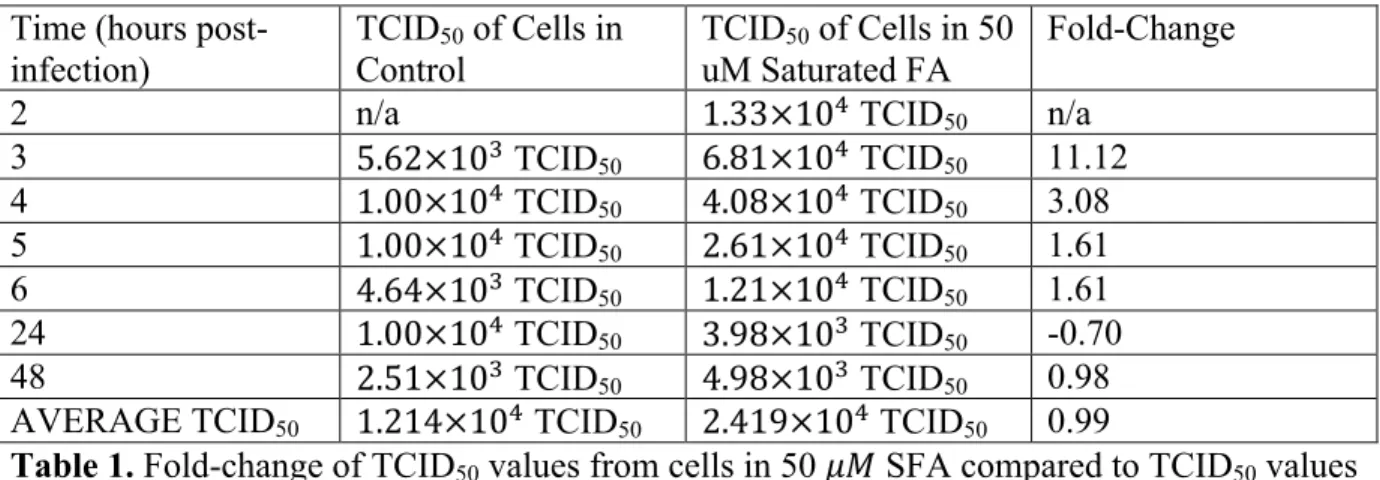
Change of the TCID50 values from each time point of each fatty acid media condition
in comparison to the TCID50 values of the cells grown in the control media was assessed by
determining fold-change, as shown in tables 1-6. The TCID of the cells grown in 50 !" Contr
ol
50 u M MU
FA
50 u M PU
FA
50 u M SF
200 uM
MUFA
200 uM
PUFA 200
uM SF 0
50000 100000 150000 200000
TCID50
MUFA were consistently lower than that of the control cells, as shown in table 3. The cells
grown in the 50 !" PUFA and the 200 !" PUFA consistently yielded a higher TCID50 than
the control cells at every time point, as shown in tables 5 and 6. In regards to the other
conditions, there was no consistent trend in the fold-change between the TCID50 of the
variables and the TCID50 of the control cells. The average fold-changes between the TCID50
of control cells and TCID50 values from cells in 50 !" SFA, 200 !" MUFA, 50 !" PUFA,
and 200 !" PUFA were positive. The average fold-changes between the TCID50 of control
cells and TCID50 values from cells in 200 !" SFA and 50 !" MUFA were negative and
indicative of lower average TCID50 values.
Time (hours post-infection)
TCID50 of Cells in
Control
TCID50 of Cells in 50
uM Saturated FA
Fold-Change
2 n/a 1.33×10! TCID
50 n/a
3 5.62×10! TCID
50 6.81×10! TCID50 11.12
4 1.00×10! TCID
50 4.08×10! TCID50 3.08
5 1.00×10! TCID
50 2.61×10! TCID50 1.61
6 4.64×10! TCID
50 1.21×10! TCID50 1.61
24 1.00×10! TCID
50 3.98×10! TCID50 -0.70
48 2.51×10! TCID
50 4.98×10! TCID50 0.98
AVERAGE TCID50 1.214×10! TCID50 2.419×10! TCID50 0.99
Table 1. Fold-change of TCID50 values from cells in 50 !" SFA compared to TCID50 values
Time (hours post-infection)
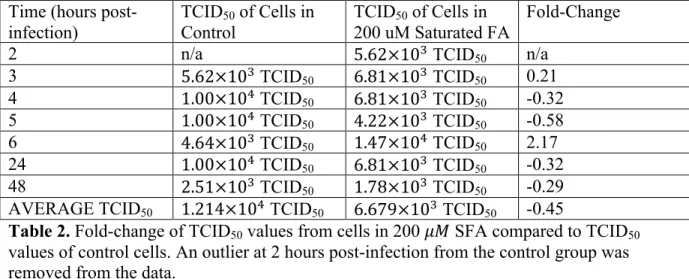
TCID50 of Cells in
Control
TCID50 of Cells in
200 uM Saturated FA
Fold-Change
2 n/a 5.62×10! TCID
50 n/a
3 5.62×10! TCID
50 6.81×10! TCID50 0.21
4 1.00×10! TCID
50 6.81×10! TCID50 -0.32
5 1.00×10! TCID
50 4.22×10! TCID50 -0.58
6 4.64×10! TCID
50 1.47×10! TCID50 2.17
24 1.00×10! TCID
50 6.81×10! TCID50 -0.32
48 2.51×10! TCID
50 1.78×10! TCID50 -0.29
AVERAGE TCID50 1.214×10! TCID50 6.679×10! TCID50 -0.45
Table 2. Fold-change of TCID50 values from cells in 200 !" SFA compared to TCID50
values of control cells. An outlier at 2 hours post-infection from the control group was removed from the data.
Time (hours post-infection)
TCID50 of Cells in
Control
TCID50 of Cells in 50 uM
Monounsaturated FA
Fold-Change
2 n/a 1.38×10! TCID
50 n/a
3 5.62×10! TCID
50 5.13×10! TCID50 -0.09
4 1.00×10! TCID
50 3.51×10! TCID50 -0.65
5 1.00×10! TCID
50 2.85×10! TCID50 -0.71
6 4.64×10! TCID
50 2.78×10! TCID50 -0.40
24 1.00×10! TCID
50 2.37×10! TCID50 -0.76
48 2.51×10! TCID
50 7.20×2 TCID50 -0.71
AVERAGE TCID50 1.214×10! TCID50 3.116×10! TCID50 -0.63
Table 3. Fold-change of TCID50 values from cells in 50 !" MUFA compared to TCID50
values of control cells. An outlier at 2 hours post-infection from the control group was removed from the data.
Time (hours
post-infection) TCIDControl 50 of Cells in TCIDuM Monounsaturated FA 50 of Cells in 200 Fold-Change
2 n/a 3.16×10! TCID
50 n/a
3 5.62×10! TCID
50 3.55×10! TCID50 5.32
4 1.00×10! TCID
50 5.18×10! TCID50 4.18
5 1.00×10! TCID
50 5.18×10! TCID50 4.18
6 4.64×10! TCID
50 2.51×10! TCID50 4.41
24 1.00×10! TCID
50 3.51×10! TCID50 -0.65
48 2.51×10! TCID
50 5.62×10! TCID50 -0.78
AVERAGE TCID50 1.214×10! TCID50 2.855×10! TCID50 1.35
Table 4. Fold-change of TCID50 values from cells in 200 !" MUFA compared to TCID50
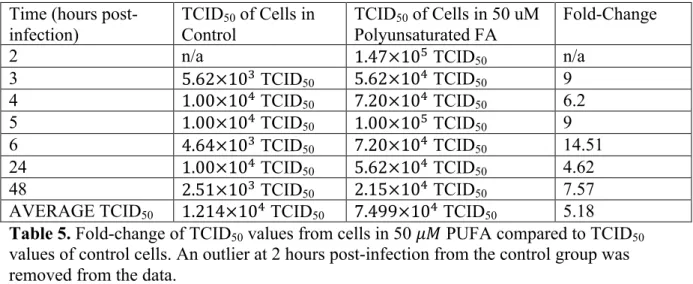
Time (hours post-infection)
TCID50 of Cells in
Control
TCID50 of Cells in 50 uM
Polyunsaturated FA
Fold-Change
2 n/a 1.47×10! TCID
50 n/a
3 5.62×10! TCID
50 5.62×10! TCID50 9
4 1.00×10! TCID
50 7.20×10! TCID50 6.2
5 1.00×10! TCID
50 1.00×10! TCID50 9
6 4.64×10! TCID
50 7.20×10! TCID50 14.51
24 1.00×10! TCID
50 5.62×10! TCID50 4.62
48 2.51×10! TCID
50 2.15×10! TCID50 7.57
AVERAGE TCID50 1.214×10! TCID50 7.499×10! TCID50 5.18 Table 5. Fold-change of TCID50 values from cells in 50 !" PUFA compared to TCID50
values of control cells. An outlier at 2 hours post-infection from the control group was removed from the data.
Time (hours post-infection)
TCID50 of Cells in
Control
TCID50 of Cells in 200
uM Polyunsaturated FA
Fold-Change
2 n/a 2.37×10! TCID
50 n/a
3 5.62×10! TCID
50 3.51×10! TCID50 5.25
4 1.00×10! TCID
50 2.78×10! TCID50 1.78
5 1.00×10! TCID
50 2.78×10! TCID50 1.78
6 4.64×10! TCID
50 3.16×10! TCID50 5.81
24 1.00×10! TCID
50 3.98×10! TCID50 2.98
48 2.51×10! TCID
50 4.64×10! TCID50 0.85
AVERAGE TCID50 1.214×10! TCID50 2.721×10! TCID50 1.24
Table 6. Fold-change of TCID50 values from cells in 200 !" PUFA compared to TCID50
values of control cells. An outlier at 2 hours post-infection from the control group was removed from the data.
Discussion
Contrary to the hypothesis stated, the viral titer from the cells incubated with
palmitate was not the highest. Though hypothesized that the TCID50 from the cells incubated
with the polyunsaturated fatty acid containing medias would be among the lowest, the cells
incubated in the 50 !" PUFA media actually produced the greatest average viral titer of all
conditions. Incubation of the A549 cells in 50 !" PUFA media, 200 !" MUFA media, 200
!" PUFA media, and 50 !" SFA media all produced an average TCID50 greater than that of
the control, though only the average TCID50 of the cells incubated with 50 !" PUFA was
200 !" SFA media and 50 !" MUFA media yielded average TCID50 values that were less
than that of the control cells, though neither comparison was significant. In addition, there
did not appear to be a clear, consistent trend regarding amount of infectious virus produced
and the concentration of fatty acid medias. In general, incubation with a PUFA containing
media increased the viral titer whereas incubation with a SFA or MUFA containing media
yielded mixed results. The findings from this project appear to align with a previous study by
Beck et al. who found that fish oil fed mice had a higher viral load in the lungs following
influenza infection in comparison to the control mice. This study implicated the
anti-inflammatory properties of fish oil feeding as cause for fewer CD8+ T cells and decreased
expression of various inflammatory signaling proteins such as TNF-a and IL-6.19 As the cell
culture in this project only contained A549 cells and did not contain immune cells, it may be
possible that inflammatory cytokines produced by the host cell are having an effect on viral
infectivity.
It is important to consider that the study done by Kohn et al. incubated the influenza
virus directly in the fatty acid solutions, whereas the host cells were incubated with the fatty
acids in this project with the goal of changing the host cell membrane from which viral
particles bud off.8 The substrate of incubation may have had an effect based on the difference
between directly incorporating the fatty acids into the viral envelope versus incorporation of
the fatty acids into the host cell membrane. The incorporation of fatty acids into host cells
may affect other aspects of the cell beyond viral budding, such as cell signaling and
production of cytokines, whereas incorporation into the lipid bilayer of the virus would not
induce such effects.14 Though there is literature regarding the effects of omega-3 fatty acids
fatty acids, such as linoleic acid, and their role. It is important to consider the possibility for
different effects with omega-3 and omega-6 fatty acids, as omega-3 FA are touted to be
anti-inflammatory and omega-6 FA are seen as pro-anti-inflammatory.20
Limitations in this project include the representation of serum fatty acids used in the
incubation process. In reality, human serum contains a variety of fatty acids and is not
limited to a single type. It is possible that the results would differ if various fatty acids were
used in the media rather than merely exposing the host cell to one type. In addition, the
concentrations of fatty acids used in this project corresponded with the findings of a previous
Belgian study characterizing nonesterified fatty acid levels. For palmitate, oleic acid, and
linoleic acid, the 50 !" value is within the range of average observed concentrations, and
200 !" was arbitrarily chosen to be the high concentration.16 These values may not
accurately reflect the fatty acid levels in obese American individuals and thus, different
concentrations of fatty acids may have a more accurate representation of normal serum levels
and elevated serum levels. In addition, it has been shown that different fatty acids are
cytotoxic at different concentration ranges, depending on the cell type.2 It is possible that the
fatty acids used may have different cytotoxic levels on A549 cells, which may have affected
cell growth and subsequent viral production. Further limitations include plate-to-plate
variability. As each type of fatty acid was treated on a separate 24-well plate and each
supernatant assayed on a separate 96-well plate, it is possible that there were subtle variations
between the plates that may have contributed to or masked significant differences.
The results of my study provide some direction for future areas of research regarding
obesity, lipids and influenza. With future research of similar design, the amount and identity
means of investigating the cell’s propensity to incorporate a type of fatty acid and to ensure
that incorporation is occurring. Fatty acids used in media should also more accurately reflect
the variety in human serum, both in obese and non-obese individuals. In addition, cytotoxic
concentrations of fatty acids should be determined for the cell line in use. Other areas for
future research include the differences of omega-3 and omega-6 FA in regards to cell defense
and influenza infection. As mentioned previously, omega- 3 FA are known to be
anti-inflammatory while omega-6 FA are pro-anti-inflammatory.20 With increased investigation into
the effects of omega-3 FA on cell cytokine production and defense, it may be interesting to
Works Cited
1. Alsharari, Z. D., Risérus, U., Leander, K., Sjögren, P., Carlsson, A. C., Vikström, M.,
. . . Marklund, M. (2017). Serum Fatty Acids, Desaturase Activities and Abdominal
Obesity – A Population-Based Study of 60-Year Old Men and Women. Plos
One,12(1). doi:10.1371/journal.pone.0170684
2. Bégin, M. E. (1987). Effects of polyunsaturated fatty acids and of their oxidation
products on cell survival. Chemistry and Physics of Lipids,45(2-4), 269-313.
doi:10.1016/0009-3084(87)90069-7
3. Boden, G. (2008). Obesity and Free Fatty Acids (FFA). Endocrinology and
Metabolism Clinics of North America,37(3), 635-646. doi:10.1016/j.ecl.2008.06.007
4. Bryan, D., Hart, P., Forsyth, K., & Gibson, R. (2001). Incorporation of α-linolenic
acid and linoleic acid into human respiratory epithelial cell lines. Lipids,36(7),
713-717. doi:10.1007/s11745-001-0776-7
5. Ibarguren, M., López, D. J., & Escribá, P. V. (2014). The effect of natural and
synthetic fatty acids on membrane structure, microdomain organization, cellular
functions and human health. Biochimica Et Biophysica Acta (BBA) -
Biomembranes,1838(6), 1518-1528. doi:10.1016/j.bbamem.2013.12.021
6. Influenza (Flu). (2017, September 27). Retrieved April 8, 2018, from
https://www.cdc.gov/flu/about/viruses/types.htm
7. Influenza (Seasonal). (n.d.). Retrieved April 09, 2018, from
http://www.who.int/mediacentre/factsheets/fs211/en/
8. Kohn, A., Gitelman, J., & Inbar, M. (1980). Unsaturated free fatty acids inactivate
animal enveloped viruses. Archives of Virology,66(4), 301-307.
doi:10.1007/bf01320626
9. Lin, S., Liu, N., Yang, Z., Song, W., Wang, P., Chen, H., . . . Cai, Z. (2010).
GC/MS-based metabolomics reveals fatty acid biosynthesis and cholesterol metabolism in cell
lines infected with influenza A virus. Talanta,83(1), 262-268.
doi:10.1016/j.talanta.2010.09.019
10. Louie, J. K., Acosta, M., Samuel, M. C., Schechter, R., Vugia, D. J., Harriman, K., & Matyas, B. T. (2011). A Novel Risk Factor for a Novel Virus: Obesity and 2009
Pandemic Influenza A (H1N1). Clinical Infectious Diseases,52(3), 301-312.
doi:10.1093/cid/ciq152
11. Neidich, S. D., Green, W. D., Rebeles, J., Karlsson, E. A., Schultz-Cherry, S., Noah, T. L., . . . Beck, M. A. (2017). Increased risk of influenza among vaccinated adults
who are obese. International Journal of Obesity,41(9), 1324-1330.
doi:10.1038/ijo.2017.131
12. Obesity. (n.d.). Retrieved April 8, 2018, from
https://stanfordhealthcare.org/medical-conditions/healthy-living/obesity.html
13. Overweight & Obesity Statistics. (2017, August 01). Retrieved April 09, 2018, from
https://www.niddk.nih.gov/health-information/health-statistics/overweight-obesity
14. Papackova, Z., & Cahova, M. (2015). Fatty Acid Signaling: The New Function of
Intracellular Lipases. International Journal of Molecular Sciences,16(2), 3831-3855.
doi:10.3390/ijms16023831
16. Rogiers, V. (1981). Long chain nonesterified fatty acid patterns in plasma of healthy
children and young adults in relation to age and sex. Journal of Lipid Research,22,
1-6. Retrieved from http://www.jlr.org/content/22/1/1.full.pdf
17. Rossman, J. S., & Lamb, R. A. (2011). Influenza virus assembly and
budding. Virology,411(2), 229-236. doi:10.1016/j.virol.2010.12.003
18. Samji, T. (2009, December). Influenza A: Understanding the viral life cycle.
Retrieved April 09, 2018, from http://www.ncbi.nlm.nih.gov/pubmed/20027280
19. Schwerbrock, N. M., Karlsson, E. A., Shi, Q., Sheridan, P. A., & Beck, M. A. (2009).
Fish Oil-Fed Mice Have Impaired Resistance to Influenza Infection. The Journal of
Nutrition,139(8), 1588-1594. doi:10.3945/jn.109.108027
20. Schmitz, G., & Ecker, J. (2008). The opposing effects of n−3 and n−6 fatty
acids. Progress in Lipid Research,47(2), 147-155. doi:10.1016/j.plipres.2007.12.004
21. Weijers, R. N. (2015). Membrane flexibility, free fatty acids, and the onset of
vascular and neurological lesions in type 2 diabetes. Journal of Diabetes & Metabolic