Abstract
Funders are increasingly requiring that only evidenced-based nutrition education
approaches are used to promote health behavior change. The intent of this approach is to
optimize nutrition education program effectiveness by integrating the best available evidence
from research and practice. However, this requirement can undermine efforts of culturally unique
areas to create their own practice-based nutrition education programs using real-world
experience with local populations. Public health professionals working with SNAP Ed in Hawaii,
home to a population with a rich cultural background, know this all too well. In light of recent
SNAP Ed requirements mandating all states use evidence-based approaches for nutrition
education, this paper seeks to explore the experiences of SNAP Ed in Hawaii with using
evidence-based nutrition education programs for Native Hawaiian and Other Pacific Island
populations. Using literature reviews, secondary data sources, and key informant interviews, this
paper describes key ways in which Native Hawaiian and Other Pacific Island population
differences should inform the development of practice-based nutrition education programs and
the challenges and opportunities related to using Mainland evidence-based nutrition education
I. Background
An estimated 1.4 million Native Hawaiians and Other Pacific Islanders (NHOPI) currently live in the US, and this population is projected to grow to more than 2.6 million by
20501. The 2010 Census race category for NHOPI, including those of mixed race, refers to
people of Native Hawaiian, Guamanian or Chamorro, Samoan, Polynesian, Micronesian, and
Melanesian descent1. Most NHOPI in the US live in Hawaii and California1. Many racial and
ethnic minorities lag behind whites in multiple indicators of poverty and health, and NHOPI are no exception. 2010 data from the Hawaii Community Health and Needs Assessment (CHNA) reveal that while Hawaii has, on average, a lower poverty rate than the US (9.6% vs. 13.8%),
18.2% of NHOPI in Hawaii live in poverty2. Though federal poverty levels (FPL) in Hawaii are
15% higher compared to the standard FPL, this likely underestimates the total amount of persons
in poverty, given the elevated cost of living in Hawaii and respectively lower average wages3,4,5.
In 2013, Hawaii’s average annual wage was only 88% of the average annual wage for the entire
US (see Figure 1)3. Furthermore, second quarter data from 2014 show that the state of Hawaii
currently has the highest cost of living with an adjusted consumer composite index (CPI) of
158.94. Groceries have an index of 157.4 and housing is more than double the “100.0” reference
point with an index of 206.04. Data from the US Bureau of Labor statistics indicate that the
unadjusted average CPI in Hawaii continues to climb at an elevated rate compared with the US average (see Figure 2)5.
Figure 1: Trends in average annual wages, Hawaii and US, 2000-20113.
Figure 2: Average Consumer Price Index, Hawaii vs. US, 2000-20115. 30,000
35,000 40,000 45,000 50,000
2000 2005 2010 2015
Average Annual Wages, 2000-2011
Average Annual Wage Hawaii Average Annual Wage US
160 180 200 220 240
2000 2002 2004 2006 2008 2010 2012
Average CPI Index, 2000-2011
In 2013, the Economic Research Service reported that 17.5 million households were food insecure in the US, meaning 14.5% of Americans lacked consistent access to food due to
having limited resources6. The estimated food insecurity rate in Hawaii from 2013 was 12.9%6.
While only 10% of white households are classified as food insecure in Hawaii, 31% of mixed
race households, and 48.5% of NHOPI households hold this classification7. A recent study using
data from the Behavior Risk Factor Surveillance System found that food insecure adults were
32% more likely to be obese than food secure adults (95% CI 1.17-1.50)8. The authors propose
several explanations for this relationship including the possibility that food insecure individuals overeat when food becomes available, have mechanisms of more efficient energy storage in response to weight cycling, and tend to consume highly available and affordable high fat and high sugar foods8.
The proportion of obese adults in Hawaii increased by nearly 40% from 2003 to 2010 (16.7% to 23.1%), with 28.3% of Native Hawaiians and 23.8% of Other Pacific Islanders falling
into this category2. Being obese increases the risk of developing chronic diseases such as type II
diabetes, hypertension, heart disease, stroke, several kinds of cancer, and early death9. Food
insecurity in low-income adults has also been directly linked with increased risk of diabetes and
hypertension, likely related to poor diet quality10.
In Hawaii’s 2013 CHNA, heart disease, stroke, diabetes, and cancer were among the top 10 pressing health issues in the state, with NHOPI most often carrying the largest share of
chronic disease burden compared to other ethnicities2. Data from the CHNA reveal that NHOPI
have substantially higher death rates from chronic disease compared to the state average (see
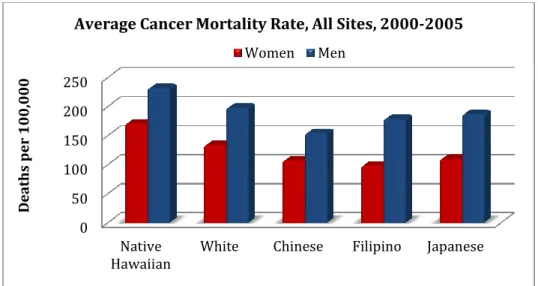
Figure 3)2. Of the five major ethnic groups in Hawai’i, Native Hawaiians have the highest
incidence and mortality rate of cancer (see Figure 4)11. Researchers attribute this to Native
Hawaiians’ increased likelihood to smoke tobacco and adhere to unhealthy diet patterns12.
Studying health disparities between NHOPI and other ethnic groups presents a challenge for two major reasons. Until 1997, there was no separate race category for NHOPI as they were included in the Asian and Pacific Island racial group in the majority of national data sets, a problem that still persists in some databases to this day. Secondly, there are often not enough Pacific Islanders
relative to other major ethnicities, even in Hawaii, to generate comparable health estimates11,12.
Figure 3: Population death rates, per 100,000 persons for selected chronic diseases, Hawaii state average vs. NHOPI2
0 100 200 300
Colorectal
Cancer CancerBreast Strokes DiseaseHeart
D
ea
th
s
p
er
10
0,
00
0
Disease Specific Death Rates, 2009-2011
Figure 4: Average cancer mortality rate, by race/ethnicity per 100,000 population. Mortality rates are age-adjusted to 2000 standard population11.
The major impact of lifestyle-related chronic disease in NHOPI populations, paired with their increased likelihood to be food insecure, highlights the need for high quality and culturally appropriate obesity prevention and nutrition education targeting low-income members of this population. However, before tackling chronic disease burden in low-income NHOPI populations, the high levels of food insecurity faced by this group must be addressed. In order to improve food access nationwide, the Supplemental Nutrition Assistance Program (SNAP) was created to partially subsidize the cost of food for low-income US residents. SNAP promotes food security in the nation’s most impoverished populations, while providing communities with increased revenue by improving low-income populations’ food purchasing power. SNAP provides millions of low-income families and individuals every year with billions of dollars in economic assistance
to purchase food13. In FY 2011, 21.1 million households received SNAP benefits, with 95% of
households served living at 130% or less of the FPL14.
Increasing the ability of low-income populations to purchase food is the important first step in addressing devastating rates of chronic disease, considering that obesity and increased risk of poor health often accompanies food insecurity. The second step is providing quality nutrition education that addresses modifiable risk factors for chronic disease, including poor diet and lack of physical activity. Comprehensive nutrition education includes direct opportunities for participants to build relevant skills as well as social and environmental supports for positive
dietary and health behaviors15. Nutrition education that is thoughtfully designed and
implemented can encourage positive dietary behavior change15.
The Food and Nutrition Service (FNS) of the USDA collaborates with state agencies, nutrition professionals, and other organizations to deliver nutrition education (SNAP Ed). SNAP Ed is designed specifically for US low-income populations, defined as those who have incomes
below 185% of the FPL13. SNAP Ed seeks to provide participants with the knowledge and skills
to make healthy food choices within a budget, and to incorporate regular physical activity into their lives. By modifying lifestyle-related chronic disease risk factors through sustained behavior change, the ultimate goal of SNAP Ed is to reduce the disproportionate burden of
nutrition-0 50 100 150 200 250
Native
Hawaiian White Chinese Filipino Japanese
D
ea
th
s
p
er
1
0
0
,0
0
0
Average Cancer Mortality Rate, All Sites, 2000-2005
related chronic disease in low-income populations, most often racial/ethnic minority groups in the US13,16.
Significant changes have recently been made to the national SNAP Ed program. Amendments to the Food and Nutrition Act (FNA) of 2008 according to the Healthy Hunger
Free Kids Act of 2010 (HHFKA) and the SNAP: Nutrition Education and Obesity Prevention
Grant Program Interim Rule require that all state SNAP Ed plans include nutrition education as
well as obesity prevention programs17. This represents a shift away from the previous model of
SNAP Ed solely providing individual and group level direct nutrition education. Now, states must also include policy, systems, environment and/or community-based interventions that focus
on obesity prevention17. Furthermore, all interventions and nutrition education must be
evidence-based with a focus on behavior change; requirements that are becoming more common place
among grants and other funding sources17. The fiscal year 2015 SNAP Ed guidance describes an
evidence-based approach as one in which high quality research and available evidence from
practice are meaningfully combined17. Evidence-based programs include both rigorously tested
research-based interventions and practice based interventions, with evidence of effect from the field. Several databases are maintained that contain research-based and practice-based nutrition
education programs appropriate for states to select for their SNAP Ed Plans17. However, the
effectiveness of these programs are often demonstrated in Mainland US, in states over 2,000 miles from Hawaii in both physical location and island culture.
Given the many differences between NHOPI in Hawaii and Mainland populations, evidence-based nutrition education programs (EBNEP) developed without consideration of these differences can result in programs that are not well-accepted or impactful in Hawaii SNAP Ed populations. This paper seeks to describe the challenges and opportunities related to the
implementation of EBNEP for SNAP Ed with NHOPI low-income populations in Hawaii and to explore how NHOPI population differences should inform nutrition education program
development. To explore this topic, interviews were conducted with 4 members of SNAP Ed implementing agencies in Hawaii, after they were given informed consent and made aware that information they provided would remain confidential. Relevant published literature was obtained from searches of PubMed and Google Scholar with key words such as “Pacific Islander”,
“nutrition”, “diet”, “acculturation”, “evidence-based”, “implementation”, and “food culture”. Pertinent secondary data was obtained from Census reports, the Hawaii Community Needs and Health Assessment, SNAP Ed reports from the national website, and Research and Economic Analysis data from Hawaii.gov.
II. NHOPI Cultural Aspects Missing From Mainland Nutrition Education Programs
One interviewee describes Hawaii’s multicultural population as one that is “Not a
melting pot…but forced to coexist”. The most ethnically and racially diverse state, Hawaii has no
ethnic or racial majority group and nearly two-thirds of the population identifies as non-white (see Figure 5)3,18.
Figure 5: Population racial breakdown for Hawaii, 2013 estimate18.
The NHOPI population in Hawaii, in addition to Native Hawaiians, can refer to immigrants and descendants from innumerable cultural backgrounds as the Pacific Islands include thousands of island nations. 2000 Census Data revealed that nearly 20% of NHOPI were foreign born, compared with 11% of the total US Population. For several Pacific Island
sub-groups, over half of members were born outside the US(see Figure 6)19.
Figure 6: Native Status of selected Pacific Islander subgroups vs. total US population, and total US Pacific Island population, 200019.
White, 26.6%
NHOPI, 10% African American,
2.3% Asian,
37.7% American
Indian or Alaska Native, 0.4%
Mixed, 23.1%
Hawaii Race Demographics, 2013
0% 20% 40% 60% 80% 100%
Nativity Status, 2000
Foreign Born
Furthermore, the high proportion of mixed race NHOPI results an extensive blending of race, ethnicity, and culture. Nearly three quarters (72.4%) of the 491,238 NHOPI residing in
Hawaii in 2010 identified as multiracial3. This diverse background of NHOPI sets the stage for a
multitude of food preferences, eating patterns, health beliefs, and health behaviors that differ from nutrition program target populations in the Mainland in ways that cannot always be entirely quantified. The sub-sections below highlight and describe some of these population differences identified by interviewees and suggest, based on available literature, why these differences should be considered in PBNEP development for NHOPI.
Food Culture
One interviewee described how Mainland EBNEP tend to conflict with Pacific Islander food culture by saying simply:
“The materials…use different recipes and foods than people eat here.”
Historically, meals in the Pacific Islands contained important starchy staples and accompaniments, including vegetables, meat, and/or seafood. In fact, language throughout the Pacific Islands reflects this division with words describing starchy staples as “real food” and the
accompaniments as “foods to be eaten with the real food”20. The traditional Hawaiian diet was
rich in complex carbohydrates such as poi (fermented paste made from taro corm), taro, sweet
potato, banana, and breadfruit. Their diet was supplemented with vegetables obtained from both the ocean and land, including sweet potato and taro leaves, ferns, and seaweed. Small amounts of lean meat, mainly fish or shellfish with some chicken and pork on special occasions, rounded out
their diet. Most foods were traditionally eaten raw or steamed21. Though colonization by the US
has forever altered food habits throughout the Pacific Islands, Hawaii included, many NHOPI still regularly consume these traditional foods.
One recent study examined the correlation between type II diabetes, diet pattern, and
ethnicity in participants living in a rural area on Hawaii Island22. They found that Native
Hawaiians consumed traditional Hawaiian dishes, often mixed with processed canned meats introduced to Hawaii by Western food commodity programs. The authors concluded that the animal fats added to foods or during meal preparation could contribute to higher rates of type II
diabetes in Native Hawaiians22. Another study in a multiethnic cohort of participants from
California and Hawaii found that poi made up 5% of Native Hawaiians’ total vegetable intake23.
Though only findings in Native Hawaiians are reported here, authors of both studies suggest that dietary change interventions should be developed to suit the unique food culture of
diverse populations living in Hawaii22,23. Due to the extensive blending of race and ethnicity in
Hawaii, many NHOPI identify with multicultural backgrounds and therefore consume foods
from a variety of cultures24,25. This unique food environment includes not only Western influence
on NHOPI diet patterns, but also influence from Japanese, Portuguese, Chinese, Filipino culture among others. This complex cultural influence results in a plethora of common foods and dishes
completely unique to Hawaii24.Therefore, it is necessary to incorporate specific food preferences
and eating habits of ethnic populations in nutrition education programs in order to improve DGA
compliance23. The incorporation of both cultural group identity and specific food customs in
health messaging for fruit and vegetable consumption is also necessary to promote pertinent and
Though data on current food consumption patterns of other Pacific Islander groups living in Hawaii is limited, it is likely that these same key considerations for effective nutrition
education programing in Native Hawaiians apply to other Pacific Islanders. The unique food culture in Hawaii, paired with the state’s highest proportion of NHOPI residents in the US, suggest that nutrition education program materials, messages, and objectives must be developed to suit food preferences and customs of NHOPI in order to promote improved compliance with
DGAs and to improve health20-25.
Social Connections to Food and Familial Decision Making
The role of family in determining food choices, the value of social learning, and collective decision-making were themes reflected in interviews and literature. A recent study exploring the cultural perceptions of Asians and Pacific Islanders with diabetes related to diet
and exercise further explored some of these concepts25. Participants in this study recalled
internalization of childhood lessons related to the importance of never wasting food and having an abundance of food available in order to not bring shame on the family. Highlighting the effect of multicultural familial genealogy on food choices, participants mentioned the wide variety of carbohydrate-heavy ethnic dishes often eaten communally during familial and holiday
celebrations. Pacific Islanders also share food to maintain and bolster familial connection and as
a means to practice reciprocity with loved ones25. The relationship between familial values and
food consumption is a necessary consideration when developing nutrition education programs for Pacific Island populations.
NHOPI also tend to value social learning and program structures that allow for the
attendance of multiple family members26,27. One interviewee spoke of how participants’
grandchildren are welcome to attend her senior nutrition education classes to help out their non-English speaking grandparents,
“It’s usually with the older generation, they usually have their child or their grandchildren with them that’s translating. So the kids are in school here and then by the time they get home, we have the senior class and the grandchildren are there translating. So it’s helpful…”
Several studies have demonstrated that health interventions tend to achieve a larger
benefit in NHOPI populations when family or close friends are also involved26,27. One study
compared the effects of a weight-loss maintenance program that included family members, and one that did not. The family intervention group could invite one friend or family member to each educational session, which focused on key areas such as family healthy goal setting, family meal planning, and familial trouble shooting of social situations involving food. The standard
intervention included the same topics, but without familial inclusion. At the end of 6 months,
participants in the family intervention were over 5 times more likely to maintain weight loss26.
desires at the risk of causing disharmony in the group. Traditionally, Hawaiian culture also tended to view Western medicine as dictatorial and conflicting with their more universal views of wellness, intertwined with spiritual and social customs. For both Hawaiians and Samoans, it is expected that sick family members will be taken care of by the family and this expectation can
result in what may be perceived by outsiders as apathy toward preventative health care28.
Research and discussions with interviewees highlight that effective nutrition education programs for NHOPI need to be designed with both the participant and participants’ family in mind. Participants are much more likely to attend classes if they can bring along friends, family
members, and/or small children27. The evidence also suggests a larger positive health impact
from interventions can be achieved when the Pacific Island value of family involvement in health and decision making is incorporated into program design. Therefore, successful nutrition
education programs serving NHOPI should be designed with the entire family in mind.
Acculturation
Another theme brought up in interviews is that Mainland EBNEP sometimes attempt to reinforce behaviors and messages that are not readily accepted by NHOPI. One interviewee, with professional experience in Mainland US and in Hawaii, described the Mainland population as
“more acculturated to Western culture.” She further explained how, in her experience, SNAP Ed
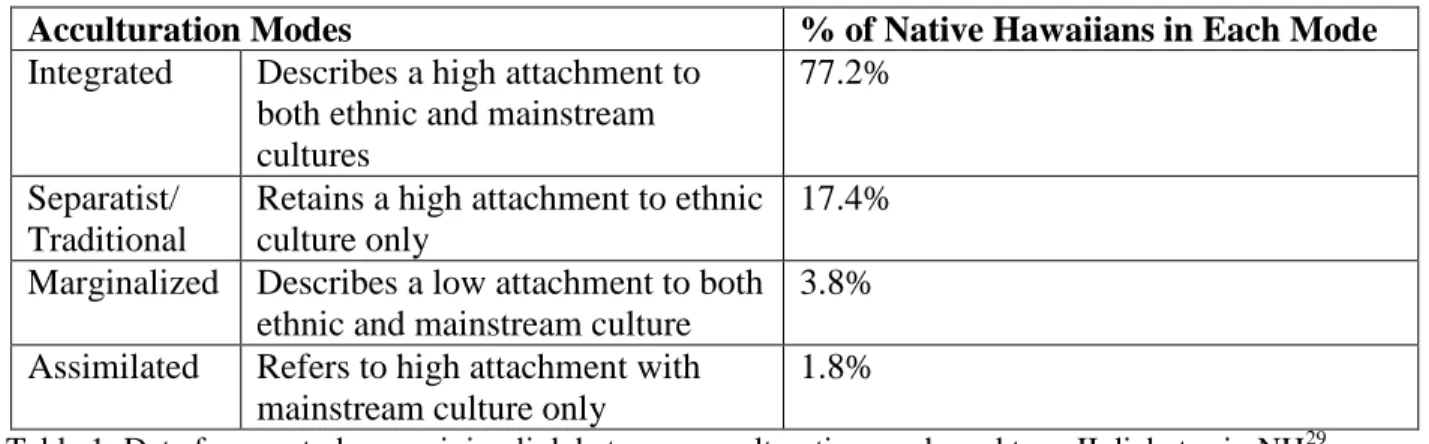
on the Mainland often serves residents who have been in the US for several generations versus more recent Pacific Island immigrants. SNAP Ed in Hawaii also serves Native Hawaiian clients who may have or may have not assimilated to Western culture. Recent research has revealed that
varying degrees of assimilation persist among Native Hawaiians (See Table 1)29.
Table 1: Data from a study examining link between acculturation mode and type II diabetes in NH29.
The authors of the above study found that Native Hawaiians in the traditional mode of
acculturation had the highest prevalence of type II diabetes29. The authors cite research with
other racial and ethnic minorities suggesting that being in traditional and marginalized modes of acculturation can lead to higher degrees of “acculturative stress”. The feelings of depression
associated with this stress might be related to type II diabetes risk30,31. Research suggests that
Native Hawaiians experiences varying modes of assimilation to Western culture and assimilation status can influence health. Therefore, the degree of assimilation to Western culture should be considered when developing effective nutrition education programs for Native Hawaiians.
Acculturation Modes % of Native Hawaiians in Each Mode
Integrated Describes a high attachment to
both ethnic and mainstream cultures
77.2%
Separatist/ Traditional
Retains a high attachment to ethnic culture only
17.4%
Marginalized Describes a low attachment to both
ethnic and mainstream culture
3.8%
Assimilated Refers to high attachment with
mainstream culture only
Other research has revealed that assimilation to Western culture is associated with weight
gain and higher BMIs among many Pacific Island immigrants to Hawaii32. One recent study
explored the relationship between obesity and acculturation among 4,455 hotel workers in Oahu,
Hawaii33. Researchers found that a higher degree of acculturation to the US was associated with
having a heavier BMI33. The authors suggested that the relationship between time in the US and
BMI could be explained, at least partially, by changes in diet33. This research might suggest that
identifying with Pacific Island culture could be more protective of health than identifying with Western culture.
Despite the strong Western influence in Hawaii, literature reveals that many NHOPI and Pacific Islanders maintain their own cultural health beliefs. One of these beliefs is related to cultural views about an appropriate healthy body weight. One study with low income NHOPI found that participants tended to think Caucasians and Europeans were supposed to be thin,
while Pacific Islanders were meant to be larger34. Other research has revealed a similar belief
persists in Native Hawaiians35.
Literature supports that the degree of assimilation to Western culture can influence body
weight, diet patterns, and health perceptions32-35. Therefore, developing comprehensive nutrition
education programs highlighting healthy aspects of NHOPI food culture for those who identify more with their Pacific Island heritage might have real health benefit. Literature and interviews also support that the incorporation of NHOPI food preferences, customs, and health beliefs into nutrition education program design could lead to wider acceptance of health messages and yield a potentially greater impact on positive health behavior change.
Nature Mediates the Connection Between People, Food, and Health
For many cultures throughout the Pacific Islands, knowledge of when and how to plant traditionally relied on ancestral knowledge related to moon phases, tide, and time divisions
within the year21. For Native Hawaiians, the health of the land is centrally connected to the
health of the people. It is through this connection to land that Hawaiians obtained the knowledge of appropriate times to obtain and produce food, such as when to plant and fish. Many plants also serve not only as sustenance, but also as medicine to treat numerous health ailments, from
diarrhea to stalled milk production in new mothers36. One contemporary study examining this
practice of la’au lapa’au, traditional Hawaiian medicinal practices, created a list of over 150
plants used by Hawaiians for healing37. Many Pacific Island cultures look to nature to inform
decisions about food production. Interviewees highlighted that nutrition education programs
from the Mainland overlook the connection between the land (āina), the people, and their health.
IV. Implementing Evidence Based Nutrition Education Programs with SNAP Ed
The SNAP Ed guidance emphasizes that states are only required to use an evidence-based
approach in all nutrition education programs, and are not required to select EBNEPs from
available databases17. The guidance describes evidence-based programs as being on a continuum.
On one end are the systematically tested, peer-reviewed research-based interventions and on the
other are the practice-based interventions with evidence of success from the field17. Therefore, an
allowable evidence-based approach can contain a combination of research-based and
practice-based nutrition education programs17. However, interviewees lamented that they lack staff and
resources to develop new programs and to evaluate existing programs to the extent required to receive funding for allowable locally-developed PBNEPs. They also cite the lack of available research-tested interventions conducted with NHOPI. Limited resources, paired with increasing pressure to use only EBNEPs, is increasingly forcing SNAP Ed and other agencies in Hawaii to select EBNEPs that have only been tested in non-NHOPI populations for use in Hawaii, or risk losing funding altogether.
When interviewees were asked about their experiences with implementing EBNEP developed in the Mainland with NHOPI in Hawaii, they described a lot of barriers to doing so. These included lack of resources, lack of fit, and limited capacity to both implement programs as intended and to adept them as needed. A recent report from the National Research Council describes common challenges to implementing evidence-based health programs in several non-mutually exclusive ways and highlights some of the same challenges Hawaii SNAP Ed experiences with Mainland EBNEP implementation. The three models of evidence based program implementation the authors discuss include adopting the evidence-based program as is, adapting the program to better suit the community, or having the community lead the
implementation of health programs altogether, including involvement program development38.
Adopting Evidence Based Programs As is
When EBNEPs are implemented in a different setting than where they were originally developed, challenges can arise. Though implementing the evidence-based program as is ensures a high level of program fidelity and increases the likelihood that the intended health outcomes will be met, the program may be a poor fit for both community resources and assets, might fail to address the same health outcomes desired by the community, and community ownership of the
program could be missing, all of which can hamper program sustainability38. In order to
implement the evidence based program successfully as intended, basic requirements include both resources and capacity at the implementing agency, ongoing support from those who created the program, and/or training from those with necessary certification to promote program “fidelity,
monitoring, supervision, and sustainability”39.
Hawaii SNAP Ed has had challenges with finding and implementing EBNEP that are an appropriate fit for available community strengths and resources, including having enough qualified staff. One interviewee stated:
resources and that kind of thing. By the time you get it down to the community, you don’t have those same kinds of skill sets and professionals to actually implement it. You’re doing it with people who really don’t know anything about the background, these theories, and are just kind of reading it off the top of their head. They don’t do it to the same degree that a professional person implementing those kinds of curriculums would.”
This statement emphasis how in their experience with EBNEP implementation, Hawaii SNAP Ed sometimes struggles to implement with fidelity due to lack of sufficient qualified staff who understand the strategies and theories behind the program. This is an example of an EBNEP being a poor fit for community resources and strengths. Further highlighting this point, as one interviewee described, challenges can arise with maintaining evidence based program fidelity due to requirements for evaluation and monitoring.
“And even more so in the areas of evaluation, we’re finding that all programs want an evaluation but it’s expensive and there’s not enough resources to pay for all that evaluation. Or to implement that evaluation on a continual basis. To make sure there is fidelity in the program, continuously… and we kind of feel like we need to have something in place all the time to keep the program on track, because they kind of fall out of it when they try to do it themselves.”
Several interviewees cited “lack of resources compared to the Mainland” as a reason for the historical lack of success with implementing EBNEP with Hawaii SNAP Ed. Interviewees mentioned that some of the EBNEP require resources and infrastructures that are not in place in Hawaii. As a result, the same intervention that may cost less in terms of resources, staff, and start up in some places in the Mainland would cost more in Hawaii. One interviewee stated:
“… if we do use an evidence based curriculum, if we tweak it in any way, it’s not considered evidence based and we have to get approval or work with the agency that developed the curriculum, and that’s not possible for every single situation. For every single community. Especially us, cause we don’t have those resources. We don’t have whole staff or even a whole person dedicated to [implementing] one strategy. It’s like one person doing ten different things.”
Adapting Evidence Based Programs
Due to the emphasis on program fidelity, implementing the evidence-based program as is can neglect often-necessary adaptions of the materials to better suit the cultural needs and
interests of the community38. Though adapting the EBNEP program to meet community needs is
beneficial because it may better fit both the communities’ capacity and desires, it can also result
in reduced impact due to core intervention component modifications38. At present, limited
evidence is available on how to successfully maintain the balance between keeping the core elements that make the evidence based program successful and adapting the program to meet
community needs38. Extensive program adaption can also be very expensive and require a lot of
of resources to adapt EBNEP to the extent that would be needed for Hawaii’s SNAP Ed eligible population. One interviewee, speaking on an attempt to adapt a specific EBNEP said:
“It’s very different in Hawaii, because the crops are different, and even like, essentially any curriculum that comes from the Mainland, in order for it to be effective in Hawaii, we have to redo the whole thing, the pictures and everything. When our population looks at people with shoes, [different kind of] clothing, even racial differences, they don’t relate to it. And the foods are really different, available crops are real different…we didn’t have the staff to redo the whole thing.”
While adapting an EBNEP for just one community can be cost prohibitive, there would be a need to tailor the curriculum for numerous multicultural communities across and within the habitable Hawaiian islands.
“It doesn’t fit for every single community cause you can see that the community of Kalihi is very different from the community of the Big Island and very different from like Waianae and Waimanalo. So that’s part of the problem.”
Adapting an EBNEP to fit community needs requires extensive time and resources. Furthermore, USDA SNAP Ed funds do not directly support the extensive adaption of EBNEP to meet community needs because once a program is adapted; it is no longer considered evidence based, but practice-based. USDA does not fund the development or evaluation of programs not
currently being used under the approved SNAP Ed Plan, as this is considered research14.
Interviews reveal that Hawaii SNAP Ed staff lack time and resources to devote to adapting EBNEP while simultaneously running the programs that are currently approved.
Community Led Program Implementation
Community led program implementation and development can lead to increased community ownership of the program, contribute to better collaboration across community sectors, result in program evaluation that is more acceptable to the community, and increase
likelihood of program sustainability38. The challenges associated with this method include more
time required to develop the program, possibility of poor impact on health outcomes, and
difficulty with the acquisition of funding to support community developed programs38. Described
below is an example of a locally developed PBNEP from Hawaii. It serves as an example of how community input into the development of the program increased community acceptance and ownership of the initiative. This PBNEP also demonstrates preliminary evidence of success toward achieving intended health outcomes.
Example: Project Zest
to Hawaii from another country in or after 1990 and 95.4% of the residents identifying as
nonwhite (vs. Hawaii state average of 6%, 73.4%, respectively) 18,27,40. The second-highest
population of NHOPI in Hawaii resides in this neighborhood and over half of residents (54.6%)
report speaking a non-English language in their households40. Compared to the rest of the state,
residents in this neighborhood have lower per capita incomes, higher unemployment rates, own
fewer homes, and receive more federal benefits, including SNAP and welfare40. Farrington
contains a neighborhood that is one of two priority areas in Hawaii’s SNAP Ed Plan41.
KPHC’s Project Zest was designed specifically for multiethnic populations who qualified
for federal food benefit programs27, and streamlined nutrition education and core messages in all
of KPHC’s programs and activities in health promotion and disease prevention. The goals of Project Zest were to make participants more accustomed to local fruits and vegetables, improve their KSA and self-efficacy to make healthier meals, and to ultimately increase their F/V intake27.
KPHC developed the program using input from community members, which led to the creation of the key message “Eat the Rainbow”, which, formative research revealed, was received successfully by target population. Further formative research conducted with the target population suggested most people were in early stages of behavior change, and the program sought to move participants from pre-contemplation to contemplation or action stages for dietary behaviors. KPHC developed the curriculum to target specific constructs of the Transtheoretical Model and Social Cognitive Theory (self-efficacy, KSA, social support), as they determined
these theories best fit their goals for behavior change in the target population27.
The first component of Project Zest was a cohesive set of lessons designed to be integrated into existing KPHC health promotion programs, called nutrition education modules (NEMs). The next component was the Community Food and Fitness Modules (CFFM) that were designed to be used in community outreach at other health centers, agencies, and housing projects. CFFM were also designed for use with elementary age children. Project Zest also established both a community advisory board and a provider stakeholder board to inform project
development, implementation, and evaluation27.
Project Zest was well designed to address multiple barriers and challenges that often arose when attempts were made to implement Mainland EBNEP. In order to effectively convey key nutrition education messages to a target population with varying levels of literacy and English proficiency, highly visual and hands-on methods of learning were used. PowerPoint presentations contained key messages paired with pictures of typical meals for NHOPI and common produce found in Hawaii. All classes had cooking demonstrations in which participants could taste test healthy adaptions of familiar foods. These healthy recipes were also taste tasted by the community advisory board established for the project and eventually developed into
professionally designed and easy-to-follow recipe cards27.
education/conversation with dietitian, which many participants felt was tantamount to their program participation. To address language barriers to nutrition education, staff translators
attended classes and program materialswere translated into multiple languages. To reach those
in very early stages of behavior change that were not quite ready to commit to nutrition education, key messages were provided in brochure form and widely distributed in clinics and
community outreach events27.
Project Zest also addressed key barriers to nutrition education program attendance often faced by low-income participants (i.e., lack of transportation, limited time due to family/work duties) by allowing flexibility in program attendance. Classes were designed as a “repeating series of connected units” which incentivized total attendance instead of the attendance of all classes in a particular sequence. Qualitative evaluations, suitable to the community being evaluated, suggested that the program was successful in achieving program objectives and was
very well received by the community27.
Although the project did an excellent job of addressing key barriers and serving a unique population effectively, there was room for improvement. Results from the qualitative evaluation suggested program restructuring might be needed to increase contact hours. As staff became busy with preparing food for demonstrations, they had less time to mingle with participants, which was very important for participant satisfaction and reinforcement of key messages. More training was needed so that staff could effectively and appropriately deliver the program to multiethnic low literacy populations; when students tried to deliver the main PowerPoint presentations, clients tend to appeared confused and uninterested. Slowly the three staff that pioneered the creation of the program have dwindled to one, and shrinking financial resources
currently challenge program sustainability27.
Project Zest highlights the ability of Hawaii’s public health leaders to work with a diverse community to develop an effective PBNEP for SNAP Ed. Unfortunately, limited funding and staff to support the continued development and evaluation of this program presently hamper its future growth and potential for success as an effective PBNEP. Though Project Zest development was partially funded by SNAP Ed, this was before the new evidence-based requirements became mandatory and current funding does not support further project development. Unfortunately, this limits Hawaii SNAP Ed’s ability to deliver a culturally appropriate nutrition education program with demonstrated success in a NHOPI population in a neighborhood of high need. SNAP Ed currently funds the community outreach aspects of Project Zest, but not the direct nutrition education components provided by the NEMs41. In order for Project Zest to receive full approval as a PBNEP, and to use their locally developed curriculum, more evaluation, documentation, and changes in program structure are needed, but these changes are presently not possibly with available resources. This tension between limited resources and strict requirements for SNAP Ed puts the implementing agencies in a difficult place. This pressure increases the likelihood that agencies are forced to select mainland EBNEPs to cut costs, and limit plans to develop their own PBNEPs, which though they are likely more effective in their population, are also not funded. One interviewee stated simply,
Leveraging Existing Resources: Freedom within Constraints
The new SNAP Ed requirements call for states to use an evidence based approach and/or EBNEPs as much as possible while also pairing direct nutrition education with environmental
level supports to healthy eating and physical activity17. Though Hawaii SNAP Ed has faced
challenges with implementing and adapting Mainland EBNEPs, and with receiving adequate funding to use their own locally developed PBNEPs, they have managed to be successful in other ways. For example, one SNAP Ed implementing agency has been able to use data from another federal nutrition education program, the Expanded Food and Nutrition Education Program (EFNEP), to demonstrate success with locally developed PBNEP in low income populations. This has allowed them to receive approval for all of their nutrition education programs, based on evidence that their programs are locally effective. In another triumphant example of success, after the USDA refused to fund one locally developed and widely accepted PBNEP, because the curriculum was not “evidence-based”, a community organization stepped up and paid for the program to continue.
Coalitions have also been formed with community agencies and organizations to leverage available resources and spend increasingly limited funds in ways that are both impactful and important to the community. Describing a specific coalition, one interviewee stated:
“That group is highly is highly vested and they do have a lot of interest. And they pull whatever resources they have to make more things happen. Even when you see [one particular community agency], I mean, they can’t add anymore because they’re stretched thin, but you know when we meet, that little bit of synergy propels the work a little bit further.”
V. Discussion & Summary
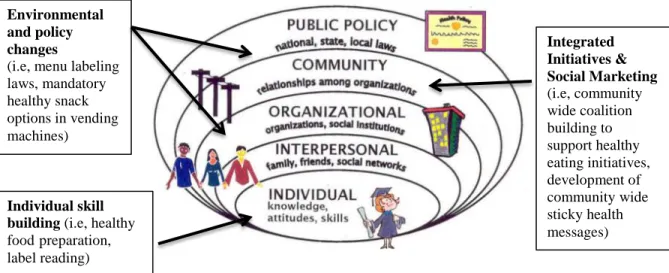
Nutrition education can be an effective way to provide low-income populations with knowledge and skills to improve healthy behaviors within the constraints of limited resources. There are three key requirements for the effectiveness of nutrition education and promotion that
work within the social ecological model (see Figure 7)15,42,43. The first step in effective nutrition
education is relevant skill building to promote positive changes in dietary behavior.
Environmental and policy changes that support healthy eating are critical for encouraging the use of these behaviors. Finally, both “integrated initiatives” and social marketing are needed to
increase community acceptance and support of healthy dietary behaciors15. 2015 FY Guidance
for SNAP Ed requires states to incorporate these components into the development of
comprehensive state SNAP Ed plans17. Databases have been developed that contain many
Figure 7: Interaction of comprehensive nutrition education approach with social ecological model, with examples12. The social ecological model is an important tool for understanding the levels of influence exerted on an individual’s health behavior by his environment42,43
.
In an example of unsuccessful EBNEP implementation found in the literature, Hip Hop to
Health Jr, a research-based health program, was proven to be effective at reducing weight gain
in a population of black children, but not Latino children. Reasons authors cited for the null results was the lack of attention paid to parental involvement with “less-acculturated” Latino
Parents and lack of consideration of Latino body image preferences and food preferences44.
These are also key population differences between NHOPI and whites as revealed by interviews with SNAP Ed implementing agency staff in Hawaii and secondary data. Failure to account for and develop EBNEP to suit culturally distinct NHOPI populations could result in an inability to achieve desired health outcomes, at a time when they need them the most. NHOPI are one of the most disadvantaged groups in Hawaii, with poorer health outcomes and increased chronic
disease mortality2. Furthermore, program adaption of existing EBNEP can be cost and time
prohibitive to resource-poor agencies serving diverse populations in Hawaii.
Examples exist in Hawaii highlighting the possibility of relying on local knowledge and experiences to develop EBNEP that are more appropriate for NHOPI needs. However, current funding for many grants and SNAP Ed is contingent on the use of an evidence-based approach, which means limited resource and culturally unique areas like Hawaii must select EBNEPs from the Mainland. These requirements can hamper local development of PBNEPs in Hawaii and the risk of losing funding undermines existing community efforts that could potentially be more effective. Hawaii’s programs support and encourage the population differences that make
NHOPI so unique and support the achievement of health outcomes important to the communities they serve. One nutrition educator spoke about how she knows what she teaches is affecting change in her community:
“They always come up to me if I see them, in the grocery store. They’re like “look at my wagon, look at my wagon, I’m eating healthy!”…so you can see it,
Individual skill building (i.e, healthy foodpreparation, label reading)
Environmental and policy changes
(i.e, menu labeling laws, mandatory healthy snack options in vending machines)
Integrated Initiatives & Social Marketing
whenever I see them they’re face lights up. They’re happy to see me, not dodging me in the aisle like, “I have all this junk food in my cart”. So I know that it’s hitting them and that they’re observing everything so it’s good.”
This paper has several strengths and limitations to be considered. One strength of this work is the fresh approach to integrating challenges to implementing EBNEP as gleaned from interviews with SNAP Ed staff in Hawaii, secondary data and existing literature. Limitations include the limited timeline for writing this paper that prevented conducting both more interviews and more in-depth interviews with the selected interviewees. The assertions in this paper are based on interviews with 4 staff members in SNAP Ed implementing agencies in Hawaii. This, combined with limited published research available on Pacific Islanders in Hawaii makes it difficult to develop specific evidence-based recommendations for NHOPI nutrition education programs within this paper.
More research related to acculturation and food customs and preferences in Pacific Island populations is needed as well as more research in understanding the experience of NHOPI who participate in SNAP Ed programs in Hawaii and their suggestions for improvement. More research is also needed in the area of EBNEP cultural adaption. At present, limited evidence exists to determine the key ways in which the EBNEP must be adapted to fit a population’s needs while maintaining the key components that are necessary for effectiveness. Also, more collaboration is needed with national agencies and local organizations to increase the availability of PBENP developed in NHOPI and other ethnic groups for dissemination in nationwide
databases.
References
1. Native Hawaiian & Other Pacific Islander: CDC Website.
http://www.cdc.gov/minorityhealth/populations/REMP/nhopi.html. Updated on July 2, 2013. Retrieved on November 5, 2014.
2. Healthcare Association of Hawaii. State of Hawaii Community Health Needs Assessment.
July 13, 2013.
3. State of Hawaii Data Book: Hawaii government website.
http://dbedt.Hawaii.gov/economic/databook/2013-individual/_01/. Retrieved on October 25, 2014.
4. Cost of Living Data Series Second Quarter 2014: Missouri Economic Research and
Information Center website. http://www.missourieconomy.org/indicators/cost_of_living/. Retrieved on October 26, 2014.
5. Consumer Price Index: Bureau of Labor Statistics Website: http://www.bls.gov/cpi/.
Retrieved on November 25, 2014.
6. Coleman-Jensen A, Gregory C, and Singh A. Household Food Security in the US in 2013.
Economic Research Service. 173. September 2014.
7. Disparities Dashboard: Hawaii Health Matters Website.
http://www.Hawaiihealthmatters.org/modules.php?op=modload&name=NS-Indicator&file=index&topic=0&topic1=State&topic2=Hawaii&breakout=100®name=em pty
8. Liping P, Sherry B, Njai R, Blanck H. Food Insecurity is Associated with Obesity among US
Adults in 12 states. Academy of Nutrition and Dietetics, 2012; Published online: doi:
10.1016/j.jand.2012.06.011 Accessed on November 5, 2014.
9. Overweight and Obesity: CDC Website. http://www.cdc.gov/obesity/adult/causes/index.html.
Updated April 27, 2012. Retrieved on November 11, 2014.
10.Seligman H, Laraia B, Kushel M. Food Insecurity is Associated with Chronic Disease among
Low-Income NHANES Participants. J Nutr; 2010; 140 (2): 304-310.
11.American Cancer Society, Cancer Research Center of Hawaii, Hawaii Department of Health.
Hawaii Cancer Facts and Figures 2010. Published September 2010.
12.Agency for Healthcare Research and Quality. National Healthcare Disparities Report, 2013.
Chapter 2: Effectiveness of Care for Common Clinical Conditions.
13.Supplemental Nutrition Assistance Program: USDA website.
http://www.fns.usda.gov/snap/supplemental-nutrition-assistance-program-snap. Updated August 20, 2014. Accessed October 24, 2014.
14.Characteristics of SNAP households, FY 2011: USDA website.
http://www.fns.usda.gov/characteristics-supplemental-nutrition-assistance-program-households-fiscal-year-2011. Published July 2013. Retrieved on November 4, 2014
15.Food and Nutrition Service. Nutrition Education and Promotion: The role of FNS in helping
low-income families make healthier eating and lifestyle choices: A report to congress. March 2010.
16.Center for Disease Control and Preventions MMWR. CDC Health Disparities and
Inequalities Report—US, 2013. Morbidity and Mortality Weekly Report. 2013; 62(3).
17.Supplemental Nutrition Assistance Program Education Guide: Nutrition Education and
18.State and County Quick Facts Hawaii: US Census Bureau website.
http://quickfacts.census.gov/qfd/states/15000.html. Updated July 8, 2014. Retrieved November 8, 2014.
19.Harris P and Jones N. US Census Bureau: Census 2000 Special Reports. We the People:
Pacific Islanders in the US. Aug 2005; CENSR-26.
20.Fujita R, Braun K, and Hughes C. The traditional Hawaiian diet: a review of the literature.
Pacific Health Dialogue 2004: 11(2): 250-259.
21.Secretariat of the Pacific Community. The Staples We Eat. Noumea, New Caledonia: 1999.
22.Kim SH, Park S, Grandinetti A, Holck P, Waslien C. Major dietary patterns, ethnicity, and
prevalence of type 2 diabetes in rural Hawaiian. Nutrition. 2008; 24: 1065-1072.
23.Sharma S, Sheehy T, Kolonel L. Sources of vegetables, fruits and vitamins A, C and E
among 5 ethnic groups: Results from a multiethnic cohort study. Eur J Clin Nutr. 2014; 68
(3): 384-391.
24.Hiura, A. Kau Kau: Cuisine & Culture in the Hawaiian Islands. Honolul, HI: Watermark
Publishing; 2009.
25.Braginsky N, Inouye J, Wang CY, et. al. Perceptions Related to Diet and Exercise Among
Asian and Pacific Islanders with Diabetes. Hawaii Medical Journal, 2011. 70: 196-199.
26.Kaholokula J. A Family and Community Focused Lifestyle Progam Prevents Weight Regain
in Pacific Islanders: A Pilot Randomized Control Trial. Health Education Behavior, 2012; 39
Published oniline: DOI: 10.1177/1090198110394174
27.Buchthal,V. KPHC Center Project Zest Evaluation Report for FFY2010.
28.McLaughlin L and Braun K. Asian and Pacific Islander Cultural Values: Considerations for
Health Care Decision Making. Health Social Work, 1998; 23(2): 116-126.
29.Kaholokula J, Grandinetti A, Nacapoy A, Chang, H. Association between acculturation mode
and type 2 diabetes among native Hawaiians. Diabetes Care; 2008. 31: 698-700.
Overweight and Obesity: CDC Website.
30.Zheng X, Sang D, Wang L: Acculturation and subjective well-being of Chinese students in
Australia. J Happiness Stud 2004. 5:57– 72,
31.Knol M, Twisk J, Beckman A, Heine R, Snoek F, Pouwer F. Depression as a risk factor for
the onset of type 2 diabetes mellitus: a meta-analysis. Diabetologia. 2006;49:837– 45.
32.Davis, J et. al. The relationship between ethnicity and obesity in Asian and Pacific Island
populations: a literature review. Ethnic Disease. 2004; 14: 111-118.
33.Novotny R et, al. US Acculturation, Food Intake, and Obesity among Asian-Pacific Hotel
Workers. Journal of American Dietetic Association. 2009; 109” 1712-1718.
34.Wang, CH. Ideal Body Image and Health Status in Low income pacific Islanders. Journal of
Cultural Diversity. 2002; 9(1): 12-22.
35.Chang HK, Grandinetti A, Lan G, Rodriguez BL, Melish JS, Curb JD. Cross-cultural
comparisons of ideal body type among a multiethnic multiethnic population in Hawaii. Diabetes. 2000; 49(suppl 1): A182.
36.Aluli N and McGregor D. ‘Aina: Ke Ola O Na Kanaka ‘Oiwi, Land: The Health of Native
Hawaiians. In Press, Honolulu: UH Press.
37.Judd N. Laau Lapaau: herbal healing among contemporary Hawaiian healers.Pacific Health
Dialog 1998; 5(2): 239-245.
38.O’Connell M. Preventing Mental, Emotional, and Behavioral Disorders Among Young
39.O’Connell M. Preventing Mental, Emotional, and Behavioral Disorders Among Young People: Progress and Possibilities. National Research Council and Institute of Medicine. National Academies Press, Washington, D.C. 2009.
40.Farrington Area Community Profile: University of Hawaii at Manoa, Center on the Family.
Published November 2003. Retrieved online October 1, 2014.
41.Hawaii SNAP Ed Plan FY 2014.
42.The Social Ecological Model: CDC Website: http://www.cdc.gov/cancer/crccp/sem.htm.
43.SEM image retrieved from:
http://www.balancedweightmanagement.com/TheSocio-EcologicalModel.htm.Accessed December 1, 2014.
44.Fitzgibbon M, et al. Hip Hop to Health Jr for Latino Preschool Children. Obesity, 2006;