1
Evaluating sampling techniques for measuring
ghost crab (
Ocypode quadrata
) burrow density
I. Introduction
Sandy beach ecosystems are boundaries between land and sea and operate as critical components of larger, dynamic coastal systems. Beaches facilitate nutrient and sediment exchange, are shaped by impact of wind and waves, and are habitat for terrestrial and marine organisms (Defeo et al., 2009; Schlacher, et al., 2007). A wide variety of human activities threaten beach ecosystems: intense recreation such as trampling and off-road vehicle use; physical manipulation for resources, navigation, and land or ocean access; pollution of the beach face or waterways; and climate change impacts such as rapid rise in sea level and altered weather patterns (Brown and McLachlan, 2002; Defeo et al., 2009). Thus, beaches are sites of a familiar conflict between human use and conservation of ecosystem function, composition, and structure. Management of natural resources and ecosystems aims to address this conflict by balancing goals of human use with the preservation of ecological services (James, 2000; Schlacher et al., 2008).
Management of beach ecosystems requires tools for monitoring beach ecology. One metric that has been proposed and used as an indicator of anthropogenic influences on beaches is the relative density of ghost crab (Ocypode spp.) populations (Hill and Hunter, 1973; Schlacher, 2011). Ghost crabs inhabit tropical and subtropical beaches around the world and are top
predators on the beach (Wolcott, 1988). The Atlantic ghost crab, Ocypode quadrata, inhabits ocean beaches as far north as Rhode Island and as far south as Rio Grande do Sul, Brazil (Wolcott, 1988). Ghost crabs create burrows in the beach sand in the intertidal and supratidal zones, then leave the burrows to feed at night (Williams, 1984). Burrows are open tunnels into the sand that range in depth from 0.6 to 1.2 meters and have been found up to 0.25 miles inland from the high tide line (Williams, 1984). Burrow openings are visible from the beach face (i.e. visible to a pedestrian) as holes in the sand with openings of diameter corresponding to the width of the crab carapace, which can be up to 5.0 cm for adult males (Williams, 1984) (Figure 1). Burrow diameter and crab carapace width typically increase moving from the swash toward the dune because juvenile crabs tend to burrow near the swash in order to avoid predation and desiccation of the dry sand beach (Valero-Pacheco et al., 2007). Burrows with recent activity Figure 1: Ghost crab burrow on
2
are most readily distinguished by a pile of sand outside of the burrow, tracks in the sand leading to or from the burrow, or a sighting of a ghost crab darting into or out of the burrow (Pombo and Turra, 2013). Ghost crab burrows are particularly useful as an indicator because they are comparable across a large geographic range, the species plays a top role in the beach food chain, and burrows are relatively easy to see and count from the beach face.
The relative population densities of ghost crabs on beaches fluctuates predictably with human influences including beachgoer activities (Steiner and Leatherman, 1981; Lucrezi et al., 2009a; Barros, 2001), sand displacement (Jonah et al., 2014), large-scale sand additions (Dolan et al., 2004), and beach driving (Hobbs et al., 2008). A meta-analysis by Schlacher et al. (2016) presents a culmination of studies assessing ghost crabs as an indicator of human impacts on beaches and concludes that ghost crabs represent “a powerful model organism for detection of ecological impacts in warm-temperate to tropical coastal systems”.
The method used most frequently as a proxy measurement of ghost crab abundance is counting burrow openings over a defined beach area (Schlacher et al., 2015). However, burrow density is not a direct measure of population and confounding factors may skew population estimates derived from measuring burrow density (Pombo et al., 2013; Silva and Calado, 2013). Nevertheless, burrow counting is used as a low cost option for estimating ghost crab
abundance and distribution. In published research, burrows are typically counted along transects from the dune to the swash of a beach area (Hobbs et al. 2008; Jonah et al., 2015; , Keeton et al., 2013; Lucrezi et al., 2009a; Pombo and Turra, 2013; Schlacher et al., 2011). The term transect in beach sampling is used to refer to a line that runs perpendicular to the shoreline, from which sampling area is systematically or randomly arranged (Schlacher et al., 2008). Using this technique, ecological research has explored the link between ghost crab populations and human influence. As discussed, this link offers ghost crab population density as one indicator metric for management programs.
Methods for measuring ghost crab burrow density vary across the literature. In published ecological research, a common technique is to count the number of burrows present along a transect in a narrow area of beach running from the dune to the intertidal zone, called a Belt Transect (Keeton et al., 2013; Barros, 2001; Lucrezi, 2015; Schlacher, 2011; Noriega et al. 2010; Lucrezi, 2009; Moss and McPhee, 2006; Jonah et al., 2015). The area captured by the Belt Transect method is site-specific, because it typically varies with the width of the beach. However, the full Belt Transect method may be time-consuming if ghost crab measurement is just one metric in a beach monitoring program spanning large areas or time scales. For
3
sampling transect (D. Stewart, pers. comm., Sept. 2015; Dr. R. Corbett, pers. comm., Apr. 2017). (USFWS uses the term “transect” to define their replicated locations of sampling at fixed
intervals along the beach on Pea Island, which differs from the “Belt Transect” defined more narrowly above.) Several ecological studies have also employed this method, using quadrats to capture a fixed area of beach face to sample burrow abundance and density (Valero-Pacheco et al., 2007; Maia-Carneiro et al., 2013).
Through field sampling, this study compares the ghost crab burrow densities acquired using a Fixed-Area sampling method to those measured using the Belt Transect method
commonly used in ecological research. The two methods differ in area sampled per study site as well as distribution of area sampled along the beach, from dune to swash. I assess key
differences between the two methods, how those differences influence the data each method captures, and the implications for management and monitoring programs.
II. Methods
II.i. Study Sites
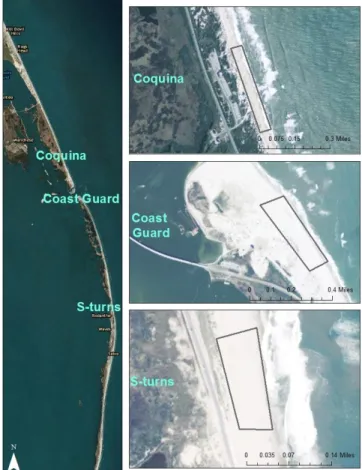
Ghost crab population density was sampled at three sandy ocean beach sites on the Outer Banks, North Carolina between Nags Head and Rodanthe (Figures 2 and 3). The Outer
4
Banks consists of a series of narrow, sandy islands and peninsulas that divide the Atlantic Ocean and the Albemarle-Pamlico Sound. The
Outer Banks are extremely dynamic
geographic features, impacted by “gradually rising sea level, a surplus of sand supplied to the coast, and waves large enough and winds strong enough to move the sand” (Dolan and Lins, 2000). Nonetheless, the Outer Banks have been developed and engineered to attempt to resist natural land migration: a line of manmade dunes and Highway 12 run along the Outer Banks parallel to the shoreline. Two of the sites (Coast Guard and S-turns) are located on Pea Island National Wildlife Refuge (PINWR) and the third site (Coquina) is just north of PINWR on the Cape Hatteras National Seashore. While ghost crabs can inhabit the entire sandy beach, from the ocean to the Sound, sampling was restricted to between the swash (where waves are actively crashing onto the beach) and the dune line (where the seaward side of the dune begins) of the ocean beach.
The three study sites – Coquina Beach, Coast Guard, and S-turns (Figures 2 and 3) – were chosen based on accessibility and to sample a range of beach management regimes and topography. All sites have experienced some degree of human disturbance due to pedestrian use and/or human engineering, though the use of off-road vehicles is not permitted at any of the three sites (National Park Service, 2016).
Coquina Beach (35.832 N, 75.557 W) is the northern-most site, located north of Pea Island and Oregon Inlet. There is a public beach access from the highway and a nearby
campground proximal to this site, which results in heavy use by beach-goers during the tourist season (approximately May through September).
The Coast Guard site (35.770 N, 75.522 W) is located south of Oregon Inlet, bordered on the north by the inlet’s terminal groin. An abandoned Coast Guard building lies west (or inland) of the sandy beach. Since 1990, material from dredging Oregon Inlet has been periodically placed on the beach in this area (Dolan et al., 2004). Both the sandy beach width and the
5
approximate dune width at the Coast Guard site are wider than the other two study sites (Table 1). We observed interdunal sand flats inhabited by ghost crabs past the dune line.
S-turns (35.617 N, 75.467 W) is the southern-most site, located just north of Rodanthe, NC. This span of beach was the site of a beach nourishment project in 2014 (Walker, 2014). The nourishment project involved pumping sand from offshore to the beach in order to maintain beach width. S-turns was sampled approximately one mile north of Rodanthe. This beach site is frequented by surfers and can be accessed from Rodanthe or from Highway 12, but there is no official public access across the dunes leading directly to the site, which limits pedestrian impacts on the beach site.
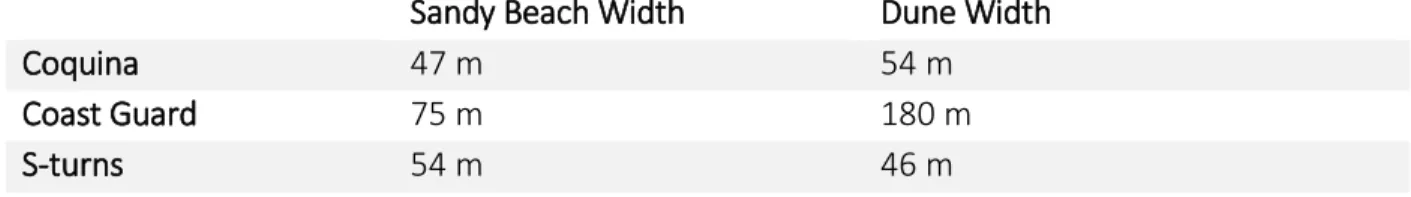
Table 1: Study site width characteristics. Sandy Beach Width is the length from highest high tide line to
the dune line of the beach, measured and averaged from three sampling dates. Dune width was estimated from the measurement tool in Google Earth using satellite imagery of the study sites.
Sandy Beach Width Dune Width
Coquina 47 m 54 m
Coast Guard 75 m 180 m
S-turns 54 m 46 m
II.ii. Sampling Methods
Ghost crab density was sampled at all sites on six sampling dates: October 9th, 2015; October 19th, 2015; April 16th, 2016; May 12th, 2016; July 14th, 2016; and October 5th, 2016. On
October 19th, 2016 and April 16th, 2016, burrows were not present on the beach sites, and on
October 5th, 2016, high winds due to incoming Hurricane Hermine made it difficult to
distinguish burrows. Sampling was conducted in the morning hours to minimize interference from human activity or environmental conditions that collapse or cover burrows. The sampling team was careful not to step on crab burrows while in the field to avoid covering or otherwise disturbing burrows.
6
estimates of beach width for each site (Table 1, above). The width of the sandy beach depends on sedimentation and erosion processes and tidal influences, which can vary on a daily and seasonal basis (Dolan and Lins, 2000). Since the Outer Banks are dynamic geographic features, beach width varies by location and over time.
For one sampling area at the Coast Guard site on May 16th, 2016, the sampling team
measured the time it took to sample using the Belt Transect method and the Fixed-Area method, separately, in order to estimate the time cost of each method.
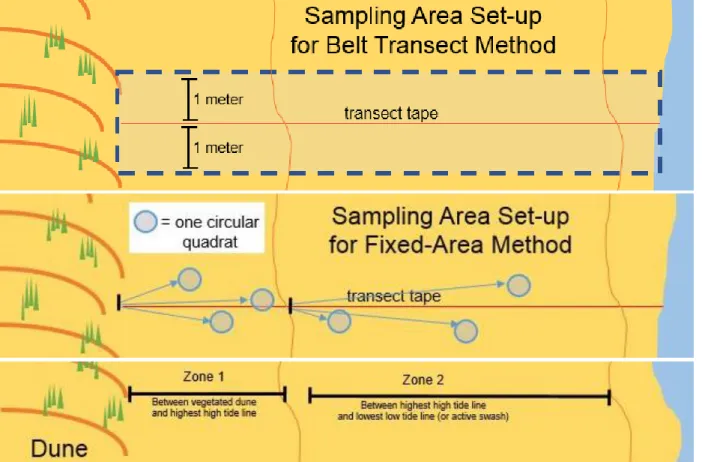
II.ii.a. Belt Transect Method
The sampling team recorded each ghost crab burrow found along 2 meter wide Belt Transects running perpendicular to the ocean and dune line (Figure 4). For each burrow along the Belt Transect (within 1 meter of either side of the transect tape), the distance from dune, activity level, and diameter was recorded. The distance (estimated to the nearest 0.05 meter) from the vegetated dune line was measured using a transect tape. Burrows were assigned an activity level on a scale from 1 to 4, with a rating of four being most active burrow with at least two of the following: ghost crab tracks, evidence of recent digging such as a sand pile, or
7
sighting of a crab (Figure 1). A burrow activity level of one would reflect a burrow with no signs of ghost crab activity. This activity level scale was adapted from the system used by Pombo and Turra (2013). Diameter (estimated to the nearest 0.5 cm) was measured as the widest point of the burrow at the sand surface. The sampling team exercised extra precaution to not trample any burrows during the Belt Transect sampling in order to avoid impacting the Fixed-Area sampling. Nevertheless, it is possible that the order of sampling (Belt Transect, then Fixed-Area) impacted the results of sampling. This possible confounding factor of trampling in the Fixed-Area sampling is discussed in the Results and Discussion section below.
II.ii.b.Fixed-Area Method
After measuring burrows along the Belt Transect, the sampling team used a circular quadrat (.6 m diameter, 0.28 m2 area) to sample within each Zone (1 or 2). First, a team
member stood at the start of Zone 1 (at the vegetated dune line) and threw the quadrat at the direction of the water so that the quadrat landed on the sandy beach within the zone being sampled. This was repeated three times in Zone 1 and then three times in Zone 2 (Figure 4). After each throw, the sampling team recorded each burrow found within the quadrat. For each burrow located within the quadrat boundary, the diameter, distance from dune line, and activity level was recorded. If no burrows were found within the quadrat for one throw, a zero was recorded for that throw. The measurements of crab burrows were all taken in the same manner as with the Belt Transect method.
This Fixed-Area sampling method (using a quadrat) was adopted from the sampling technique of USFWS on PINWR. For long-term data collection, the USFWS seasonally samples ghost crab population using a Fixed-Area method. A USFWS team member throws a Fixed-Area sampling tool such as a hula hoop (circular quadrat) or square quadrat from the vegetated dune line three times in each of their sampling areas. This study utilizes a modified version of USFWS sampling on PINWR because the Fixed-Area sampling is conducted from the start of Zone 1 (at the dune line) as well as at the start of Zone 2 (the highest high tide line). USFWS does not collect ghost crab burrow data in this middle region (into Zone 2) of the beach because higher ghost crab burrow densities are found closer to the dune (Barros, 2001; Valero-Pacheco et. al, 2007). (D. Stewart, personal communication, September 2015).
II.iii. Analysis
8
two-tailed T-tests to compare densities between the Belt Transect method and the Fixed-Area method, with alpha level of 0.05 to designate significance. ANOVA tests were performed to determine whether burrow density differed significantly across study sites and sampling dates when differentiated by method and by zone (eight total ANOVA cases). Additional ANOVA tests were performed with the different zone densities among the study sites and among the
sampling dates (eight additional ANOVA cases) in order to test for zone-dependent differences in burrow density sampled by the two methods across sampling date and study site.
In order to determine trends in distribution across the width of the beach, the distance from the dune of each burrow measured (for both methods) was normalized to the length of the sampling area that it was measured in. Length of sampling area differed by beach width, so this normalization produced a value for each burrow that reflects the portion of beach width (specific to each sampling are) in which it was sampled. Since the 0 meter mark was positioned at the dune, a value of 0-.1 represents a burrow found in the first tenth of a transect (nearest to the dune) and a value of 0.9-1.0 represents a burrow found in the final tenth of a transect (nearest to the swash). A linear regression was applied to the datasets of these normalized length values for each method, Belt Transect and Fixed-Area. The linear equations and correlation coefficient of R2 were calculated in Microsoft Excel to determine trends in
distribution of burrows across the width of the beach.
III. Results and Discussion
III.i. Trends in Burrow Density
In total, the sampling team recorded 69 ghost crab burrows from 57.1 m2 of area
sampled with the Fixed-Area method, and 2,004 ghost crab burrows from 3238.4 m2 with the
Belt Transect method (total area sampled does not include sampling on dates with zero
burrows counted). Active ghost crab burrows were observed across the entire beach face (from the upper swash to the dunes, and spanning into the dune past our sampling area) at each of the three beach study sites.
Burrows were present on the beach in October 9th, 2015, and May 12th, July 14th, and
October 5th in 2016. The October 19th, 2016 sampling was not analyzed because, due to
Hurricane Hermine, only the Coquina site could be sampled and wind conditions made
identifying burrows difficult. No evidence of burrows was found during the attempted sampling dates in October 19th, 2015 and April 16th, 2016, which is indicative of a typical hibernation
season in colder months when crabs are not actively leaving or maintaining burrows (Hobbs et al 2008; Leber 1982). Over the five sampling dates, burrow density was highest in October 9th,
2015 and lowest in July 14th, 2016, excluding the two sampling dates when zero burrows were
9
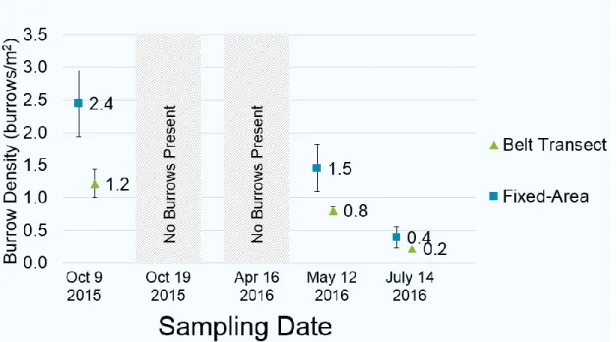
Figure 5: Mean ghost crab burrow densities (burrow/m2) for each sampling date, differentiated by method used (Fixed-Area or Belt Transect). No burrows were present on two sampling dates, which reflects the winter hibernation of ghost crabs. Burrow density was lower in May and July, and was highest in the October sampling, which is consistent with general patterns in ghost crab population reported in other studies, though the drop in burrow density measured from May to July, 2016 is not an expected trend based on other studies. Nevertheless, the overall trend across sampling dates was consistent between the two methods. Error bars represent standard error.
Figure 6: Mean ghost crab burrow densities (burrows per m2) for each study site, differentiated by method used (Fixed-Area or Belt Transect). Burrow densities from lowest-to-highest were: Coast Guard, Coquina, S-turns. This pattern among sites relates inversely to the approximate dune width (Table 1), supporting the hypothesis that beach sites with more dune habitat for ghost crab burrows will have lower burrow density between the dune line and the swash. Both methods reflect the same qualitative pattern in burrow density among sites. Error bars represent standard errors.
0.5
0.8
1.0 0.8
1.5
2.0
-0.2 0.3 0.8 1.3 1.8 2.3 2.8
B
urr
ow
Dens
ity
(
bu
rr
ow
s
/m
2)
Belt Transect
Fixed-Area
Beach Study Site
10
The trend in burrow density over all sampling dates may reflect a seasonal abundance pattern in ghost crab population. With bi-monthly abundance data, Leber (1982) found a
seasonal pattern of abundance from May to October with lower abundance May through July, a peak in August, and a steep decrease in October in Bogue Banks, NC. Wolcott (1978) found a similar seasonal pattern at Fort Macon in Carteret County, NC. Ghost crab activity and burrow presence seasonality is thought to be influenced by temperature, abundance of prey species, and cycles of spawning and recruitment (Leber, 1982). Our sampling reflects the trend of high abundance in late-summer into fall months and a lower abundance during late-spring and summer (Figure 6) and absence from late fall (October 19th, 2015) through early spring (April
16th, 2016). However, the low burrow density found on July 14th, 2014 has not been observed in
previous studies and may have resulted from high temperatures, which can reduce ghost crab activity or cause ghost crabs to plug their burrows with sand in order to retain cooler
temperature and moisture (Lucrezi and Schlacher, 2014; Williams, 1984). The maximum temperature tolerated by ghost crabs has been reported to be between 28 and 34 °C (Lucrezi and Schlacher, 2014). The July 14th, 2016 sampling had the highest air temperature out of the
sampling dates, with an average air temperature of 29 °C and a maximum daily air temperature of 31 °C (Appendix Table A).
Burrow density across all sampling areas for the Fixed-Area method was 1.5
burrows/m2, with individual sampling area burrow densities ranging from 0.0 – 4.8 burrows/m2
across 27 total sampling areas. For the Belt Transect method, burrow density was 0.64
burrows/m2 across the entire study area, with individual sampling area densities ranging from
0.094 – 2.4 burrows/m2. These measured densities are largely consistent with the range of
ghost crab burrow density values reported in similar studies near or on the study sites, though two studies in Cape Coast and Elmina beaches in Ghana reported burrow densities ranging as high as 15.1-44.0 (Jonah et al., 2015) and 94.3 (Aheto et al., 2011) (Table 2).
Studies have linked lower ghost crab burrow density to human impact: pedestrians (Neves and Bemvenuti 2004; Noriega et al 2012; Barros 2001), vehicle use (Wolcott and
Wolcott 1984), and large-scale sand movement (Jonah et al 2014). This study was not designed to control for factors of human impact since the study sites have a variety of dominant human uses and histories of human engineering (such as adding sand to the beach or nearby hardening structures of Oregon Inlet at the Coast Guard site). Additionally, the timescale of sampling dates used in this study did now allow for a before-and-after impact comparison of the beach sites. Burrow densities did not reflect any clear relationship between relative human impacts on the study sites.
11
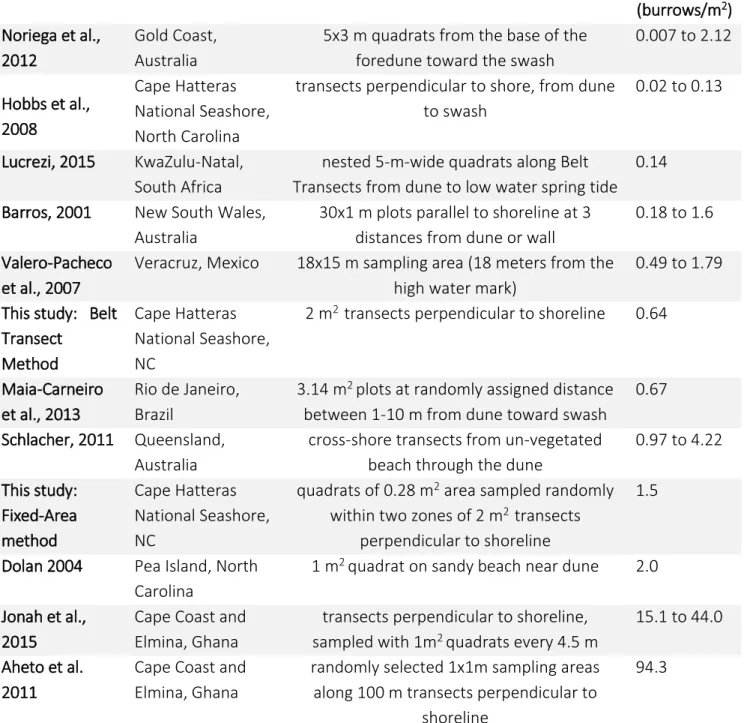
Table 2: Ghost crab burrow densities reported in literature, including the Fixed-Area and Transect
Method burrow densities found in this study. Reported burrow densities are listed from lowest to highest. Several studies reported a range of densities rather than a single value (due to different experimental treatments), which is reflected here.
Study Location Sampling Method Burrow
Density (burrows/m2)
Noriega et al., 2012
Gold Coast, Australia
5x3 m quadrats from the base of the foredune toward the swash
0.007 to 2.12
Hobbs et al., 2008
Cape Hatteras National Seashore, North Carolina
transects perpendicular to shore, from dune to swash
0.02 to 0.13
Lucrezi, 2015 KwaZulu-Natal, South Africa
nested 5-m-wide quadrats along Belt Transects from dune to low water spring tide
0.14
Barros, 2001 New South Wales, Australia
30x1 m plots parallel to shoreline at 3 distances from dune or wall
0.18 to 1.6
Valero-Pacheco et al., 2007
Veracruz, Mexico 18x15 m sampling area (18 meters from the high water mark)
0.49 to 1.79
This study: Belt Transect
Method
Cape Hatteras National Seashore, NC
2 m2 transects perpendicular to shoreline 0.64
Maia-Carneiro et al., 2013
Rio de Janeiro, Brazil
3.14 m2 plots at randomly assigned distance
between 1-10 m from dune toward swash
0.67
Schlacher, 2011 Queensland, Australia
cross-shore transects from un-vegetated beach through the dune
0.97 to 4.22
This study: Fixed-Area method Cape Hatteras National Seashore, NC
quadrats of 0.28 m2 area sampled randomly
within two zones of 2 m2 transects
perpendicular to shoreline
1.5
Dolan 2004 Pea Island, North Carolina
1 m2 quadrat on sandy beach near dune 2.0
Jonah et al., 2015
Cape Coast and Elmina, Ghana
transects perpendicular to shoreline, sampled with 1m2 quadrats every 4.5 m
15.1 to 44.0
Aheto et al. 2011
Cape Coast and Elmina, Ghana
randomly selected 1x1m sampling areas along 100 m transects perpendicular to
shoreline
94.3
12
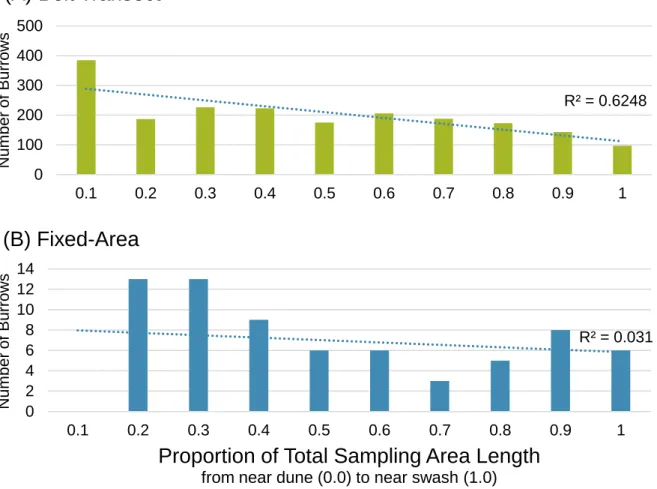
Ghost crab burrows were concentrated near the vegetated dune line and decreased in frequency toward the swash (Figure 7). Zone 1 had greater burrow density and abundance across all sampling areas and for both methods: 1.02 and 1.46 burrows/m2 for Zone 1 Belt
Transect and Fixed-Area, respectively; 0.55 and 1.41 burrows/m2 for Zone 2 Belt Transect and
fixed area, respectively.
Figure 7: Burrow abundance along width of the beach, with number of burrows recorded within normalized tenths of the length of each sampling area. The first tenth of each sampling area (from 0-0.1, leftmost on the horizontal axis) borders the vegetated dune and the final tenth (from 0.9-1.0) borders the swash zone of the beach. The length of each sampling area varied by study site and sampling date, thus the distance from dune was normalized to the length of each sampling area to represent trend in burrow abundance across the width of the beach. Top panel (A) shows burrow abundance decreasing with sampling area length for burrows recorded using the Belt Transect method (R2=0.6248). Bottom panel (B) shows burrow abundance peaking near the dune and less so near the swash for the Fixed-Area method, with low correlation factor (R2= 0.031) for a decreasing trend in burrow abundance with sampling area length.
One factor of method design that interferes with analysis in Figure 7 is that the Fixed-Area sampling always misses the first section of each zone because the quadrat is thrown from
R² = 0.6248
0 100 200 300 400 500
0.1 0.2 0.3 0.4 0.5 0.6 0.7 0.8 0.9 1
N
um
ber
of
B
urr
ow
s
(A) Belt Transect
R² = 0.031
0 2 4 6 8 10 12 14
0.1 0.2 0.3 0.4 0.5 0.6 0.7 0.8 0.9 1
N
um
ber
of
B
urr
ow
s
Proportion of Total Sampling Area Length
from near dune (0.0) to near swash (1.0)
13
the start of each zone. Thus, sampling does not cover the area where the member of the sampling team is standing or directly in front of them. This can be seen most clearly from the lack of burrows counted in the first tenth of the Fixed-Area method (Figure 7).
III.ii. Burrow Density Measurement Method Comparison
The burrow densities differed significantly between the two methods (p=0.0034; Paired Two Sample T-test; n=27; α < 0.05). Average burrow density captured by the Fixed-Area
sampling method is consistently higher than the values captured by the method (Table 3). Since the Fixed-Area method captured less area and did not cover the full distribution across the beach width, this method resulted in significantly higher burrow densities than the Belt Transect method.
Table 3: Summary of qualitative and quantitative differences between Fixed-Area and Belt Transect methods. Values represent burrow density sampled over 27 sampling areas.
Fixed-Area Method Belt Transect Method Burrow Density
(total burrows/total area sampled) 1.5 burrows/m2 0.64 burrows/m2
Mean Burrow Density
(mean of sampling areas) 1.4 burrows/m2 0.75 burrows/m2
Range 0.0 – 4.8 burrows/m2 0.094 – 2.4 burrows/m2
Variance 2.02 0.349
Standard Error 0.27 0.11
Total Area Sampled 57.1 m2 3,238.4 m2
Time to Complete One Sampling Area
(one timed example) approx. 4 minutes approx. 20 minutes
Total Burrows Recorded 69 2,004
Sampling Areas with Zero Burrows Recorded
(out of 27 total sampling areas;
when burrows were present) 8 0
The mean burrow densities obtained by the Fixed-Area method were greater than the Belt Transect method values for each sampling date (1.2 burrows/m2, 0.65 burrows/m2, and
0.18 burrows/m2 greater for Fixed-Area method in October 9th, 2015; May 12th, 2016; and July
2016, respectively). Burrow densities differed significantly between the two methods for the October 9th, 2015 sampling date (p=.012; Paired Two Sample T-test; n=9; a<.05), but not on
other sampling dates. Since the October 9th, 2015 sampling date also had the highest overall
14
between the two methods when burrow density is relatively greater among an aggregated category such as sampling date.
When differentiated by site, only the Coquina study site’s burrow densities differed significantly between the two methods (p=.006; Paired Two Sample T-test; n=9; a<.05). S-turns, rather than Coquina, had the highest overall burrow density among the three study sites. However, Coquina had the lowest number of sampling areas with 0 burrows/m2 for the
Fixed-Area method (1, as compared to 3 at S-turns and 4 at Coast Guard, out of a total 9 sampling areas for each site). I hypothesize that the greater number of non-zero results for Coquina contributed to the finding of significant difference between methods at this site. Thus, the significant difference between the two methods found for one study site (Coquina) and one sampling date (October 9th, 2015) may depend on data characteristics, such as magnitude and
number of non-zero results.
I also determined the burrow density values within the Zones 1 and 2 of each transect. The burrow densities in Zone 2 differed significantly with sampling method (pzone2 = 0.007;
Paired Two Sample T-tests; nzone2 = 29; α < 0.05). There was a stronger disparity between the
methods in Zone 2 (Fixed-Area mean is 0.43 burrows/m2 greater than Belt Transect), than in
Zone 1 (Fixed-Area mean is 0.86 burrows/m2 greater than Belt Transect). However, twenty-five
out of fifty-four total zone densities had a burrow density of 0 burrows/m2 for one of the two
methods. With only non-zero densities included, both Zone 1 and Zone 2 show significant difference in the densities of the two methods (pzone1 = 0.004, pzone2 = 0.0002; Paired Two
Sample T-tests; nzone2 = 13, nzone2 = 14; α < 0.05). This further suggests that data characteristics
such as non-zero results impact data analysis.
The burrow density values captured by the Fixed-Area method had greater range, variance, and standard error for the same sampling areas (n=27). Thus the burrow density results of the Fixed-Area method are less precise than those of the Belt Transect method (Table 3). This outcome is expected because of the smaller sample area captured by the fixed area method. The variance of the Fixed-Area method burrow density was five times larger, and had a range of values two times larger, than the Belt Transect method across all sampling areas (Table 3). Additionally, each Fixed-Area burrow density value differed, on average by 0.81 burrows/m2
15
significantly among sampling date and that Zone 2 densities did not. Fourth, with a similar test of study site differentiated by zone, both methods found no significant difference among the study sites for either zone. Thus, the Fixed-Area method and the Belt Transect method results for each ANOVA performed found the same statistical conclusions (Appendix Table B).
Almost one -third (eight out of twenty-seven) of the Fixed-Area method burrow density values were 0 burrows/m2 for a sampling area (i.e. no burrows were observed in the six
quadrats of a sampling area). In comparison, all of the Belt Transect burrow density values were non-zero for sampling areas, signifying that burrows were present within all of the sampling areas. The implication of this result is that the Fixed-Area method had a 29% occurrence of incorrectly reporting an absence of crab burrows at a sampling area when burrows are present. From the scale of an individual sampling area, the Fixed-Area method could be expected to result in a false-negative, or incorrect result of 0 burrows, 29% of the time. This false-negative occurred more often when burrow density obtained by both methods was relatively lower as compared to other burrow densities.
IV. Conclusion
We find that the trends in ghost crab burrow density across three sampling dates of the active season and three beach sites is consistent for both the Fixed-Area method and the Belt Transect method. While the Fixed-Area method burrow densities were significantly greater than the burrow densities captured by the Belt Transect method, this difference did not impact trends at the spatial scale of beach sites or temporal scale of sampling dates observed in this study. Pattern of decreasing burrow abundance across the beach width from dune to swash was observed with the Belt Transect method and less so with the Fixed-Area method. The sampling procedure for the Belt Transect method took approximately four times as long as the Fixed-Area sampling procedure for a single sampling area. In comparison, the total area
sampled by the Belt Transect method was fifty-six times greater than the area sampled by the Fixed-Area method. Concerns with the Fixed-Area method include much higher variance in burrow density values, lack of sampling across the full beach width, and a high occurrence of “false absence” of burrows within a beach area. These concerns are directly connected to the restricted sampling area of the Fixed-Area method, both in magnitude and distribution across the beach face.
16
of individual sampling area, the Fixed-Area method resulted in high occurrence of false-absence.
Ghost crab burrow abundance is impacted by many different factors, ranging from ecological and biological (crab population, prey population, reproduction or hibernation cycles), to morphological (sand moisture, beach topology, or beach width). Further, recording burrow abundance can be confounded by human trampling or sand collapse, obscuring burrows from sight. Thus, the dominant mechanistic factors controlling ghost crab burrow density are still largely unidentified and may vary widely depending on beach site, as suggested by the wide range of hypothesis and results from previous studies. Regardless, burrow density sampling remains a low-tech and relatively simple sampling process that can be applied widely due to the distribution of Ocypode species and their role as top-predator. Future research can be applied to tease out specific factors correlating with ghost crab burrow density, with particular
attention to the impact of sampling method on burrow density results, in order to hone and critique this tool for assessing beach impact and ecosystem health.
V. Acknowledgements
This project was supported by the Tom and Elizabeth Long Excellence Fund for Honors administered by Honors Carolina. I thank my mentor, Dr. Lindsay Dubbs, and the reader for my project, Dr. Reide Corbett, for constant support and advice. I thank Dennis Stewart, the prior Admin Officer at Alligator River National Wildlife Refuge with U.S. Fish and Wildlife Service, for sharing invaluable knowledge about the Pea Island Beach Invertebrate Monitoring program. Additionally, I thank Dr. Geoff Bell for encouraging me to complete an Honors Thesis project; my mother, Deborah Culbertson, for supporting me; my father, John Seyfried, and
grandmother, Dorothy Seyfried, for supporting my undergraduate career; the UNC Coastal Studies Institute (CSI) and Friends of Elizabeth II Guest House (especially Jaye Massecar) for hosting me in Manteo, NC; the UNC CSI Outer Banks Field Site Fall 2015 crew (Brady Blackburn, Anna Brodmerkel, Emma Boyd, Christy Korzen, Cinnamon Moore, Holly Roberts, Nicholas Reschly, Claire Johnson, and Coker Holmes) for their company and help with sampling; Randy Swilling, Natural Resource Program Manager for Cape Hatteras National Seashore for his
17
VII. Appendix for Weather Data and ANOVA Statistics
Table A: Weather conditions at Dare County Regional Airport in Manteo, NC for sampling dates, including temperature, wind speed, wind direction, and precipitation. No precipitation was recorded on the sampling dates or the day prior to each sampling date. Precipitation the day before sampling is included here because it can impact visibility of burrows on the beach face.
Sampling Date Max Air Temp. (°F)
Avg. Air Temp. (°C)
Average Wind Speed (km/h)
Total Precip. (cm)
Previous Day’s Total Precip. (cm) October 9th, 2015 23 °C 21 °C 24 km/h 0 cm 0 cm
October 19th, 2015 13 °C 11 °C 17 km/h 0 cm 0 cm
April 16th, 2016 13 °C 11 °C 26 km/h 0 cm 0 cm
May 12th, 2016 23 °C 18 °C 15 km/h 0 cm 0 cm
July 14th, 2016 31 °C 29 °C 23 km/h 0 cm 0 cm
Table B: Analysis of Variance (ANOVA) statistics were performed using categories of aggregated sampling area burrow densities across the sampling dates, study sites, and beach zones. The first four ANOVA results listed were performed among sampling dates and among study sites for both methods (4 different ANOVA tests). The eight subsequent ANOVA results listed were performed similarly, but with further differentiation based on zones. Thus, for each of the first four ANOVA categories, they were further split into only Zone 1 sampling areas or Zone 2 sampling areas for each category (eight additional different ANOVA tests). P-values showing a significant difference (alpha level is 0.05) among the burrow densities included in the category tested are denoted with asterisks. Test categories that differ only by sampling method (for example, the pair “Sampling Dates, Fixed-Area” and “Sampling Dates, Belt Transect”), consistently have the same result of significance or non-significance. Thus, the statistical result of the ANOVA does not depend on sampling method across the experimental variables of this study (sampling date, study site, zone).
SS df MS F P-value
Sampling Dates, Fixed-Area
Between Groups 18.9 2 9.46 6.73 0.00475*
Within Groups 33.6 24 1.40
Total 52.6 26
Sampling Dates, Belt Transect
Between Groups 4.55 2 2.27 12.1 0.000231*
Within Groups 4.51 24 0.188
Total 9.07 26
Study Site, Fixed-Area
Between Groups 6.48 2 3.24 1.68 0.206
Within Groups 46.1 24 1.92
Total 52.6 26
18
Between Groups 1.13 2 0.566 1.71 0.201
Within Groups 7.93 24 0.331
Total 9.07 26
Sampling Date, Zone 1, Fixed-Area
Between Groups 51.3 2 25.6 10.2 0.000609*
Within Groups 60.1 24 2.50
Total 111 26
Sampling Date, Zone 1, Belt Transect
Between Groups 12.4 2 6.22 15.5 4.64E-05*
Within Groups 9.59 24 0.399
Total 22.0 26
Sampling Date, Zone 2, Fixed-Area
Between Groups 5.45 2 2.72 1.20 0.315
Within Groups 54.1 24 2.25
Total 59.62879 26
Sampling Date, Zone 2, Belt Transect
Between Groups 0.544 2 0.272 1.72 0.198
Within Groups 3.78 24 0.157
Total 4.32 26
Study Site, Zone 1, Fixed-Area
Between Groups 16.3 2 8.18 2.06 0.148
Within Groups 95.1 24 3.96
Total 111 26
Study Site, Zone 1, Belt Transect
Between Groups 2.23 2 1.11 1.35 0.276
Within Groups 19.8 24 0.825
Total 22.0 26
Study Site, Zone 2, Fixed-Area
Between Groups 1.36 2 0.682 0.281 0.757
Within Groups 58.2 24 2.42
Total 59.6 26
Study Site, Zone 2, Belt Transect
Between Groups 1.74 2 0.870 3.34 0.0524
Within Groups 6.25 24 0.260
19
V. References
Aheto, D., Asare, C., Mensah, E., and Aggrey-Fynn, J. Rapid Assessment of Anthropogenic Impacts of Exposed Sandy Beaches in Ghana Using Ghost Crabs (Ocypode Spp.) as Ecological Indicators. Momona Ethiopian Journal of Science 3.2 (2011).
Barros, F. "Ghost Crabs as a Tool for Rapid Assessment of Human Impacts on Exposed Sandy Beaches." Biological Conservation 97.3: 399-404 (2001).
Bowman, M., Dolan, R. and Hayden, B. The Relationship of Emerita Talpoida to Beach Characteristics. (University of Virginia, 1981).
Brown, A. C., and McLachlan, A. "The Ecology of Sandy Shores." Journal of Animal Ecology 19.3 (1990): Research Gate.
Defeo, O., McLachlan, A., Schoeman, D. S., Schlacher, T. A., Dugan, J., Jones, A., Lastra, M., and Scapini, F. "Threats to Sandy Beach Ecosystems: A Review." Estuarine Coastal and Shelf Science 81.1 (2009): 1-12. ScienceDirect.
Dolan, R., and Lins, H. The Outer Banks of North Carolina. Rep. no. Professional Paper 1177 B. Reston, VA: US Geological Service (2000).
Dolan, R., Dofflemeyer, S., Donoghue, C., Smith, J. J. Analysis of Changes in the Beach Sediment and Beach-face Organisms Associated with Sand Bypassing from the Oregon Inlet to Pea Island, North Carolina, 1990 to 2002. (2004).
Hobbs, C. H., Landry, C. B. & Perry, J. E. Assessing Anthropogenic and Natural Impacts on Ghost Crabs (Ocypode quadrata) at Cape Hatteras National Seashore, North Carolina. J. Coast. Res. 246, 1450–1458 (2008).
James, R. J. "From Beaches to Beach Environments: Linking the Ecology, Human-use and Management of Beaches in Australia." Ocean & Coastal Management 43 (2000): 495-514. Elsevier.
Jonah, F. E., Agbo, N. W., Agbeti, W., Adjei-Boateng, D. & Shimba, M. J. The ecological effects of beach sand mining in Ghana using ghost crabs (Ocypode species) as biological indicators. Ocean Coast. Manag. 112, 18–24 (2015).
Keeton, H., Merrill, K., Pfotenhauer, S., Phillips, K., Price, T., Roberts, J., Rowland, A., Spalding, S., Stripp, M., and Zdanski, L. Predator Management for the Protection of Threatened and Endangered Species : A Multidisciplinary Study. (2013).
Lucrezi, S., Schlacher, T. A. and Robinson, W. Human disturbance as a cause of bias in ecological indicators for sandy beaches: Experimental evidence for the effects of human trampling on ghost crabs (Ocypode spp.). Ecol. Indic. 9, 913–921 (2009a).
Lucrezi, S., Schlacher, T. A. & Walker, S. Monitoring human impacts on sandy shore ecosystems: A test of ghost crabs (Ocypode spp.) as biological indicators on an urban beach. Environ. Monit. Assess. 152, 413–424 (2009b).
Lucrezi, S. Ghost crab populations respond to changing morphodynamic and habitat properties on sandy beaches. Acta Oecologica 62, 18–31 (2015).
Lucrezi, S., and Schlacher, T. "The Ecology of Ghost Crabs." Oceanography and Marine Biology Oceanography and Marine Biology - An Annual Review (2014): 201-56. Research Gate. Maia-Carneiro, T. Density and spatial distribution of Ocypode quadrata (Decapoda,
20
Moss, D. & McPhee, D. P. The impacts of recreational four-wheel driving on the abundance of the ghost crab (Ocypode cordimanus) on a subtropical sandy beach in SE Queensland. Coast. Manag. 34, 133–140 (2006).
National Park Service. "Beach Activities." U.S. Department of the Interior, 10 Mar. 2016. Web. 15 Apr. 2017. <https://www.nps.gov/caha/planyourvisit/beachactivities.htm#ORV> Noriega, R., Schlacher, T. A., and Smeuninx, B. Reductions in Ghost Crab Populations Reflect
Urbanization of Beaches and Dunes. J. Coast. Res. 279, 123–131 (2012).
Pombo, M. and Turra, A. Issues to be considered in counting burrows as a measure of atlantic ghost crab populations, an important bioindicator of sandy beaches. PLoS One 8, 1–7 (2013).
Schlacher, T. A., Dugan, J., Schoeman, D. S., Lastra, M., Jones, A., Scapini, F., Mclachlan, A., and Defeo, O. "Sandy Beaches at the Brink." Diversity and Distributions 13.5 (2007): 556-60. Schlacher, T. A., Schoeman, D. S., Dugan, J., Lastra, M., Jones, A., Scapini, F., and Mclachlan, A.
"Sandy Beach Ecosystems: Key Features, Sampling Issues, Management Challenges and Climate Change Impacts." Marine Ecology 29.S1 (2008): 70-90. Web.
Schlacher, T. a., De Jager, R. and Nielsen, T. Vegetation and ghost crabs in coastal dunes as indicators of putative stressors from tourism. Ecol. Indic. 11, 284–294 (2011).
Schlacher, Thomas, and S. Lucrezi. "The Ecology of Ghost Crabs." Oceanography and Marine Biology Oceanography and Marine Biology - An Annual Review (2014): 201-56. Research Gate.
Schlacher, Thomas A., Serena Lucrezi, Rod M. Connolly, Charles H. Peterson, Ben L. Gilby, Brooke Maslo, Andrew D. Olds, Simon J. Walker, Javier X. Leon, Chantal M. Huijbers, Michael A. Weston, Alexander Turra, Glenn A. Hyndes, Rebecca A. Holt, and David S. Schoeman. "Human Threats to Sandy Beaches: A Meta-analysis of Ghost Crabs Illustrates Global Anthropogenic Impacts." Estuarine, Coastal and Shelf Science 169 (2016): 56-73.
Silva, W. T. a F. and Calado, T. C. S. Number of ghost crab burrows does not correspond to population size. Cent. Eur. J. Biol. 8, 843–847 (2013).
Steiner, A. J., and S. P. Leatherman. "Recreational Impacts on the Distribution of Ghost Crabs Ocypode Quadrata Fab." Biological Conservation 20.2 (1981): 111-22. Elsevier.
Strachan, P. H., Smith, R. C., Hamilton, D. a B. and Taylor, a C. Studies on the ecology and behaviour of the ghost crab , Ocypode cursor ( L .) in northern Cyprus. Sci. Mar. 63, 51– 60 (1999).
Seike, K. and Nara, M. Burrow morphologies of the ghost crabs Ocypode ceratophthalma and O. sinensis in foreshore, backshore, and dune subenvironments of a sandy beach in Japan. J. Geol. Soc. Japan 114, 591–596 (2008).
Valero-Pacheco, E., Abarca-Arenas, L., Escobar, M., and Alvarez, F. Population Density and Activity Pattern of the Ghost Crab, Ocypode Quadrata, in Veracruz, Mexico. Crustaceana 80.3, 313-25 (2007)
Walker, S. "Nourishment Project at Mirlo Beach Is Done in Two Months." The Outer Banks Voice. The Outer Banks Voice, 19 Sept. 2014. Web. 15 Apr. 2017.
21
"Weather Archives for Oregon Inlet Fishing Center, NC." Manteo / Dare County Regional, Weather Archive. WeatherForYou, n.d. Web. 15 Apr. 2017.
<https://www.weatherforyou.com/reports/index.php>
Williams, A. B. Shrimps, Lobsters and Crabs of the Atlantic Coast of the Eastern United States, Maine to Florida. Washington: Smithsonian Institution. Print. (1984).
Wolcott, T. G. and Wolcott, D. L. Impact of off-road vehicles on macroinvertebrates of a mid-atlantic beach. Biol. Conserv. 29, 217–240 (1984).