Australian Journal of Basic and Applied Sciences
AUSTRALIAN JOURNAL OF BASIC AND
Open Access Journal
Published BY AENSI Publication
© 2016 AENSI Publisher All rights reserved
This work is licensed under the Creative Commons Attribution International License (CC BY). http://creativecommons.org/licenses/by/4.0/
To Cite This Article: W.S. Lim, B.C. Yeo, Y. Uvarajan and J. Emerson Raja Thermal Image Classifier. Aust. J. Basic & Appl. Sci.,
A Correlation-Ranked Interest
Classifier
W.S. Lim, B.C. Yeo, Y. Uvarajan and J. Emerson Raja
Faculty of Engineering and Technology, Multimedia
Address For Correspondence:
W.S. Lim, Faculty of Engineering and Technology, Multimedia University, Jalan Ayer Keroh Lama, Bukit Beruang, 75450 Melaka, Malaysia
A R T I C L E I N F O Article history:
Received 12 January 2016 Accepted 22 February 2016 Available online 1 March 2016
Keywords:
Image Classification, Interest Point Detection, Sum of Absolute Difference, Correlation, Probabilistic Neural Network, Thermal Vision
Image classification is an image analysis process in machine vision, aiming to organize the image data into a set of categories according to the contextua
generally used to recognize the objects in the scene, where the can be classified according to the shape and edge
in road traffic monitoring system for
scene, the target objects are the vehicles, which can be classified as cars
outdoor vision-based system, traffic monitoring system is often required to operate in complex scene, where background may consists non-target object such as
traffic monitoring system, the image
collection system to smoothen the toll collection process classification in the recent works are:
food-intake reporting system by (Nguyen, et al., 2014) Sum of Absolute Difference (SAD) is a
through template matching. With a selected referen be algorithmically located in the scene
images of the scene (Kumar, et al., 2014)
perceived as either the similarity or disparity measurement results from the image comparison. the SAD is used to determine the disparity between the stereo images
Australian Journal of Basic and Applied Sciences, 10(4) February 2016, Pages:
17-AUSTRALIAN JOURNAL OF BASIC AND
APPLIED SCIENCES
ISSN:1991-8178 EISSN: 2309-8414 Journal home page: www.ajbasweb.com
rights reserved
This work is licensed under the Creative Commons Attribution International License (CC BY). http://creativecommons.org/licenses/by/4.0/
W.S. Lim, B.C. Yeo, Y. Uvarajan and J. Emerson Raja., A Correlation-Ranked Interest Point Selection Method for Aust. J. Basic & Appl. Sci., 10(4): 17-23, 2016
Ranked Interest Point Selection Method for Thermal Image
J. Emerson Raja
Faculty of Engineering and Technology, Multimedia University, Jalan Ayer Keroh Lama, Bukit Beruang, 75450 Melaka, Malaysia
Faculty of Engineering and Technology, Multimedia University, Jalan Ayer Keroh Lama, Bukit Beruang, 75450 Melaka,
A B S T R A C T
In a machine vision system, image classifier is essential to recognize the objects in the scene. Some applications that require image recognition are vehicle classification, face detection, finger print detection, etc. For different applications, different
are generally required to be handled by the image classifier. Thus, Probabilistic Neural Network (PNN) becomes a great tool to implement the classifier since the PNN can be trained by using the dataset that contains relevant images. General
required to be labeled before the training process. In this paper, Sum of Absolute Difference (SAD) is used to measure the image similarities and dissimilarities for image labeling with minimum human intervention. However, a PNN classifi with the SAD-labeled data provides low classification accuracy. This is because of the inclusion of insignificant pixels in the training process. By using coorelation as a measure, the dependency between the pixels of the images and the class ty
determined. A pixel is considered to be significant for classification if its depedency to the class type is strong. In this study, applying threshold to select the pixels with higher coorelations for the classifier has improved the classificatio
INTRODUCTION
an image analysis process in machine vision, aiming to organize the image data into a set of categories according to the contextual information. In a machine vision system, image classifier is generally used to recognize the objects in the scene, where the camera of system is installed
can be classified according to the shape and edge information extracted. Image classification is widely for vehicle counting and vehicle classification (Lai, et al., 2010)
scene, the target objects are the vehicles, which can be classified as cars, buses, lorries, motorcycles, etc. As an based system, traffic monitoring system is often required to operate in complex scene, where
target object such as bushes (or trees), buildings, light poles
image-based vehicle classification can also be implemented in electronic toll to smoothen the toll collection process (Ng & Tay, 2011). Some other
are: optical character recognition by (Gao, et al., 2011)
(Nguyen, et al., 2014), face recognition by (Sridhar & Krishna, 2013)
f Absolute Difference (SAD) is a popular technique to be used for object recognition and detection With a selected reference image of the target object as the template, the object can be algorithmically located in the scene by measuring the similarity between the template and the regional (Kumar, et al., 2014). The SAD between two images provides a numerical index that can be perceived as either the similarity or disparity measurement results from the image comparison.
the SAD is used to determine the disparity between the stereo images for the depth estimation analysis -23
Interest Point Selection Method for
for Thermal Image
University, Jalan Ayer Keroh Lama, Bukit Beruang, 75450 Melaka, Malaysia
Faculty of Engineering and Technology, Multimedia University, Jalan Ayer Keroh Lama, Bukit Beruang, 75450 Melaka,
classifier is essential to recognize the objects in the scene. Some applications that require image recognition are vehicle classification, face detection, finger print detection, etc. For different applications, different set of objects are generally required to be handled by the image classifier. Thus, Probabilistic Neural Network (PNN) becomes a great tool to implement the classifier since the PNN can be trained by using the dataset that contains relevant images. Generally, the images are required to be labeled before the training process. In this paper, Sum of Absolute Difference (SAD) is used to measure the image similarities and dissimilarities for image labeling with minimum human intervention. However, a PNN classifier trained labeled data provides low classification accuracy. This is because of the inclusion of insignificant pixels in the training process. By using coorelation as a measure, the dependency between the pixels of the images and the class type can be determined. A pixel is considered to be significant for classification if its depedency to the class type is strong. In this study, applying threshold to select the pixels with higher coorelations for the classifier has improved the classification accuracy significantly.
an image analysis process in machine vision, aiming to organize the image data into l information. In a machine vision system, image classifier is installed. Generally, images lassification is widely applied (Lai, et al., 2010). In the traffic ies, motorcycles, etc. As an based system, traffic monitoring system is often required to operate in complex scene, where the buildings, light poles, and humans. Besides based vehicle classification can also be implemented in electronic toll other applications of image (Gao, et al., 2011), food recognition for
(Sridhar & Krishna, 2013), etc. technique to be used for object recognition and detection
18 W.S. Lim et al, 2016
Australian Journal of Basic and Applied Sciences, 10(4) February 2016, Pages: 17-23
binocular machine vision system (Panchal & Upadhyay, 2014). Besides being implemented in normal-vision based system, SAD is also being implemented in thermal vision-based system such as the Probabilistic Neural Network (PNN)-based thermal image classifier developed by (Lim, et al., 2015).
Thermal images can be produced by the thermal imaging camera. It is an imaging device containing a sensor, which is sensitive to infrared spectrum. Meanwhile, the vision camera is operated in visible spectrum. Thus, the image captured under thermal vision looks different from the images captured under normal vision. Since all the objects that consist of heat will release infrared light, the thermal imaging camera is able to capture the infrared (IR) energy radiated from the objects and forming images that show the thermal distribution of the objects. In the thermal images, the warmer objects are normally represented by brighter pixels. And, the major strength of the thermal imaging camera is its capability in 'seeing' the objects in complete darkness. Thus, thermal vision has become an alternative machine vision for road traffic monitoring, in which the system is normally required to operate over 24/7 in outdoor environment (Iwasaki, et al., 2013).
Although SAD can be used to distinguished thermal images between classes, the algorithm requires sampling of a large number of points for image comparison. Generally, more number of sample points costs more computational time. In addition, SAD treats all sample points equally, without knowing the significance of the sample points for classification. Inclusion of insignificant sample points for classification does not only waste the computational resources, but also cause SAD to be susceptible to noise. In this paper, a method to select the important sample points, known as interest points, is proposed for the thermal image classifier.
Image Classifier:
A. Sum of Absolute Difference:
SAD is a techniques used to measure the similarities and dissimilarities of the two images. If both images are identical, SAD produces 0. The greater the similarity between two images the lower the value of the SAD, and vice versa. SAD is widely used for image compressing and object tracking, since it is able to locate the target objects in the images. In general, SAD has less computational time compare to the other methods and it is simple and direct (Dawoud, et al., 2011). Thus, this image similarities measurement technique had been implement for image classification. Given two images , and , , the SAD can be computed with the following equation.
, = ∑ ∑ | , − . | (1)
B. Pearson's Correlation Coefficient:
Pearson correlation is an alternative technique used to measure the similarities and dissimilarities between images (Goshtasby, 2012). Correlation coefficient was discover by Bravais in 1846 and it was later shown as the best correlation between two sequences of numbers by Pearson. The image capture by the camera are represented in form of matrixes, in which every pixel consists of a numerical value. Let the = , , … , denotes the sequence of the pixel values for the first image and = , , … denote be the sequence value the pixel values for the second image, the correlation between the two image can be determined with the following equation. ̅ and are the mean values of the two images.
, = ∑!" ̅
#∑!" ̅$∑!" $ (2)
Statistically, image and image can be perceived as 2 variables, which and are the sample points for the and respectively. If the = 1, the sequence of the pixels of the two images are considered to have perfect direct linear relationship. In simple, the variables and are said to be correlated. Meanwhile, if the
= −1, the sequence of pixels of two images are said to have perfect decreasing linear relationship. In other words, the variables and are said to be anti-correlated. When the two images have different lighting condition with linearly-related pixel intensities, the correlation coefficient of the two images are expected to be high. The high value of can be interpreted as the present of high similarity between the two images. In the opposite, low value of provides a perception that the two images are dissimilar. Both the high-correlation and high-anti-correlation scenarios demonstrate that the variables are strongly dependence to each other. Thus, the high-dependability of the variables and can be justified with a high absolute value of the correlation | |. However, | | = 0 does not indicate that the two variables are independent because Pearson's correlation coefficient only detects the linear dependencies.
C. Probabilistic Neural Network:
19 W.S. Lim et al, 2016
Australian Journal of Basic and Applied Sciences, 10(4) February 2016, Pages: 17-23
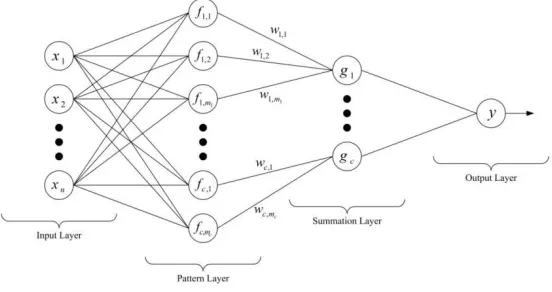
Input Layer:
The role of the input layer is to transmit the input data to the hidden layer for further processing.
Pattern Layer:
Pattern layer contains of a number artificial neurons modeled with latent parameters. The neurons are grouped together according to the number of classes. If the number of input data is increased, the number of neuron being required in the hidden layer is also generally increased. In general, the neurons in the pattern layer can be modeled with Gaussian distribution as shown in the following equation.
'(,)* =+ ,-*,.*⋅ exp {−
5 6*,.*7$
-*,.*$ } (3)
where 9( indicates the total number of neurons in class :. ;(,)* and <(,)* denote the mean and the standard deviation respectively.
Summation Layer:
The function of the summation layer is to sum the number of neurons '(,)* , which belong to class :.
=( x = ∑ >(,)*⋅ '(,)* (4)
where >(,)* denotes the weight for the neuron '(,)* .
Fig. 1: Architecture of Probabilistic Neural Network.
Output Layer:
The output layer is called as a decisions layer, which is used to select the class that gives highest value from the summation layer. In other words, the output layer classify the input data according to =( . For example, if ?@ {= , = , =A } = = x , the input data is classified to class 2 (or the output = 2).
Experimental Setup:
In this research, a thermal vision based traffic surveillance system was used to record the traffic video at the frame rate of 30 frames per seconds. The traffic scene consists of many objects that can be categorized as the background objects and the foreground objects. Generally, all the static objects are considered as the background objects and all the moving objects (such as vehicles on the road) are considered as the foreground objects. By using Extended Fuzzy Running Average (EFRA) developed by (Yeo, et al., 2013) as the background model, the moving vehicles on the road can be detected and differentiated from the background scene. Since the traffic surveillance system is normally operated in the outdoor environment, the system has to cope with complex traffic scene, where the moving objects includes vehicles and bushes. When the two vehicles are near to each other, they can be detected as one object. Consequently, this false detection scenarios negatively reflect on the performance of the vehicle detection accuracy. Thus, it is essential to recognize the moving objects to avoid false detection.
20 W.S. Lim et al, 201X
Australian Journal of Basic and Applied Sciences, X(X) Xxx 201X, Pages: 1-7
The process is essential as manual image labeling is a tedious task and it needs experienced professional to handle the task.
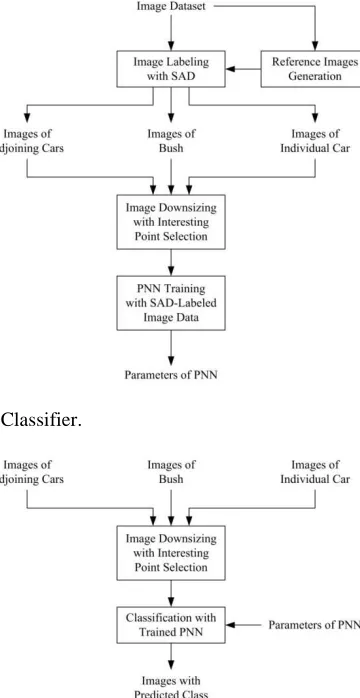
A. Image Labeling with SAD:
SAD is an algorithm used to measure the similarity between images. Given the reference images C for each class , an image D can be labeled as the class , if SAD between the image and the reference image of the class is the smallest, as shown in the following equation. In this paper, ∈ {@F G H H= :@ I, JKIℎ, HF M FK@N :@ }.
O D = min { D, C } (5)
Fig. 2: Training Process for Image Classifier.
Fig. 3: Testing Process for Image Classifier.
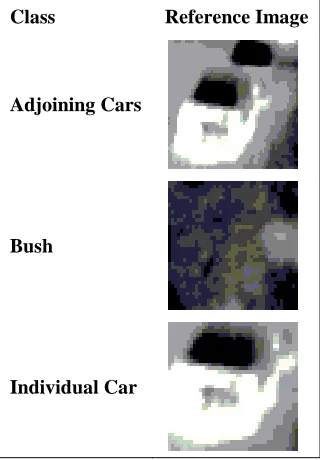
In order to determine the reference images of 3 classes, 10 images for each class are randomly and manually selected from the image dataset. Now, there are 10 car images.10 bush images and 10 adjoining car images being selected. Based on the selected images, the average image for each class is calculated and treated as the reference image C for the class. Figure 2 presents the reference images for each class. Consider every image in the dataset as image D. SAD labels the image D by measuring the similarity of image D with the reference image C.
Table 1 shows the accuracy of labeling the images. SAD is able to recognized the bush images from the other classes of images because the appearance of the bushes are significantly different from the cars. However, SAD is inaccurate in labelling the adjoining cars and the individual car images. This is because the two classes of images are similar. Generally, SAD is still able to achieve more than 70% of accuracy in labelling the images.
21
Australian Journal of Basic and Applied Sciences
values at the coordinate , can be related to the class number in every images are directly proportion to the class number, it correlated to the class number.
Fig. 4: Reference Images for Different Image Classes
Table I: Labelling Accuracy for Difference Class Classes
Adjoining Cars Bush Individual Car
B. Image Downsizing with Correlation
Higher correlation value indicate
in the dataset. In other words, the dependency between the class number the correlation is higher. By ranking all of the pixel coordinates
significant pixels can be then selected by applying threshold to the correlation. correlation greater then the threshold will be selected.
strong dependency to the classification. The number image in the dataset and the rate of image downsizing depend threshold, the lesser the number of interest
can be grouped in a vector to represent the image. In this paper, the vector train and test the image classifier
The size of every image in the
separate dataset, consisting 150 images (50 images
images in the training datasets are downsizing by with a correlation thresho
coordinates , during the training process are also being used for the image downsizing in the testing process.
Table II: Classification Accuracy without Image Downsizing Class
Adjoining C Bush Individual C
Table II presents the results when image downsizing is not implemented to the training and testing the classifier. Every pixels are of the images are selected for the evaluation of the classifier. It is observed that the classifier is inaccurate in recognizing images of adjoining cars and the images of individual car. The classifier is
W.S. Lim et al, 201X
Australian Journal of Basic and Applied Sciences, X(X) Xxx 201X, Pages:
1-can be related to the class number . To illustrate, if the values of the first pixels in every images are directly proportion to the class number, it can be concluded that the value of the first pixel is
Class Reference Image
Adjoining Cars
Bush
Individual Car
for Different Image Classes.
Accuracy for Difference Class.
Labelling Accuracy 70% 100%
95%
Image Downsizing with Correlation:
Higher correlation value indicates that the pixel , is more unique and informative to classify the In other words, the dependency between the class number and the pixel
By ranking all of the pixel coordinates , according to the correlation,
selected by applying threshold to the correlation. Only the pixels with the correlation greater then the threshold will be selected. These selected pixels are the interest
strong dependency to the classification. The number interest points is smaller than the total pixels forming rate of image downsizing depends on choice of correlation threshold
number of interest points will be selected. These interest points extracted from an image can be grouped in a vector to represent the image. In this paper, the vector-organized interest
RESULTS AND DICUSSIONS
The size of every image in the training dataset is 50 U 50 pixels. To test the accuracy of the classifier, a separate dataset, consisting 150 images (50 images for each class), is used. Before training the classifier, the images in the training datasets are downsizing by with a correlation thresholds V
during the training process are also being used for the image downsizing in the testing
without Image Downsizing.
Accuracy
Adjoining Cars 54%
92%
Individual Car 58%
Table II presents the results when image downsizing is not implemented to the training and testing the classifier. Every pixels are of the images are selected for the evaluation of the classifier. It is observed that the inaccurate in recognizing images of adjoining cars and the images of individual car. The classifier is
-7
. To illustrate, if the values of the first pixels can be concluded that the value of the first pixel is
and informative to classify the images
, is stronger, when according to the correlation, a set of Only the pixels with the interest points that exhibit is smaller than the total pixels forming each correlation threshold. The higher the extracted from an image interest points are used to
To test the accuracy of the classifier, a each class), is used. Before training the classifier, the
L. The selected pixel during the training process are also being used for the image downsizing in the testing
Accuracy 54% 92% 58%
22 W.S. Lim et al, 201X
Australian Journal of Basic and Applied Sciences, X(X) Xxx 201X, Pages: 1-7
only able to recognize 54% and 58% of the images of adjoining cars and individual car in the testing dataset. This is due to the inclusion of large amount insignificant pixels (with low correlation value) for the image classification. These insignificant pixels can be perceived as noise sources, that results poor classification accuracy, comparing to the labeling accuracy.
Table III: Classification Accuracies with Image Downsizing Using Different Correlation Thresholds.
Threshold 0.4 0.5 0.6 0.7
Class
Adjoining Cars 88% 96% 98% 86%
Bush 100% 100% 100% 94%
Individual Car 100% 100% 98% 84%
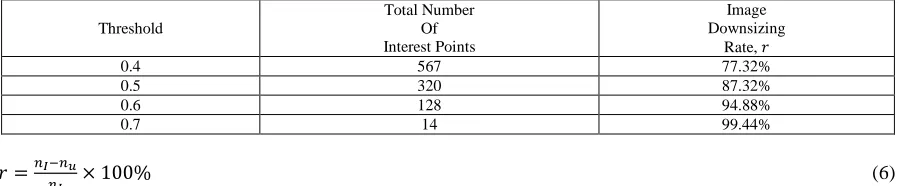
Table III presents the classification accuracy for different correlation thresholds. Threshold beyond 0.7 is not considered in this study because there are too few pixels coordinates that give the correlation higher the threshold. Table IV presents the number of interest points being selected for each image for the classifier with different thresholds. Meanwhile the image downsizing rate is computed with the following equation. HW and HX denote the total pixels of a image and the total number of extracted interest points respectively.
Table IV: Image Downsizing Rate for Different Correlation Thresholds. Threshold
Total Number Of Interest Points
Image Downsizing
Rate,
0.4 567 77.32%
0.5 320 87.32%
0.6 128 94.88%
0.7 14 99.44%
= Y Z
Y × 100% (6)
From Table III, it is observed that the classification accuracy has been significantly improved with image downsizing method at the threshold greater than 0.4. The accuracy reaches its optimum at Vℎ = 0.6, in which the classifier is able to differentiated the test images from the three class at the average accuracy of 98.67%. This average accuracy has been improved by 45%, comparing to the accuracy of the classifier without image downsizing. At Vℎ = 0.6, the image downsizing rate is 94.88%, indicating that 2372 pixels have been considered to be insignificant for classification and thus excluded for the classifier.
Conclusion:
Image classifier is essential for many application such as vehicle classification, face detection, finger print detection, etc. In this paper, SAD is used to measure the image similarities and dissimilarities for image labeling with minimum human intervention. A classifier trained with the SAD-labeled data provides low classification accuracy due to the inclusion of insignificant pixels in the training process. By using coorelation as a measure, dependency between the pixels and the class type can be determined. In this study, applying threshold to select the pixels with higher coorelations for the classifier has improved the classification accuracy significantly.
REFERENCES
Dawoud, N.N., B.B. Samir, J. Janier, 2011. Fast Template Matching Method Based Optimized Sum of Absolute Difference Algorithm for Face Localization. International Journal of Computer Applications, 18(8): 30-34.
Gao, Y., A. Rehman, Z. Wang, 2011. CW-SSIM Based Image Classification. Brussels, IEEE International Conference on Image Processing, 1249-1252.
Goshtasby, A.A., 2012. Similarity and Dissimilarity Measures. In: Advances in Computer Vision and
Pattern Recognition. London: Springer-Verlag, 7-66.
Iwasaki, Y., M. Misumi, T. Nakamiya, 2013. Robust Vehicle Detection under Various Environmental Conditions Using an Infrared Thermal Camera and Its Application to Road Traffic Flow Monitoring. Sensors, 13(6): 7756-7773.
Kumar, A., 2014. Template Matching Application In Geo-Referencing of Remote Sensing Temporal Image.
International Journal of Signal Processing, Image Processing and Pattern Recognition, 7(2): 201-210.
Lai, J.C., S.S. Huang, C.C. Tseng, 2010. Image-Based Vehicle Tracking and Classification on the Highway. Shanghai, International Conference on Green Circuits and Systems, 666-670.
Lim, W.S., N. Isabella, B.C. Yeo, 2015. Template Matching in Supervised Learning for Thermal Image Classification. Australian Journal of Basic and Applied Sciences, 9(23): 522-527.
23 W.S. Lim et al, 201X
Australian Journal of Basic and Applied Sciences, X(X) Xxx 201X, Pages: 1-7
Ng, J.Y., Y.H. Tay, 2011. Image-Based Vehicle Classification System. Kaohsiung, Asia-Pasific ITS Forum & Exhibition.
Nguyen, D.T., 2014. Food Image Classification Using Local Appearance and Global Structural Information. Neurocomputing, 140: 242-251.
Panchal, C.S., A.B. Upadhyay, 2014. Depth Estimation Analysis Using Sum of Absolute Difference Algorithm. International Journal of Advanced Research in Electrical, Electronics and Instrumentation
Engineering, 3(1): 6761-6767.
Sridhar, D., I.M. Krishna, 2013. Face Image Classification Using Combined Classifier. Coimbatore, International Conference on Signal Processing Image Processing & Pattern Recognition, 97-102.