ISSN 2307-7743 http://scienceasia.asia
MODELING TOBACCO SMOKING EFFECT ON THE HIV INFECTION OF CD4+ T-CELLS
JACOB ISMAIL IRUNDE, LIVINGSTONE S. LUBOOBI, YAW NKANSAH-GYEKYE
Abstract. Tobacco smoking impairs CD4+ T-cells which coordinate the immune system.
In this paper we develop a mathematical model to study how tobacco smoking affects the HIV infection of CD4+ T-cells. We derive the model equilibrium states and investigate conditions for their stability. Analysis shows that, disease free equilibrium is locally stable whenR0T1 <1 which implies low smoking rate and when R0T2 <1 which imply low HIV
infection rate, it is globally stable whenR0T1 <1. Endemic equilibrium is asymptotically
stable when there is high smoking rate in whichR0T1 >1 and high HIV infection in which R0T2 >1.
The model is numerically simulated, results indicate that increasing smoking rate decreases uninfected T-cells and increases the number of HIV infected T-cells and free virus. The reduction of uninfected T-cells and the increase of HIV infected T-cells and free virus com-promises the immune system and expose a HIV smoker to opportunistic infections which marks a disease stage. To prolong and improve the quality of life for people living with HIV smoking cessation programs should be emphasized.
1. Introduction
The immune system is responsible for host defense against any external or internal ar-gent. In performing its defensive role, the immune system responds to a variety of antigens using T-cells with receptors for specific antigens and recognize body’s own antigens and activate harmful autoimmunity to the pathogens [10]. CD4+ T-cells in particular play a central role to protect the immune system through helping B cells to make antibodies, stir-ring macrophages’ ability to build up improved microbicidal activity, recruiting neutrophils, eosinophils and basophils to the location where there is infection or inflammation [38].
Infection of T-cells by HIV virus and impaired antigen response due to tobacco smoking have a remarkable negative effect to the immune system [35] and [37]. T-cells which are unresponsive due to tobacco smoke and are infected with HIV cannot perform their defense role because they cannot respond to the stimulation [19], [28] and have HIV DNA copy tran-scribed into their DNA [26]. Compounds such as nicotine, tar, carbon dioxide and carbon
Key words and phrases. Tobacco smoking, HIV, Partial reproduction number, Smoking impairment, T-cells.
c
2016 Science Asia
monoxide from tobacco smoke induce anergy to T-cells and reduce their efficiency in re-sponding to body antigens and in producing cytokines and chemokines which are important for coordinating the immune system. Apart from reducing their defense potentials, T-cells are also used by HIV to further its reproduction during replication. T-cells which are af-fected by tobacco smoke and HIV fail to perform their normal functions and make the host vulnerable to various infections [27].
Although tobacco smoking has a devastating effect to the immune system, its effect on the HIV infection of T-cells is less known and has not been given attention whereas smok-ing rate of people who are livsmok-ing with HIV is increassmok-ing [2], [25], [36]. Mehta et al. [19], Sopori [27] and Kalra et al. [11] studied the effect of tobacco smoking on the immune system. Reviewing the effect of tobacco smoking, Mehta et al. [19] concentrated on the im-munosuppressive effects of tobacco smoke and mechanism through which tobacco smoking can compromise the immune system. On T-cells, which are the interest of this work, Mehta et al. [19] point out that smoking alters T-cells responses and reduce their defense potentials.
Sopori [27] as well addressed the effects of cigarette smoke on the immune system. The study asserts that chronic exposure to tobacco smoke affects a wide range of immunological functions including responses from innate and adaptive immune systems. According to the study, nicotine and tar being the components of tobacco smoke are main cause of T-cells’ insensitivity, these two compounds nicotine and tar also account for the immunosuppressive and addictive effect of tobacco smoking. Kalra et al. [11] investigated the effect of cigarette smoke on the immune responses. The study put forward that chronic exposure to cigarette smoke affects T-cells responses, this can account for diminished T-cells proliferation and antibody responses within the host.
This study aims at using mathematical model to explore how tobacco smoking affects dy-namics of HIV in T-cells and how T-cells accommodate tobacco smoking and HIV. The recruitment rate of T-cells in our model is similar to the recruitment rate of T-cells in the model developed by Das et al. [5], however, tobacco smoking, productively and unproduc-tively T-cells differentiate the two models. Due to growing number of people who are living with HIV and smoke, this paper is interested to find out how tobacco smoking affects the HIV infection of CD4+ T-cells.
2. Materials and Methods
2.1. Model development and Analysis. The model for the effect of tobacco smoking
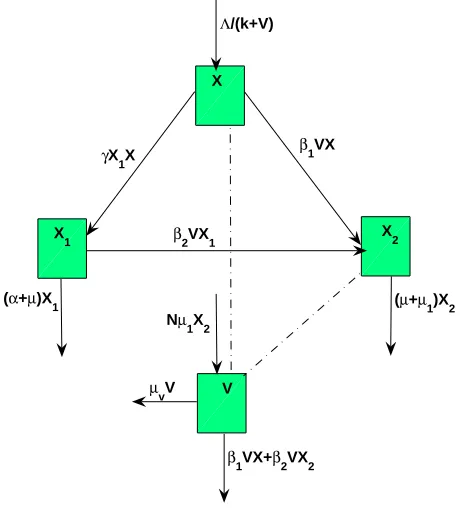
in the dynamics of HIV in T-cells divides T-cells into three classes, uninfected T-cells X,
smoking impaired T-cells X1 and HIV infected T-cells X2. The free virus population is
referred to as T-cells.
Uninfected T-cells are recruited at a rate Λ
k+V which is a decreasing function of the virus
V [23] and [24], this is due to the ability of HIV virus to infect T-cells in the progenitor [5].
Uninfected T-cells acquire HIV and smoking impairment following a contact with free virus
and smoking impaired T-cells at rates β1 and γ respectively.
Smoking impaired T-cells X1 grow when uninfected T-cells acquire smoking impairment
at a rate γ, suffer HIV infection following a contact with free virus at a rate β2 and further
suffer smoking induced mortality at a rate α.
HIV infected T-cells X2 replenish at rates β1 and β2 following a viral contact with
unin-fected T-cells and smoking impaired T-cells respectively. The class of HIV inunin-fected T-cells
X2 also suffers HIV induced mortality at a rate µ1. The parameter µ represents T-cells
natural mortality for all T-cells compartments.
Free virus V increase when HIV infected T-cells replicate at a rate N µ1 where N
repre-sents number of free virus released by a single T-cell. Free virus diminish when they fuse
with smoking impaired and uninfected T-cells at ratesβ1V X andβ2V X1 respectively.
How-ever, they suffer natural mortality at a rate µv.
The model assumes that free virus prey on T-cells with β1V X and β2V X1 as functional
responses respectively [5], tobacco smoking is treated as a disease and it is transmitted from one cell to another through contact; upon HIV infection, T-cells are assumed to be pro-ductively infected hence can produce free virus [26] and [29]; free virus are not affected by smoking; the contact between T-cells and free virus is through mass action principle. The state variables and parameters are defined in Tables 1, 2 respectively. The interaction between T-cells, smoking and free virus are shown by the Figure 1.
Table 1. Variables description
Variable Description
X Uninfected CD4+ T-cells
X1 Smoking impaired CD4+ T-cells due to smoking
X2 HIV infected CD4+ T-cells
Table 2. Parameters’ description
Parameter Description
Λ constant for CD4+ T-cells recruitment
k half saturation constant for the virus
γ rate of acquiring smoking impairment by CD4+ T-cells
µ natural mortality rate for CD4+ T-cells
β1 rate of HIV infection for uninfected CD4+ T-cells
β2 rate of HIV infection for impaired CD4+ T-cells
µ1 HIV induced death rate for CD4+ T-cells
µv natural mortality rate for free virus
α smoking induced death rate for impaired CD4+ T-cells
X
X
1 X2
V
Λ/(k+V)
β
1VX
γX
1X
β
2VX1
Nµ
1X2
(α+µ)X
1
β1VX+β
2VX2
µvV
(µ+µ
1)X2
Combining formulations and assumptions, the system that describes tobacco smoking effect on the HIV infection of T-cells is given by
dX dt =
Λ
k+V −β1V X−γX1X−µX,
(1a)
dX1
dt =γX1X−β2V X1−(α+µ)X1,
(1b)
dX2
dt =β1V X+β2V X1−(µ+µ1)X2,
(1c)
dV
dt =N µ1X2−β1V X−β2V X1 −µvV.
(1d)
2.1.1. Invariant Region. To obtain the region where solutions of the model system (1) are
feasible, we adopt the approach in [29] and the reference therein. The population for T-cells
denoted by XT and free virus V are considered where we have:
(2) XT =X+X1+X2.
dXT
dt < π−µXT, forπ =
Λ
k
The solution is given by:
XT ≤
π µ +
XT(0)−
π µ
e−µt
for XT(0) =X(0) +X1(0) +X2(0).
Analysis of the solution XT considers two cases; XT(0) >
π
µ and XT(0)< π µ.
(3)
for XT(0)>
π
µ; XT ≤ π µ ≤
π µ+
XT(0)−
π µ
e−µt and
for XT(0)>
π
µ; XT ≤ π µ+
XT(0)−
π µ
e−µt ≤ π
µ.
(4)
Since lim supt−→∞
XT(0)−
π µ
e−µt −→0,
lim supt−→∞XT ≤
π µ.
From the definition ofXT, it follows that:
(5) lim sup
t−→∞
X2 ≤
π µ
Substitution of equation(5) in (1d) leads to:
(6) lim sup
t−→∞
V ≤ N µ1π
µµv
Therefore we conclude that, the model system (1) is positive invariant in the region
(7) Γ ={(X, X1, X2, V)∈R4+ : 0≤X+X1+X2 ≤
π
µ, 0≤V ≤ N µ1π
µµv }
Solutions for the model system (1) which are starting on the boundary of the region Γ enter the interior of the region and remain bounded. Results for existence, uniqueness and continuity for the system (1) hold in the invariant region Γ. Since the model is well posed we can therefore consider the flow generated by the model system (1). The result is summarized in the following theorem:
Theorem 1. : All the solutions of the model system (1) enter the region
Γ ={(X, X1, X2, V)∈R4+ : 0≤X+X1+X2 ≤
π
µ, 0≤V ≤ N µ1π
µµv }
2.2. Disease free equilibrium and Reproduction number. We obtain disease free
equi-librium when X1 =X2 =V = 0 and it is given by
(8) E0(X, X1, X2, V) =
π
µ,0,0,0
.
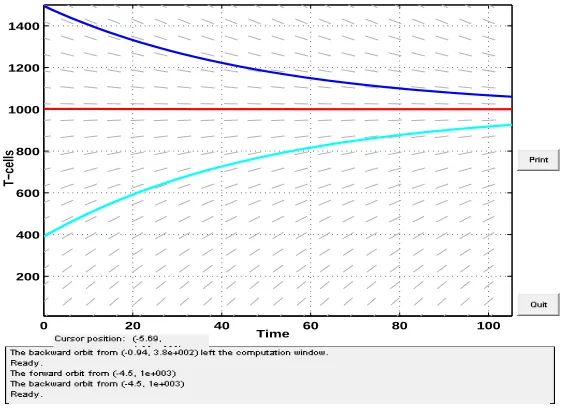
In the absence of tobacco smoking and HIV, T-cells within human host assume their normal growth and function. The body at this state can fight against any pathogen that plans an invasion. At disease free equilibrium, the system of equations (1) reduces to
(9) dX
dt =π−µX.
The graph of T-cells showing asymptotic growth behaviour in the infection free state using
parameters π= 20 and µ= 0.02 [24] is illustrated in Figure 2.
0 20 40 60 80 100 200
400 600 800 1000 1200 1400
Time
T−cells
2.2.1. Basic Reproduction number. To measure the effect of tobacco smoking in T-cells, the basic reproduction number which predicts the potentials of the disease [22] is computed . It determines how the two epidemics influence each other and which epidemic in particular accelerates the other. The basic reproduction number is defined as secondary infections caused by a single infected cell when introduced in the entirely susceptible population of
cells [33]. To compute basic reproduction number R0T, the next generation method as
described by van den Driessche and Watmough [31] is adopted. Using this approach, new
infections and transfer terms are denoted by Fi and Vi respectively. The basic reproduction
number R0T is given by:
(10) R0T =ρ F V−1
,
that is the maximum eigenvalue of the matrix F V−1, where
F = ∂Fi
∂Xj
(X0) and V =
∂Vi
∂Xj (X0)
Using the model system (1) and the approach in van den Driessche and Watmough [31], Fi
and Vi are defined as follows;
(11) Fi =
γX1X
β1V X+β2V X1
N µ1X2
and
(12) Vi =
(α+µ)X1
(µ+µ1)X2
µvV
whose eigenvalues λ satisfy the equation
(13) |F V−1−λI|= 0,
I is an identity matrix. The product of F V−1 is given
(14) F V−1 =
γπ
µ(α+µ) 0 0
0 0 β1π
µµv
0 N µ1
µ+µ1
0
Thus the basic reproduction number R0T is therefore given by
(15) R0T =M ax{R0T1, R0T2}.
where
(16) R0T1 =
γπ
µ(α+µ) and R0T2 =
s
N µ1β1π
µµv(µ+µ1)
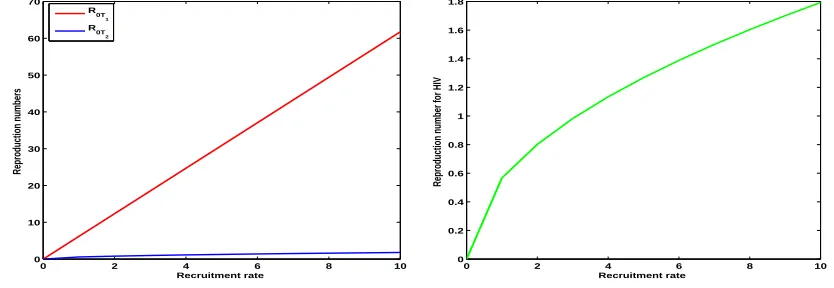
The partial reproduction numbers R0T1 and R0T2 are representing new infections due to
smoking and HIV respectively. R0T1 depends on smoking impairment rate, the average time
smoking impaired T-cell spends before death, life expectancy for T-cells and recruitment
of T-cells in the absence of free virus, R0T2 depends on the number of free virus which are
produced by T-cells’ replication, HIV virus infection rate, life expectancy of T-cells and free virus and the recruitment of T-cells in the absence of free virus.
We plot both partial reproduction numbers R0T1 and R0T2 against recruitment rate using
parameters in Table 3 to compare the two epidemics in case of producing new infections. As indicated in Figure 3, tobacco smoking produces many new infections compared to HIV infection.
0 2 4 6 8 10
0 10 20 30 40 50 60 70
Recruitment rate
Reproduction numbers
R 0T
1 R
0T 2
0 2 4 6 8 10
0 0.2 0.4 0.6 0.8 1 1.2 1.4 1.6 1.8
Recruitment rate
Reproduction number for HIV
Figure 3. Comparison of smoking and HIV new infections
2.3. Stability of Disease Free Equilibrium.
2.3.1. Local Stability of Disease Free Equilibrium. The basic reproduction number R0T
ob-tained by decomposition technique can be used to determine local stability of disease free
equilibrium [8]. Disease free equilibrium is locally stable if R0T < 1 and locally unstable if
R0T >1. From the definition of R0T in (15), R0T <1 will mean eitherR0T1 <1 orR0T2 <1.
R0T1 < 1 if smoking rate is low and R0T1 > 1 if smoking rate is high. In the same way
R0T2 < 1 if replication rate for T-cells is low and R0T2 > 1 if replication rate is high. To
analyze the local stability, we state and prove the following theorem:
Proof
To prove local stability of the model system (1), we linearize the system around a disease free equilibrium and obtain the following matrix:
(17) JE0 =
−µ −γπ
µ 0 −
π k −
β1π
µ
0 γπ
µ −α−µ 0 0
0 0 −(µ1 +µ)
β1π
µ
0 0 N µ1 −
β1π
µ −µv
For disease free equilibrium to be locally asymptotically stable, eigenvalues of Jacobian matrix should be negative. From the first and second columns of the Jacobian matrix we
obtain −µand γπ
µ −α−µwhich we re-write as;
(18) (α+µ)
γπ
µ(α+µ)−1
= (α+µ) (R0T1 −1).
It is negative if and only if
(19) R0T1 <1.
The Jacobian matrix (17) is now a 2×2 matrix;
(20) JE1 =
−(µ1+µ)
β1π
µ
N µ1 −
β1π
µ −µv
To establish local stability of disease free equilibrium, trace and determinant are computed. Local stability holds if the trace is negative and determinant is positive. Trace of the matrix
JE1 is given by
(21) trJE1 =−(µ1+µ)−
β1π
µ −µv <0.
The determinant of the matrixJE1 is:
(22) detJE1 =
β1π(µ+µ1)
µ +µv(µ+µ1)−
N µ1β1π
µ ,
which simplifies to
(23)
detJE1 = β1π
µvµ
+ 1−R20T2,
= β1π
µvµ
+ (1 +R0T2)(1−R0T2).
It follows that
From equations (19) and (24), disease free equilibrium is locally asymptotically stable when
R0T1 <1 andR0T2 <1. This completes the proof.
2.3.2. Global stability for Disease Free Equilibrium. Local stability of disease free equilibrium
gives the overview for the behaviour of the disease around the disease free equilibrium point. To provide comprehensive understanding for the behaviour of the disease beyond disease free equilibrium point, global stability analysis for disease free equilibrium point is carried out and we adopt the method in Castillo-Chavez et al. [3]. Using this method, the system (1) is re-written as
(25)
dXn
dt =C(Xn−Xdf e) +C1Xi, dXi
dt =C2Xi,
whereXn represents non-transmitting classes, Xi represents transmitting classes and Xdf e a
disease free equilibrium point respectively. C, C1 and C2 are matrices to be obtained from
the system (25). Global stability is guaranteed if eigenvalues of matrix C are negative and
C2 is a Metzler matrix [20] defined mathematically as C2(xij) ≥ 0 ∀i 6= j. Adopting the
form in equation (25), the system (1) is written as;
(26)
Λ
k+V −β1V X−γX1X−µX
=CX− π
µ
+C1
X1 X2 V and (27)
γX1X−β2V X1−(α+µ)X1
β1V X+β2V X1 −(µ1+µ)X2
N µ1X2−β1V X−β2V X1−µvV
=C2
X1 X2 V
MatrixC is 1×1 matrix and it is C =−µ with eigenvalue−µ. Matrix C1 is a 1×3 matrix
given by
C1 =
γπ
µ 0 − π k −
β1π
µ
Matrix C2 is also given by
(28) C2 =
γπ
µ −(α+µ) 0 0
0 −(µ1+µ)
β1π
µ
0 d −β1π
µ −µv
where d = N µ1. The matrix (28) has non-negative off diagonal elements and all diagonal
elements are negative except γπ
µ −(α+µ) which is further written as
(29)
γπ
µ −(α+µ) = (α+µ) (R0T1 −1),
(α+µ) (R0T1 −1)<0, iff R0T1 <1.
R0T1 < 1 implies low smoking rate and R0T1 > 1 high smoking rate. From this findings
it is seen that low smoking rate guarantees global stability of disease free equilibrium and high smoking rate renders global instability of disease free equilibrium. These findings are summarized in the following theorem:
Theorem 3. : The disease free equilibrium is globally asymptotically stable if R0T1 <1 and
it is globally unstable if R0T1 >1.
2.4. Endemic Equilibrium. To determine how the two epidemics interact within the host, we compute the endemic equilibrium and derive the condition for its stability. To compute endemic equilibrium, system (1) is written in the following form:
Λ
k+V −β1V X−γX1X−µX = 0,
(30a)
γX1X−β2V X1−(α+µ)X1 = 0,
(30b)
β1V X+β2V X1−(µ+µ1)X2 = 0,
(30c)
N1µ1X2−β1V X−β2V X1−µvV = 0. (30d)
Beginning with equation (30b), we have
(31)
γX1X−β2V X1−(α+µ)X1 =X1[γX−β2V −(α+µ)] = 0,
X1∗ = 0, X∗ = β2V
∗+u
1
γ , u1 =α+µ.
X1∗ = 0 represents disease free equilibrium when V1∗ = 0. To obtain X1∗ we substituteX∗ in
(30a) where the equation now becomes
Λ
k+V −β1V
β2V∗+u1
γ
−X1(β2V∗+u1)−µ
β2V∗+u1
γ
= 0,
X1∗ = Λ (k+V∗)(β
2V∗+u1)
−β2V
∗+µ
γ ,
In a simplified form, we have
(32) X1∗ = Λγ−(k+V
∗)(β
2V∗+u1)(β1V∗+µ)
γ(k+V∗)(β
2V∗+u1)
.
From equation (30c), we can obtain X2∗ as follows;
(33) X2∗ = β1V
∗X∗+β
2V∗X1∗
u2
Substitution of X∗ and X1∗ into equation (33) results into the expression forX2∗
(34) X2∗ = (k+V
∗)(β
2V∗+u1) + (u1β1−µβ2)V∗+ Λγβ2V∗
u2γ(k+V∗)(β2V∗+u1)
All variables,X∗,X1∗ andX2∗ are in terms ofV∗. To findV∗,X∗,X1∗ andX2∗ are substituted in equation (30d) where we obtain
(35)
d(k+V∗)(β2V∗+u1)(u1β1−µβ2)V∗+ Λγβ2V∗
u2γ(k+V∗)(β2V∗+u1)
− β1V
∗(β
2V∗+u1)
γ
+β2V
∗(k+V∗)(β
1V∗+µ)(β2V∗+u1)−Λγβ2V∗
γ(k+V∗)(β
2V∗+u1)
−µvV∗ = 0.
Expansion and rearrangements of terms in equation (35) yields a third degree polynomial in variable V∗;
(36) aV∗3+bV∗2+cV∗ = 0,
written as
(37)
V∗[aV∗2+bV∗+c] = 0,
a=β2[(d−u2)(u1β1−µβ2)−γµvu2],
b= (kβ2+u1)[(u1β1−µβ2)(d−u2)−γµvu2],
c= (d−u2)[γΛβ2+u1k(u1β1−µβ2)]−γµvu1u2k.
V∗ = 0 represents disease free equilibrium when X1∗ = 0. The equation
(38) aV∗2+bV∗+c= 0,
represents endemic equilibrium. Using general quadratic formula in equation (38),
V∗ = −b+ √
b2−4ac
2a .
V∗ >0 iff −b+ √
b2 −4ac
2a >0, and
−b+√b2−4ac
2a >0 iff ac <0.
ac <0 iff a <0 or c <0.
(39)
a <0 iff γµvu2
(d−u2)(u1β1−µβ2)
>1 or
c <0 iff γ
µvu2
(u1β1−µβ2)(d−u2)
− Λβ2
u1k(u1β1−µβ2)
>1
From equation (39),a <0 if there is high smoking impairment rateγ and low HIV infection
rate β2 for smoking impaired T-cells and c < 0 if there is high smoking impairment rate γ
and high HIV infection rateβ2 for smoking impaired T-cells. Therefore either a <0 orc <0
but not both. Endemic equilibrium is defined by the set Γ∗ such that
where the values ofX∗,X1∗ andX2∗ in terms ofV∗ are given in equations (31), (32) and (34). This result is summarized in the following theorem:
Theorem 4. : High smoking impairment rate provides the necessary condition for endemic equilibrium Γ∗ ={X∗, X1∗, X2∗, V∗} of model system (1) to exist.
2.4.1. Global stability of endemic equilibrium. Stability analysis explores the behaviour of
the epidemic near the equilibrium points. Solutions which start near the equilibrium point and remain near for all times are stable solutions and represent a stable behaviour of the epidemic. Solutions which start near the equilibrium point and converge to the equilibrium point are asymptotically stable and they represent asymptotically stable behaviour of the epidemic. The solution which show neither of the two behaviours represent unstable be-haviour of the epidemic.
The Lyapunov method and LaSalle’s invariance principle have been widely used to investi-gate the stability of epidemics. Using Lyapunov method and LaSalle’s invariance principle different functions are constructed depending on the types of the models formulated.
Logarithmic Lyapunov function [7] was developed to analyze stability of Lotka-Volterra
systems. Korobeinikov [15] used it to analyze stability for SIS, SIR and SIRS models.
Vargas-De-Leon [32] used composite quadratic Lyapunov function to prove global stability
for SIS, SIR and SIRS models and Korobeinikov [13] and [14] used explicit Lyapunov
function to analyze SEIR and SEIS epidemic models.
To analyze the endemic equilibrium for the model system (1), we adopt explicit Lyapunov function
(41) H(yi) =
n
X
i=1
wi(yi−y∗i lnyi)
wherewi are constants that are to be carefully selected,yi represents number of cells in class
i and yi∗ represents equilibrium state in class i. According to the approach in McCluskey
[18], using the model system (1) we now define the explicit Lyapunov function
H :{(X, X1, X2, V)∈Γ :X, X1, X2, V >0} →R by;
(42) H(X, X1, X2, V) = w1(X−X
∗lnX) +w
2(X1−X1∗lnX1)
+w3(X2−X2∗lnX2) +w4(V −V∗lnV).
We assume that fori= 1, ...,4wi >0, functionHand allwi are continuous and differentiable
in Γ. The value of the function H in Γ∗ is zero.
equation
(43)
dH
dt =w1
1− X
∗
X
dX dt +w2
1−X
∗
1
X1
dX1
dt +w3
1− X
∗ 2 X2 dX2 dt
+w4
1− V
∗
V
dV dt ,
which further gives;
(44)
dH
dt =w1
1−X
∗
X
[ Λ
k+V −β1V X−γX1X−µX]
+w2
1−X
∗
1
X1
[γX1X−β2V X1−(α+µ)X1]
+w3
1−X
∗
2
X2
[β1V X+β2V X1−(µ+µ1)X2]
+w4
1−V
∗
V
[N µ1X2−β1V X−β2V X1 −µvV],
At endemic equilibrium, equation (44) becomes;
(45)
dH
dt =w1
1− X
∗
X
[β1V∗X∗+γX1∗X∗+µX∗ −β1V X−γX1X−µX]
+w2
1− X
∗
1
X1
[β2V∗X1∗−(α+µ)X1∗−β2V X1−(α+µ)X1]
+w3
1− X
∗
2
X2
[(µ+µ1)X2∗−(µ+µ1)X2]
+w4
1− V
∗
V
[β1V∗X∗+β2V∗X1∗ +µvV∗−β1V∗X∗−β2V∗X1∗
−µvV∗].
Rearrangement of terms and further simplification gives
(46)
dH
dt =−w1µ
(X−X∗)2
X −w2(α+µ)
(X1−X1∗) 2
X1
−w3(µ+µ1)
(X2−X2∗) 2
X2
−w4µv
(V −V∗)2
V
−w1β1
(X−X∗) (V X−V∗X∗)
X −w1γ
(X−X∗) (X1X−X1∗X
∗)
X
−w2β2
(X1 −X1∗) (V X1−V∗X1∗)
X1
−w4β1
(V −V∗) (V X−V∗X∗)
V
−w4β2
(V −V∗) (V X1−V∗X1∗)
V ,
which is written as
(47)
dH
dt =−w1µ
(X−X∗)2
X −w2(α+µ)
(X1−X1∗) 2
X1
−w3(µ+µ1)
(X2−X2∗) 2
X2
−w4µv
(V −V∗)2
V +F(Γ).
where
and
F(Γ) =−w1β1
(X−X∗) (V X−V∗X∗)
X −w1γ
(X−X∗) (X1X−X1∗X
∗)
X
−w2β2
(X1−X1∗) (V X1−V∗X1∗)
X1
−w4β1
(V −V∗) (V X−V∗X∗)
V
−w4β2
(V −V∗) (V X1−V∗X1∗)
V .
According to McCluskey [18] and Korobeinikov [14]F(Γ) is non-positive in Γ and therefore
F(Γ)≤0 for all Γ. The derivative dH
dt ≤0 in Γ, equality holds when Γ = Γ
∗. Since dH
dt ≤0
for all Γ and dH
dt = 0 when Γ = Γ
∗, it means that the largest invariant set in Γ when dH
dt = 0
is a singleton{Γ∗}which is the endemic equilibrium. Hence by LaSalle’s invariance principle
[16] and [17] it means that the endemic equilibrium point Γ∗ is asymptotically stable in Γ
when R0T >1. This result is summarized in the Theorem 5:
Theorem 5. : Endemic equilibrium of the model system (1) is globally asymptotically stable when R0T >1 and it is globally asymptotically unstable otherwise.
3. Numerical simulations
To accomplish the findings of this study, numerical simulations are carried out to analyze the long term behaviour of the two epidemics. Analytical results show that tobacco smoking has devastating effect to HIV infection of T-cells. High smoking rate provides a condition for endemic equilibrium to exist. Stability analysis of disease free equilibrium shows that tobacco smoking provides necessary condition for local and global stability of disease free equilibrium.
To study further the effect of tobacco smoking on the HIV infection of T-cells, the gen-eral dynamics is examined to reveal the features for the epidemics in T-cells. Then the specific features which give the overall behaviour for the two epidemics are highlighted.
The life expectancy of a HIV infected patient according to Nakagawa et al.[21], is 9-10 years from primary infection. We will use this time span in our simulations. However, to critically study provide a clear picture of the two epidemics, we will increase the time span to 20-30 years. The parameter values from the literature are used. According to Kirshner
and Webb (1997), the normal recruitment of CD4+ T-cells is 10/mm3 per day as also seen
in [29] and [34]. However, due to HIV infection this rate falls from 10/mm3 per day to
3/mm3 per day [12]. In this work the recruitment of 3/mm3 per day which is for a person
Table 3. Parameter Values
Parameter Description Value Source
Λ constant for CD4+ T-cells recruitment 1095 year−1 [12]
k Half saturation constant 12 [5]
β1 HIV infection rate for T-cells 0.000292
ml
virus year [1]
γ Smoking impairment rate for T-cells 0.0025year−1 [9]
µ natural mortality rate for T-cells 0.02 year−1 [35]
β2 HIV infection rate for impaired T-cells 0.0019
ml
virus year [9]
µ1 HIV induced mortality 0.0245year−1 [9]
µv natural mortality rate for virus 10year−1 [24]
α Smoking induced mortality 0.00024year−1 [9]
The general dynamics of HIV in T-cells in the presence of tobacco smoking is plotted in Figure 4. It reveals that smoking impairment grows faster within the first five years. HIV infection raises when smoking impairment is on the decline. At this point, the uninfected T-cells decline dramatically and reach their lowest value as portrayed by Figure 4.
0 2 4 6 8 10
0 100 200 300 400 500 600 700 800 900 1000
Time[years]
Population
Uninfected T−cells Smoking impaired HIV infected T−cells Free Virus
0 2 4 6 8 10
0 100 200 300 400 500 600 700 800 900
Time [years]
Uninfected and Smoking impaired T−cells
Uninfected T−cells Smoking impaired
Figure 4. Variation of T-cells in the presence of smoking and HIV
0 2 4 6 8 10 0
100 200 300 400 500 600 700 800
Time [years]
Impaired and HIV infected T−cells
Smoking impaired HIV infected T−cells
0 100 200 300 400 500 600 700 800 0
100 200 300 400 500 600 700 800
HIV infected T−cells
Smoking impaired T−cells
Figure 5. Variation of Smoking impaired and HIV infected T-cells with
re-spect time and Variation of smoking impaired T-cells with HIV infected T-cells
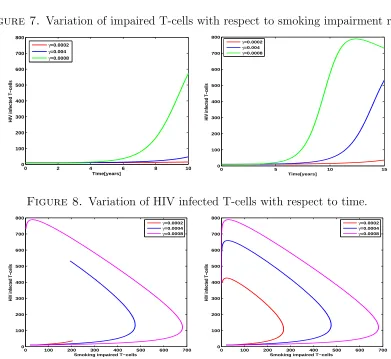
Smoking impairment rate is then varied to see its effect on the dynamics of HIV in T-cells. Our aim in this case is to observe how does this variation affects uninfected T-cells, smoking impaired T-cells and HIV infected T-cells. We also look at the relationship between impaired T-cells and HIV infected T-cells and the corresponding effect on free virus.
The uninfected T-cells decrease as smoking impairment rate increases, free virus also increase per smoking impairment increase as demonstrated in Figure 6. Decreasing of the uninfected T-cells and increasing of free virus can worsen T-cells’ profile and pave a way for various infections which can accelerate HIV infection to the disease stage AIDS and ultimately death of the human host.
0 5 10 15 20
0 200 400 600 800 1000 1200
Time[years]
Uninfected T−cells
γ=0.0002
γ=0.0004
γ=0.0008
0 5 10 15
0 100 200 300 400 500 600
Time [years]
Free virus
γ=0.0002
γ=0.0004
γ=0.0008
Figure 6. Variation of uninfected T-cells and free virus with smoking
im-pairment rate.
T-cells because as smoking impairment rate increases there is a corresponding increase in HIV infected T-cells as demonstrated by Figures 8 and 9.
0 2 4 6 8 10
0 100 200 300 400 500 600 700 Time [years]
Smoking impaired T−cells
γ=0.0002
γ=0.0004
γ=0.0008
0 5 10 15 20 25 30
0 100 200 300 400 500 600 700 Time [years]
Smoking impaired T−cells
γ=0.0002
γ=0.0004
γ=0.0008
Figure 7. Variation of impaired T-cells with respect to smoking impairment rate.
0 2 4 6 8 10
0 100 200 300 400 500 600 700 800 Time[years]
HIV infected T−cells
γ=0.0002
γ=0.004
γ=0.0008
0 5 10 15
0 100 200 300 400 500 600 700 800 Time[years]
HIV infected T−cells
γ=0.0002
γ=0.004
γ=0.0008
Figure 8. Variation of HIV infected T-cells with respect to time.
0 100 200 300 400 500 600 700 0 100 200 300 400 500 600 700 800
Smoking impaired T−cells
HIV infected T−cells
γ=0.0002
γ=0.0004
γ=0.0008
0 100 200 300 400 500 600 700 0 100 200 300 400 500 600 700 800
Smoking impaired T−cells
HIV infected T−cells
γ=0.0002
γ=0.0004
γ=0.0008
Figure 9. Variation of HIV infected T-cells with respect to smoking impaired
T-cells.
4. Discussion and Concluding remarks
is computed. At disease free equilibrium, T-cells grow asymptotically. The basic
reproduc-tion number which is given as the maximum of partial reproductive numbersR0T1 and R0T2
shows that among the two epidemics tobacco smoking produces many new infections in T-cells compared to HIV infection as demonstrated by the Figure 3.
Analytical result shows that, equilibrium states (disease free and endemic equilibriums) exist and smoking affects the existence of endemic equilibrium. Stability analysis of the
equilibrium states shows that; when R0T1 < 1 and R0T2 < 1 disease free equilibrium is
lo-cally asymptotilo-cally stable and it is globally stable when there is low smoking rate for which
R0T1 <1. WhenR0T1 >1 which implies there is high smoking impairment rate andR0T2 >1
which implies there is high HIV infection rate, the endemic equilibrium is globally stable.
The model is numerically simulated to study the effect of tobacco smoking. We observe that as tobacco smoking impairment rate increases, uninfected T-cells reduces dramatically, HIV infected T-cells and free virus increase significantly. Decreasing of uninfected T-cells is due to smoking impairment and HIV infection. HIV infection of uninfected T-cells and smoking impaired T-cells results into many HIV infected T-cells which replicate to release free virus. As many T-cells are impaired by tobacco smoking, HIV infected T-cells increase correspondingly. This is due to the fact that smoking induced anergy affects the normal functioning of T-cells by making them unresponsive and easily attacked by HIV. This is reflected by increase of HIV infected T-cells when smoking impairment rate increases as depicted by the Figure 8.
Reduction of uninfected T-cells and increase of HIV infected T-cells and free virus present a compromised immune system for which a host is exposed to opportunistic infections [6] such as tuberculosis, oral candidiasis [4] and cancer. Tobacco smoking can therefore promote HIV infections in T-cells and deteriorate the T-cells’ profile as proposed by Valiathan et al.[30]. For individuals living with HIV to live longer and improve the quality of life, the study calls for smoking cessation programs to emphasize the importance of abstinence from tobacco smoking and other risk behaviours.
Conflict of interests
The authors declare that there is no conflict of interests.
Acknowledgment
References
[1] Adams, B.M., Banks, H.T., Da vidian, M., Hee-Dae Kwon , Tran, H.T., Wynne, S.N., and Rosenberg, E.S. HIV dynamics: Modeling, data analysis, and optimal treatment protocols. Journal of Computa-tional and Applied Mathematics184 (2004) 10-49.
[2] Burkhalter, J. E., Springer, C. M., Chhabra, R., Ostroff, J. S., and Rapkin, B. D., Tobacco use and readiness to quit smoking in low-income HIV-infected persons.Nicotine & Tobacco Research, 7 (2005), 511-522.
[3] Castillo-Chavez, C., Feng, Z. and Huang, W. (2002). Mathematical Approaches for Emerging and Re-emerging Infectious Diseases, An Introduction. Springer Verlag.
[4] Chattopadhyay, A., and Patton, L. L. Smoking as a risk factor for oral candidiasis in HIV-infected adults.Journal of Oral Pathology & Medicine, 42 (2013), 302-308.
[5] Das, P., Mukherjee, D., Sen, A., Mukandavire, Z., and Chiyaka, C. Analysis of an In-host Model for HIV Dynamics with Saturation Effect and Discrete Time Delay.Nonlinear Dynamics and Systems Theory, 11 (2)(2011) 125-136.
[6] Duffin, R. P., and Tullis. R. H. Mathematical Models of the Complete Course of HIV Infection and AIDS.Journal of Theoretical Medicine, 4 (4) (2002), 215-221.
[7] Goh, B.-S. (1980).Management and analysis of biological. Elsevier Science, Amsterdam.
[8] Hove-Musekwa, S.D. and Nyabadza, F. The dynamics of an HIV/AIDS model with screened disease carriers.Computational and Mathematical Methods in Medicine, 10 (2009), 287-305.
[9] Irunde, J.I., Luboobi, L.S. and Nkansah-Gyekye, Y., Modeling the effect of tobacco smoking on the in-host dynamics of HIV/AIDS.Journal of Mathematical and Computational Science, 6(3) (2016), 406-436.
[10] Jiang, H., and Chess, L., Regulation of immune responses by T cells.New England Journal of Medicine, 354 (2006), 1166-1176.
[11] Kalra, R. and Singh, S. P., Savage, S. M., Finch, G. L. and Sopori, M. L. Effects of cigarette smoke on immune response: chronic exposure to cigarette smoke impairs antigen-mediated signaling in T cells and depletes IP3-sensitive Ca2+ stores. Journal of Pharmacology and Experimental Therapeutics, 293 (2000), No. 1, 166-171.
[12] Kirschner, D. E., and Webb, G. F. A mathematical model of combined drug therapy of HIV infection. Computational and Mathematical Methods in Medicine, 1 (1997), 25-34.
[13] Korobeinikov, A. Lyapunov functions and global properties for SEIR and SEIS epidemic models. Math-ematical Medicine & Biology: A Journal of the IMA, 21 (2004), No.2.
[14] Korobeinikov, A. Global properties of infectious disease models with nonlinear incidence.Bulletin of Mathematical Biology69 (2007), 1871- 1886.
[15] Korobeinikov, A. and Wake, G. C. Lyapunov functions and global stability for SIR, SIRS, and SIS epidemiological models.Applied Mathematics Letters15 (2002), 955-961.
[16] LaSalle, J. P.The stability of dynamical systems, Philadelphia. SIAM, (1976).
[17] LaSalle, J. P. and Lefschetz, S.The stability by Lyapunov-s direct method, New York. Academic, (1961). [18] McCluskey, C. C., Lyapunov functions for tuberculosis models with fast and slow
progres-sion.Mathematical Biosciences and Engineering, 3(4) (2006), 603-614.
[20] Mlay, G. M., Luboobi, L. S., Kuznetsov, D., and Shahada, F. The role of re-infection in modelling the dynamics of one strain tuberculosis involving vaccination and treatment.Asian Journal of Mathematics and application2014 (2014), 2307-7743.
[21] Nakagawa, F., May, M., and Phillips, A. . Life expectancy living with HIV: recent estimates and future implications.Current opinion in infectious diseases, 26 (2013), 17-25.
[22] Nishiura, H., Correcting the actual reproduction number: a simple method to estimate R0 from early epidemic growth data.International journal of environmental research and public health, 7 (2010), 291-302.
[23] Perelson, A. S., and Nelson, P.W. Mathematical Analysis of HIV-I Dynamics in Vivo. Society for Industry and Applied Mathematics, 41 (1999), No.1, 3-44.
[24] Perelson, A.S., and Kirschner, D.E., and De Boer, R., Dynamics of HIV infection of CD4+ T cells.Mathematical biosciences, 114 (1993), 81-125.
[25] Robinson, W., Moody-Thomas, S., Gruber, D., Patient perspectives on tobacco cessation services for persons living with HIV/AIDS.AIDS care, 24 (2012), 71-76.
[26] Rong, L., Gilchrist, M. A., Feng, Z., and Perelson, A.S., Modeling within-host HIV-1 dynamics and the evolution of drug resistance: trade-offs between viral enzyme function and drug susceptibility.Journal of Theoretical biology, 247 (2007), 804-818.
[27] Sopori, M., Effects of cigarette smoke on the immune system.Nature Reviews Immunology, 2 (2002), No 5, 372-377.
[28] Sopori, M.L., and Kozak, W., Immunomodulatory effects of cigarette smoke.Journal of neuroimmunol-ogy, 83 (1998), 148-156.
[29] Srivastava, P.K., Banerjee, M., and Chandra, P., Modeling the drug therapy for HIV infection.Journal of Biological Systems. 17 (2009), 213-223.
[30] Valiathan, R., Miguez, M. J., Patel, B., Arheart, K. L., and Asthana, D. Tobacco Smoking Increases Immune Activation and Impairs T-Cell Function in HIV Infected Patients on Antiretrovirals: A Cross-Sectional Pilot Study.PLOS ONE, 9(2014), Issue 5.
[31] van den Driesche, P. and Watmough, J. Reproduction numbers and sub-threshold endemic equilibria for compartmental models of disease transmission.Mathematical Biosciences, 180 (2002): 29-48. [32] Vargas-De-Leon, C. Constructions of lyapunov functions for classic SIS, SIR and SIRS epidemic models
with variable population size.Revista Electr-onica Foro Red. Mat.26 (2009), 1-12.
[33] Wang, L. and Li, M.Y. Mathematical analysis of the global dynamics of a model for HIV infection of CD4+ T cells.Mathematical Biosciences, .200 (2006), 44-57.
[34] Wang, Y., and Zhou, Y. Mathematical modeling and dynamics of HIV progression and treatment. Chinese Journal of Engineering Mathematics, 27 (2010), 534-548.
[35] Wang, X., and Song, X. Global stability and periodic solution of a model for HIV infection of CD4+ T cells.Applied Mathematics and Computation, 89 (2007), N0.2, 1331-1340.
[36] Webb, M. S., Vanable, P. A., Carey, M. P., and Blair, D. C., Cigarette smoking among HIV+ men and women: examining health, substance use, and psychosocial correlates across the smoking spectrum. Journal of behavioral medicine, 30 (2007), 371-383.
[37] Zavitz, C. J., Gaschler, G. J., Robbins, C. S., Botelho, F. M., Cox, P. G., and Stampfli, M. R., Impact of cigarette smoke on T and B cell responsiveness.Cellular immunology, 253 (2008), 38-44.
[38] Zhu, J., and Paul, W.E., CD4 T cells: fates, functions, and faults.Blood, 112 (2008), 1557-1569.
Livingstone S. Luboobi, Makerere University, Box 7062, Kampala, Uganda