ARTIGO ORIGINAL
RESUMO
Introdução: O diagnóstico de síndrome de Cushing continua a ser um desafio complexo. Apesar do cortisol salivar noturno ser utilizado como teste de rastreio, a definição de um valor diagnóstico deverá ser individualizada.
Material e Métodos: Foram estudados 3 grupos: voluntários saudáveis, com suspeita clínica e com diagnóstico estabelecido de Síndrome de Cushing. O doseamento de cortisol salivar foi realizado por eletroquimioluminescência automatizado. A definição do ponto-de-corte foi obtida pela curva Receiver Operating Characteristic e índice J de Youden.
Resultados: Entre os 127 indivíduos, 57 pertenciam ao grupo de voluntários saudáveis, 39 com suspeita clínica e 31 com diagnóstico estabelecido. O percentil 2,5 – 97,5 de cortisol salivar noturno no grupo de voluntários saudáveis foi 0,054 – 0,1827 μg/dL. A análise da curva Receiver Operating Characteristic revelou uma área abaixo da curva de 0,9881 (p < 0,0001) e o ponto-de-corte de 0,1 μg/ dL com sensibilidade de 96,77% e especificidade de 91,23%. Verificou-se uma correlação significativa entre cortisol salivar noturno e o cortisol sérico noturno (R = 0,6977; p < 0,0001), bem como, com cortisol livre urinário (R = 0,5404; p = 0,0025) no grupo com diagnóstico estabelecido.
Discussão: A concentração média ± DP cortisol salivar noturno no grupo com diagnóstico estabelecido (0,6798 ± 0,52 μg/dL) foi significativamente superior aos restantes grupos. Na nossa população, o valor de ponto-de-corte foi de 0,1 μg/dL com elevada sensibilidade e especificidade.
Conclusão: Os resultados demonstram uma excelente acurácia do cortisol salivar noturno. Dada a sua conveniência e elevada exatidão, o doseamento de cortisol salivar noturno poderá ser adicionado aos testes de rastreio tradicionais para estudo de hipercortisolismo.
Palavras-chave: Hydrocortisona; Ritmo Circadiano; Saliva; Síndrome de Cushing/diagnóstico; Técnicas de Diagnóstico Endócrino
Late-Night Salivary Cortisol: Cut-Off Definition and
Diagnostic Accuracy for Cushing’s Syndrome in a
Portuguese Population
Cortisol Salivar Noturno: Definição de Ponto de Corte
e Valor Diagnóstico na Síndrome de Cushing numa
População Portuguesa
1. Endocrinology, Diabetes and Metabolism Department. Coimbra Hospital and University Center. Coimbra. Portugal. 2. Clinical Pathology Department. Coimbra Hospital and University Center. Coimbra. Portugal.
3. School of Health Sciences. Polytechnic Institute of Leiria. Leiria. Portugal.
4. Family Health Unit from Condeixa. Agrupamento de Centros de Saúde do Baixo Mondego, Administração Regional de Saúde do Centro. Condeixa-A-Nova. Portugal. 5. Faculty of Medicine. University of Coimbra. Coimbra. Portugal.
Autor correspondente: Adriana De Sousa Lages. [email protected]
Recebido: 06 de setembro de 2018 - Aceite: 10 de janeiro de 2019 | Copyright © Ordem dos Médicos 2019
Adriana De Sousa LAGES1, João Gonçalo FRADE2,3, Diana OLIVEIRA1, Isabel PAIVA1, Patrícia OLIVEIRA1, Alexandre REBELO-MARQUES4,5, Francisco CARRILHO1
Acta Med Port 2019 May;32(5):381-387 ▪ https://doi.org/10.20344/amp.11265 ABSTRACT
Introduction: Diagnosis of Cushing’s syndrome remains a challenge in clinical endocrinology. Even though late-night salivary cortisol is used as screening tool, individualized cut-off levels for each population must be defined.
Material and Methods: Three groups of subjects were studied: normal subjects, suspected and proven Cushing’s syndrome. Salivary cortisol was measured using an automated electrochemiluminescence assay. The functional sensitivity of the assay is 0.018 μg/dL. The diagnostic cut-off level was defined by Receiver Operating Characteristic curve and Youden’s J index.
Results: We studied 127 subjects: 57 healthy volunteers, 39 patients with suspected and 31 with proven Cushing’s syndrome. 2.5th - 97.5th percentile of the late-night salivary cortisol concentrations in normal subjects was 0.054 to 0.1827 μg/dL. Receiver Operating Characteristic curve analysis showed an area under the curve of 0.9881 (p < 0.0001). A cut-off point of 0.1 μg/dL provided a sensitivity of 96.77% (95% CI 83.3 - 99.92%) and specificity of 91.23% (95% CI 80.7 - 97.09%). There was a significant correlation between late-night salivary cortisol and late-late-night serum cortisol (R = 0.6977; p < 0.0001) and urinary free cortisol (R = 0.5404; p = 0.0025) in proven Cushing’s syndrome group.
Discussion: The mean ± SD late-night salivary cortisol concentration in patients with proven Cushing’s syndrome (0.6798 ± 0.52 μg/ dL) was significantly higher (p < 0.0001). In our population, the late-night salivary cortisol cut-off was 0.1 μg/dL with high sensitivity and specificity.
Conclusion: Late-night salivary cortisol has excellent diagnostic accuracy, making it a highly reliable, noninvasive, screening tool for outpatient assessment. Given its convenience and diagnostic accuracy, late-night salivary cortisol may be added to other traditional screening tests on hypercortisolism.
Keywords: Circadian Rhythm; Cushing Syndrome/diagnosis; Diagnostic Techniques, Endocrine; Hydrocortisone; Saliva
INTRODUCTION
Considering the increasing worldwide prevalence of metabolic syndrome, there is a growing need to effectively screen patients for secondary causes of obesity, namely
ARTIGO ORIGINAL An ideal screening test should be specific enough to avoid false positives, in order to minimize their associated
cost and morbidity, and sensitive enough to classify as posi-tives those persons with the disease.2
The latest Endocrine Society clinical practice guidelines on the diagnosis of CS recommend the use of one from four screening tests: 24-hours urinary free cortisol (UFC) - at least two measurements, 1mg overnight dexamethasone suppression test (DST), late-night salivary cortisol (LNSaC) -two measurements- and longer low-dose DST (2 mg/day for 48 hours) as initial screening tests.3
The lack of invasiveness, convenience and simplicity of the LNSaC justify a growing interest in applying it to a wide range of patients in daily clinical practice and has been used recently by many centres as a first line diagnostic test for CS.
The definition of the LNSaC cut-off level is highly depend-ent on the performance of the laboratory assay used: radio-immunoassay (RIA), automated electrochemiluminescence immunoassays (ECLIAs) or, more recently, liquid chromatog-raphy-tandem mass spectrometry (LC-MS/MS).4-12
Moreover, the need to define an individualized cut-off level for each population motivated our study since there is only one published study from Portugal using RIA.13 Therefore, our goals were to compare the functional ca-pacity of LNSaC, measured by an ECLIA assay, with other screening tests such as 24-h UFC and late-night serum cor-tisol (LNSeC); to establish the reference range for LNSaC concentration in a Portuguese population sample, as well as to evaluate its usefulness in the diagnosis of CS.
MATERIAL AND METHODS Subjects
The study was conducted in the Endocrinology Depart-ment inpatient clinic of a tertiary Portuguese hospital centre. Patients were enrolled from July 2014 to August 2016. Data were collected from patients with clinical suspicion of hyper-cortisolism at ward admission. All participants gave written informed consent to participate in the study.
Three groups of subjects were enrolled: (a) normal healthy individuals and (b) patients attending the inpatient clinic with ages between 18 - 65 years who were either (b1) referred for suspected hypercortisolism on the basis of clini-cal features or with discordant ambulatory screening tests results or (b2) proven to have CS based on laboratory and histology findings.
Normal subjects
Normal subjects (or control/healthy group) were studied to establish the LNSaC reference range for the used assay. Medical and paramedical professionals from the Endo-crinology Department and Clinical Pathology Department as well as primary care patients from a local Family Health Unit were invited to participate.
All the subjects included in the control group answered a brief questionnaire about past medical history and current medication. They were asymptomatic, apparently healthy
and with regular menses (in the case of pre-menopausal women).
We excluded volunteers who fulfilled the following cri-teria: other known endocrine condition (diabetes mellitus, thyroid disease or polycystic ovary syndrome); chronic pain condition; alcoholism; active smoking; pregnancy; chronic kidney or liver disease; psychiatric illness; shift workers and those on current medical therapy with levothyroxine, gluco-corticoids (including topic and nasal formulations), insulin and anticonvulsivants.
Patients with proven CS
For patients with at least one abnormal screening tests or for whom the pre-test probability was high, an inpatient evaluation was scheduled to repeat the abnormal test previ-ously performed and complement the evaluation with a cor-tisol circadian rhythm (serum corcor-tisol and adrenocorticotro-phin hormone (ACTH) levels at 23/00 hours and 8/9 hours), longer low-dose DST or CRH test. The aetiological diagno-sis of CS was based on plasma ACTH concentration which guided the imagiological evaluation. An ACTH > 20 pg/mL with concomitant increased serum cortisol was considered suggestive of ACTH-dependent CS and subsequently justi-fied a CRH test. An elevation of at least 50% in ACTH and 20% in cortisol after CRH infusion was suggestive of a pi-tuitary source and justified pipi-tuitary gland imaging. If an ec-topic source was suspected, especially with highly elevated levels of ACTH with no response on CRH test, thoracic/ab-dominal imaging was performed by magnetic resonance im-aging (MRI) or computed tomography (CT) scan or also by positron emission tomography (PET) scan in rarer cases. In contrary, an ACTH< 5 pg/mL associated with an elevat-ed cortisol level was suggestive of ACTH-independent CS source and led to adrenal investigation.3,14
The patients included in the ‘proven CS’ group were pa-tients subjected to surgical intervention and with histological findings confirming CS diagnosis.
Patients with suspected CS
Subjects included in the ‘suspected CS’ group were referred to the Endocrinology Department due to clinical manifestations (visceral obesity, diabetes or glucose intol-erance, hypertension, menstrual irregularities, low bone density) or presence of signs/symptoms highly suggestive of hypercortisolism (purple striae, ecchymoses or proximal myopathy) with, at least, one abnormal positive screening test.
Patients undergoing investigation due to the presence of adrenal or pituitary incidentalomas were also included in this group.
The diagnosis of CS was not confirmed after additional inpatient investigation in these patients.
Saliva collection and storage
ARTIGO ORIGINAL Written recommendations were delivered to each
partici-pant along with a written participation consent.
Absence of physical exercise for at least three hours before sample collection, delicate tooth brushing and avoid-ance of cigarette smoking on the day of sampling was ad-vised. It was explained to the participants that they should gently chew the cotton inside the Salivetteã device for two to three minutes.
When collected at home, the devices were stored at room temperature until delivery to the investigator on the next day and then directly to the laboratory.
For patients evaluated during hospitalization, samples were collected on the second and third day at the ward and sent to the laboratory in the next morning.
Samples were centrifuged at 2000 - 2500 rpm for three to five minutes, the cotton swab removed, and the clear ef-fluent stored at -20ºC until assayed by the same laboratory technician.
Only 50 μL of saliva were required for the analysis.
Laboratory assay
Salivary cortisol was measured by automated ECLIA on a Roche® Elecsys 2010 automated analyser, a com-petitive polyclonal antibody immunoassay that employs a magnetic separation step followed by electrochemilumines-cence quantitation. The cortisol in the biological sample is detached from the cortisol-binding globulin by danazol. The detached cortisol competes with the ruthenium-labelled cortisol tracer for the cortisol antibody, which is attached to biotin in a second step.
The assay takes a total of 18 minutes to run and the measuring range of the assay is 0.018 - 63.4 μg/dL (0.5 - 1750 nmol/L). The reported functional sensitivity of the as-say reported is < 0.308 μg/dL (< 8.5 nmol/L).
The salivary cortisol normal reference range, provided by the manufacturer and determined in samples from 154 healthy individuals, was: 8 AM - 10 AM: < 0.69 μg/dL (< 19.1 nmol/L); 2:30 PM - 3:30 PM: < 0.43 μg/dL (< 11.9 nmol/L).15 The following cross-reactivities were also referred by Roche®: corticosterone – 5.8%, 11-deoxycortisol – 4.1%, 17-α-hydroxyprogesterone – 1.5%, prednisone – 0.28% and dexamethasone – 0.08%.
Statistical analysis
Salivary cortisol concentrations below the assay’s de-tection limit were set to the limit value. Quantitative param-eters are presented as mean ± SD or median (range: mini-mum-maximum) and qualitative parameters are presented as percentages and binomial 95% confidence intervals. LNSaC concentrations obtained from the normal healthy volunteers were used to define the lower (2.5th percentile) and upper (97.5th percentile) limits of the reference range. Comparison of continuous variables among groups was performed using Student’s t -test and bivariate correlations between variables using Pearson correlation test.
Spearman’s rank order test was used to check the cor-relation of cortisol concentrations in different samples -
serum, saliva and urinary specimens.
The diagnostic cut-off level was defined using the re-ceiver operating characteristic (ROC) curve. The LNSaC concentration with highest sensitivity and specificity was calculated by Youden’s J index.16
Statistical analysis was performed with IBM SPSS Sta-tistics V.24 (Chicago, IL, USA) software for Mac. Values of p < 0.05 were considered statistically significant.
RESULTS
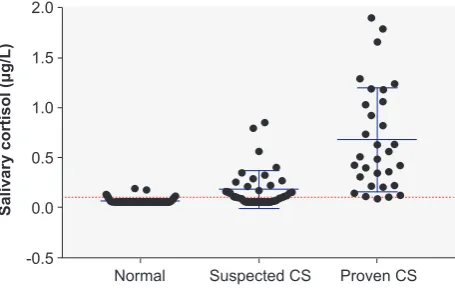
A total of one hundred twenty-seven individuals were en-rolled in the study and were divided in 3 distinct groups: 57 in “normal subjects” group; 39 in the ‘suspected CS’ group and 31 in the ‘proven CS’ group. The last group included 24 patients with ACTH-dependent CS (22 from pituitary origin and 2 from an ectopic source of pulmonary origin) and 7 pa-tients with ACTH-independent hypercortisolism (2 adrenal adenomas and 5 adrenal carcinomas)- (Fig. 1, Table 1). Anthropometric and demographic characteristics for all participants are summarized in Table 1. All of the partici-pants were Caucasian and originally from Portugal.
Mean age was comparable among the three study groups and a preponderance of female participants was a common denominator.
Regarding BMI, the results were similar between the ‘suspected CS’ and ‘proven CS’ groups (30.23 ± 6.4 and 30.74 ± 5.62 kg/m2, respectively); however, patients in con-trol group had slightly lower BMI (24.71 ± 4.18 kg/m2). The mean ± SD LNSaC concentration in patients from the ‘proven CS’ group (0.6798 ± 0.52 μg/dL) was significant-ly higher compared with those in ‘normal subjects’ (0.0642 ± 0.03 μg/dL; p < 0.0001) and ‘suspected CS’ group (0.1803 ± 0.19 μg/dL; p < 0.0001) (Table 1).
The 2.5th- 97.5th percentile of the LNSaC concentra-tions obtained from the ‘normal subjects’ group was 0.054 to 0.1827 μg/dL creating our specific population reference range (Table 1).
A positive significant correlation was found between the LNSaC and LNSeC levels (R = 0.6977; p < 0.0001) as well as with UFC in the ‘proven CS’ group (R = 0.5404; p = 0.0025). Using a linear regression model, there was a
Figure 1 – Late-night salivary cortisol concentrations in the three
study groups. The dotted line (0.1 μg/dL) indicates the cut-off de-rived from the receiver operating characteristic curve.
Normal Suspected CS
Salivary cortisol (μg/L)
Proven CS -0.5
0.0 0.5 1.5
ARTIGO ORIGINAL
positive association between LNSaC and LNSeC as well as with UFC (Fig. 2).
The ROC curve was created to establish the optimal threshold diagnostic LNSaC value and to evaluate the over-all performance of salivary cortisol levels on CS diagnosis, including normal subjects and patients with proven diagno-sis of CS. The Youden-J Index was calculated for the selec-tion of the optimal cut-off point with higher sensitivity (S) and specificity (E)- (Fig. 3).
ROC curve analysis of LNSaC showed an AUC of 0.9881 (p < 0.0001, 95% CI 0.9733 to 1.003). On the basis of this curve, the LNSaC cut-off point above which there is glucocorticoid inappropriate secretion was 0.1 μg/dL (2.76 nmol/L). This cut-off point gave the best diagnostic accu-racy providing a S of 96.77% (95% CI 83.3 - 99.92%) and E of 91.23% (95% CI 80.7 - 97.09%) - (Fig. 3). A cut-off value of 0.196 μg/dL (5.41 nmol/L) increases the specificity to 100% but lowers the sensitivity to 83.87%. Indeed, all the individuals included in the “normal subjects” group had LNSaC concentrations below this cut-off.
DISCUSSION
A normal sleep-wake cycle in a healthy person is char-acterized by a rising of serum cortisol level beginning in the early-morning (3 - 4 AM), reaching a peak at 7 - 9 AM and a decrement afterwards, reaching a nadir at midnight in a person that is asleep.17
Salivary cortisol (SaC) measurement offers an evalua-tion of unbound circulating cortisol fracevalua-tion since cortisol-binding globulin (CBG) is absent from saliva. Its independ-ence from CBG levels, allows an evaluation not affected by changes related to oestrogen therapy, pregnancy or liver disease.18,19
Besides that, the measurement is not influenced by saliva flow rate. The general recommendation is to collect a saliva sample by passive drooling or by chewing a cot-ton device (usually, Salivette©) on two separate evenings at bedtime, between 11 PM - 00 AM. The saliva sample is stable at room temperature and can be mailed directly to the laboratory by the patient. Within this line, this test offers a sensible non-invasive option, not requiring hospitalization
Table 1 – Clinical and biochemical profile of the three groups of subjects included
Normal subjects
(n = 57) Suspected CS(n = 39) Proven CS(n = 31)
Age (years)
Mean ± SD 47.9 ± 11.09 51.54 ± 18.00 46.19 ± 14.11
Gender Female
Male 3522 2514 275
BMI (kg/m2)
Mean ± SD
Range 17.31 - 35.9224.71 ± 4.18 19.3 - 46.0530.23 ± 6.4 23.00 - 40.9030.74 ± 5.62
Salivary cortisol 23.00h (μg/dL)
Mean ± SD Median Range
2.5th Percentile
97.5th Percentile
0.0642 ± 0.03 0.054 0.054 - 0.189
0.054 0.1827
0.1803 ± 0.19 0,109 0.054 - 0.851
0.054 0.851
0.6798 ± 0.52*
0.508 0.087-1.9
0.087 1.9
BMI: body mass index; CS: Cushing’s syndrome; SD: standard deviation. *p < 0.05 versus the other two groups.
Figure 2 – Correlation between late-night serum cortisol (A) and 24-h urinary free cortisol (UFC) excretion (B) with late-night salivary
cor-tisol in patients with proven Cushing Syndrome (CS)
Serum cortisol (μg/L)
UFC (μg/day)
Salivary cortisol (μg/L) Salivary cortisol (μg/L)
0 0
0.0 0.5 0.0 0.5
Y = 12.18*X + 4.073; R = 0.5471; p < 0.0001 Y = 284.8*X + 32.19; R = 0.3339; p = 0.001
1.5 1.5
1.0 2.0 1.0 2.0
10
200
30 800
20
400 600
40 1000
ARTIGO ORIGINAL
and can be easily performed by the patient on a quiet even-ing at home.20
The usefulness of LNSaC has been reported in several studies but diagnostic cut-off levels are highly dependent on the laboratory assay used.4,5,7,9-12,19,21-32 Nevertheless, the discriminating power diminishes in the elderly population and tends to increase in presence of cardiovascular comor-bidities as hypertension and diabetes.33
Moreover, several different factors should be consid-ered on the interpretation of SaC levels. Persons using liquorice or chewing tabaco have limited expression of 11 β-hydroxysteroid dehydrogenase type 2 (11 β-HSD2) by the salivary glands and may have falsely elevated SaC val-ues. Even in patients who smoke tobacco cigarettes, an el-evated LNSaC is found comparing with non-smokers. This known fact supports the recommendation to avoid cigarette smoking on the day of sample collection.34,35
A possible contamination by a steroid-containing topic or oral agent will predictably falsely increase the SaC level obtained by cross-reaction and this should be excluded on a patient under investigation. Blood contamination from an
oral injury might also falsely elevate SaC levels, so vigorous tooth brushing is strongly discouraged near sample saliva collection even with a minor impact expected by leakage.36 In patients who are shift-workers or constant travellers, an abnormal circadian rhythm is assumed and it is recom-mended that the time of sample collection may be re-adjust-ed to the usual bre-adjust-edtime, even if it is after midnight.3
In this study, using an ECLIA assay, we found a LNSaC reference range on “normal subjects” between < 0.054 to 0.189 μg/dL.
The mean ± SD LNSaC concentration in patients with proven CS (0.6798 ± 0.52 μg/dL) was significantly higher than those in normal subjects (0.0642 ± 0.03 μg/dL; p < 0.0001) and suspected CS group (0.1803 ± 0.19 μg/dL; p < 0.0001).
There were no statistically significant differences be-tween groups regarding body mass index although the mean BMI was slightly higher in the ‘proven CS’ group com-pared to the other two groups. This fact excludes a potential bias of body weight differences on LNSaC levels related to a higher 11 β-hydroxysteroid dehydrogenase type 1 activity on visceral fat which promotes the conversion of cortisone to active cortisol.
ROC curve analysis showed an AUC of 0.9881 (p < 0.0001). A cut-off point of 0.1 μg/dL provides a S of 96.77% (95%CI 83.3 - 99.92%) and E of 91.23% (95%CI 80.7 - 97.09%). Besides that, we also found significant correlations between LNSaC and late-night serum cortisol (LNSeC) lev-els (r = 0.6977; p < 0.0001) as well as with UFC levlev-els (r = 0.5404; p = 0.0025) in the proven CS group. Therefore, the significant correlation between LNSaC and other clas-sical hypercortisolism screening test reaffirms the quality requirements of its use as a reliable test (Fig. 2).
Other published studies using ECLIA show a large vari-ability regarding reference ranges in healthy subjects, em-phasizing the need of each laboratory to establish its own reference range and cut-off criteria.4,5,8,11,28,32,37 The majority of studies published used radioimmunoassay for measur-ing salivary cortisol, includmeasur-ing the only published data on
Figure 3 – Receiver operating characteristic curve of late-night
sali-vary cortisol for the diagnosis of Cushing’s syndrome. Area under the curve 0.9881; p < 0.0001.
Sensitivity %
100% - Specifity %
100 75
50 25
0 0 25 75
50 100
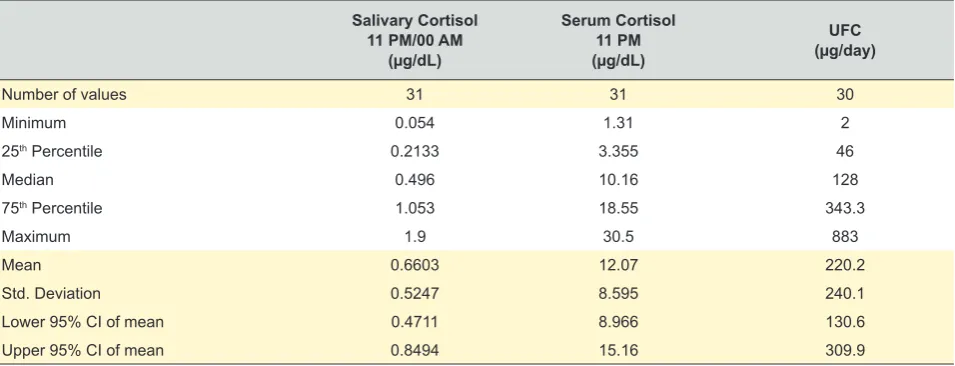
Table 2 – Proven Cushing’s syndrome group of patients: comparison between late-night serum cortisol (LNSeC) and urinary free cortisol
(UFC)
Salivary Cortisol
11 PM/00 AM (µg/dL)
Serum Cortisol 11 PM
(µg/dL)
UFC
(µg/day)
Number of values 31 31 30
Minimum 0.054 1.31 2
25th Percentile 0.2133 3.355 46
Median 0.496 10.16 128
75th Percentile 1.053 18.55 343.3
Maximum 1.9 30.5 883
Mean 0.6603 12.07 220.2
Std. Deviation 0.5247 8.595 240.1
Lower 95% CI of mean 0.4711 8.966 130.6
ARTIGO ORIGINAL a Portuguese population, which found a clearly large ref-erence range for LNSaC (1.0 - 14.9 nmol/L; 0.036 - 0.54
μg/dL).13 On the other hand, the Endocrine Society prac-tice guidelines recommend a cut-off point of 0.14 μg/dL (4 nmol/l) based on ELISA and LC-MS/MS assays which are considered the best validated assays used in the USA for measuring LNSaC. This cut-off value is close to the value of 0.1 μg/dL we propose in our study.
The main advantage of the automated ECLIA technique, compared to radioimmunoassay, is to allow results on the same day that samples are delivered to the laboratory (with-in 20 m(with-inutes) with good analytical performance, provid(with-ing precious information to the clinical team who follows the patient. Other benefits are related to the fact that samples require no pre-treatment and individual samples can be pro-cessed efficiently using this technique.
One of the strengths of our study is the inclusion of a normal population, mostly recruited from a primary care set-ting (a Family Health Unit), to define the reference range for our laboratory assay. We carefully excluded potential bias that are known to falsely elevate LNSaC, such as active smokers and shift workers.
However, one recognized limitation of our study is the low number of UFC and LNSeC samples collected from the same patient at the same time of LNSaC collection (Table 2). This fact may explain the scatter graph obtained with moderate, though significant, positive correlation found be-tween tests (Fig. 2). Another limitation of our study is re-lated to the fact that saliva samples from ‘normal subjects’ group were collected on a single occasion and not at least in two separate days, which could preclude the disclosure of a subtle cortisol excess condition. In contrast, all the pa-tients who collected samples in the ward had two different samples in two different days after the first day of hospital admission.
CONCLUSION
The LNSaC is a simple, convenient and non-invasive stress-free test which can be applied to a wide range of patients.
Our results show that LNSaC has an excellent diag-nostic accuracy making it a highly reliable, non-invasive, screening tool for outpatient assessment. The majority of studies published use radioimmunoassay for measuring salivary cortisol and even those using ECLIA show a large heterogeneity. As such, an individualized cut-off and refer-ence range is better established by each local laboratory. In our population, the LNSaC reference cut-off was 0.1 μg/dL with a sensitivity of 96.77% and a specificity of 91.23% for diagnosis of Cushing’s Syndrome. Given its convenience and diagnostic accuracy, LNSaC may be prof-itably added to other traditional screening tests on hyper-cortisolism, such as LNSeC and UFC.
PROTECTION OF HUMANS AND ANIMALS
The authors declare that the procedures were followed according to the regulations established by the Clinical Re-search and Ethics Committee and to the Helsinki Declara-tion of the World Medical AssociaDeclara-tion.
DATA CONFIDENTIALITY
The authors declare having followed the protocols in use at their working center regarding patients’ data publica-tion.
CONFLICTS OF INTEREST
All authors report no conflict of interest.
FUNDING SOURCES
This research received no specific grant from any fund-ing agency in the public, commercial, or not-for-profit sec-tors.
REFERENCES
1. NRFC. Worldwide trends in body-mass index, underweight, overweight, and obesity from 1975 to 2016: a pooled analysis of 2416 population-based measurement studies in 128·9 million children, adolescents, and adults. Lancet. 2017;390:2627-42.
2. Wilson JM, Jungner YG. Principios y metodos del examen colectivo para identificar enfermedades. Bol Oficina Sanit Panam. 1968;65:281-393.
3. Nieman LK, Biller BM, Findling JW, Newell-Price J, Savage MO, Stewart PM, et al. The diagnosis of Cushing’s syndrome: an Endocrine Society Clinical Practice Guideline. J Clin Endocrinol Metab. 2008;93:1526-40. 4. Vogeser M, Durner J, Seliger E, Auernhammer C. Measurement of
late-night salivary cortisol with an automated immunoassay system. Clin Chem Lab Med. 2006;44:1441-5.
5. Yaneva M, Mosnier-Pudar H, Dugué MA, Grabar S, Fulla Y, Bertagna X. Midnight salivary cortisol for the initial diagnosis of Cushing’s syndrome of various causes. J Clin Endocrinol Metab. 2004;89:3345-51. 6. van Aken MO, Romijn JA, Miltenburg JA, Lentjes EG. Automated
measurement of salivary cortisol. Clin Chem. 2003;49:1408-9. 7. Doi M, Sekizawa N, Tani Y, Tsuchiya K, Kouyama R, Tateno T, et al.
Late-night salivary cortisol as a screening test for the diagnosis of Cushing’s syndrome in Japan. Endocr J. 2008;55:121-6.
8. Deutschbein T, Broecker-Preuss M, Flitsch J, Jaeger A, Althoff R, Walz MK, et al. Salivary cortisol as a diagnostic tool for Cushing’s syndrome and adrenal insufficiency: improved screening by an automatic
immunoassay. Eur J Endocrinol. 2012;166:613-8.
9. Antonelli G, Ceccato F, Artusi C, Marinova M, Plebani M. Salivary cortisol and cortisone by LC-MS/MS: validation, reference intervals and diagnostic accuracy in Cushing’s syndrome. Clin Chim Acta. 2015;451:247-51.
10. Belaya ZE, Iljin AV, Melnichenko GA, Rozhinskaya LY, Dragunova NV, Dzeranova LK, et al. Diagnostic performance of late-night salivary cortisol measured by automated electrochemiluminescence immunoassay in obese and overweight patients referred to exclude Cushing’s syndrome. Endocrine. 2012;41:494-500.
11. Carrozza C, Corsello SM, Paragliola RM, Ingraudo F, Palumbo S, Locantore P, et al. Clinical accuracy of midnight salivary cortisol measured by automated electrochemiluminescence immunoassay method in Cushing’s syndrome. Ann Clin Biochem. 2010;47:228-32. 12. Erickson D, Singh RJ, Sathananthan A, Vella A, Bryant SC.
Late-night salivary cortisol for diagnosis of Cushing’s syndrome by liquid chromatography/tandem mass spectrometry assay. Clin Endocrinol. 2012;76:467-72.
13. Santos R, Prazeres S, Martins A, Sobrinho L. O valor do cortisol salivar em endocrinologia clínica. Revista Portuguesa de Endocrinologia, Diabetes e Metabolismo. 2010:31-40.
ARTIGO ORIGINAL
15. Cortisol, cat no. 11875116160 [accessed 2018 Feb 02]. Available from: https://dialog1.roche.com/us/en_us/eLabDoc.
16. Zou KH, O’Malley AJ, Mauri L. Receiver-operating characteristic analysis for evaluating diagnostic tests and predictive models. Circulation. 2007;115:654-7.
17. Krieger DT, Allen W, Rizzo F, Krieger HP. Characterization of the normal temporal pattern of plasma corticosteroid levels. J Clin Endocrinol Metab. 1971;32:266-84.
18. Tayek JA. Lower cortisol concentrations in patients with liver disease: more adrenal failure or more confusion? Crit Care Med. 2005;33:1431-2.
19. Raff H. Update on late-night salivary cortisol for the diagnosis of Cushing’s syndrome: methodological considerations. Endocrine. 2013;44:346-9.
20. Gozansky WS, Lynn JS, Laudenslager ML, Kohrt WM. Salivary cortisol determined by enzyme immunoassay is preferable to serum total cortisol for assessment of dynamic hypothalamic--pituitary--adrenal axis activity. Clin Endocrinol. 2005;63:336-41.
21. Raff H, Raff JL, Findling JW. Late-night salivary cortisol as a screening test for Cushing’s syndrome. J Clin Endocrinol Metab. 1998;83:2681-6. 22. Putignano P, Dubini A, Toja P, Invitti C, Bonfanti S, Redaelli G, et
al. Salivary cortisol measurement in normal-weight, obese and anorexic women: comparison with plasma cortisol. Eur J Endocrinol. 2001;145:165-71.
23. Putignano P, Toja P, Dubini A, Pecori Giraldi F, Corsello SM, Cavagnini F. Midnight salivary cortisol versus urinary free and midnight serum cortisol as screening tests for Cushing’s syndrome. J Clin Endocrinol Metab. 2003;88:4153-7.
24. Trilck M, Flitsch J, Lüdecke DK, Jung R, Petersenn S. Salivary cortisol measurement--a reliable method for the diagnosis of Cushing’s syndrome. Exp Clin Endocrinol Diabetes. 2005;113:225-30.
25. Viardot A, Huber P, Puder JJ, Zulewski H, Keller U, Müller B. Reproducibility of nighttime salivary cortisol and its use in the diagnosis of hypercortisolism compared with urinary free cortisol and overnight dexamethasone suppression test. J Clin Endocrinol Metab. 2005;90:5730-6.
26. Arregger AL, Cardoso EM, Tumilasci O, Contreras LN. Diagnostic value of salivary cortisol in end stage renal disease. Steroids. 2008;73:77-82. 27. Carroll T, Raff H, Findling JW. Late-night salivary cortisol measurement
in the diagnosis of Cushing’s syndrome. Nat Clin Pract Endocrinol Metab. 2008;4:344-50.
28. Jeyaraman K, Ammini AC, Nandita G, Dwivedi SN. Late-night salivary cortisol in normal subjects and in patients with Cushing’s syndrome. Postgrad Med J. 2010;86:399-404.
29. Raff H. Cushing’s syndrome: diagnosis and surveillance using salivary cortisol. Pituitary. 2012;15:64-70.
30. Elbuken G, Tanriverdi F, Karaca Z, Kula M, Gokahmetoglu S, Unluhizarci K, et al. Comparison of salivary and calculated free cortisol levels during low and standard dose of ACTH stimulation tests in healthy volunteers. Endocrine. 2015;48:439-43.
31. Ryan R, Booth S, Spathis A, Mollart S, Clow A. Use of salivary diurnal cortisol as an outcome measure in randomised controlled trials: a systematic review. Ann Behav Med. 2016;50:210-36.
32. Kuzu I, Zuhur SS, Demir N, Aktas G, Yener Ozturk F, Altuntas Y. The diagnostic value of late-night salivary cortisol for diagnosis of subclinical Cushing’s syndrome. Endokrynol Pol. 2016;67:487-92.
33. Liu H, Bravata DM, Cabaccan J, Raff H, Ryzen E. Elevated late-night salivary cortisol levels in elderly male type 2 diabetic veterans. Clin Endocrinol. 2005;63:642-9.
34. Smith RE, Maguire JA, Stein-Oakley AN, Sasano H, Takahashi K, Fukushima K, et al. Localization of 11 beta-hydroxysteroid dehydrogenase type II in human epithelial tissues. J Clin Endocrinol Metab. 1996;81:3244-8.
35. Badrick E, Kirschbaum C, Kumari M. The relationship between smoking status and cortisol secretion. J Clin Endocrinol Metab. 2007;92:819-24. 36. Kivlighan KT, Granger DA, Schwartz EB, Nelson V, Curran M, Shirtcliff
EA. Quantifying blood leakage into the oral mucosa and its effects on the measurement of cortisol, dehydroepiandrosterone, and testosterone in saliva. Horm Behav. 2004;46:39-46.