GAMBLING
IN LOUISIANA
2002 LOUISIANA STUDY OF PROBLEM GAMBLING
Ronald J. Vogel, Ph.D. Principal Investigator
Phillip Ardoin, Ph.D. Associate Director
Nelson Mandela School of Public Policy Southern University
---
2002 LOUISIANA STUDY OF PROBLEM GAMBLING
---
Acknowledgements
We would like to express our gratitude to numerous individuals who assisted us in this study. Those who were exceptionally helpful included Sgt. Troy Leonard of the Louisiana State Police Department, who provided the number of gambling sites and devices in each parish in Louisiana, Reece Middleton and Colleen Leonard of Louisiana Problem Gamblers Helpline, who provided the data of callers seeking assistance from their agency, the high school principals who responded to our questionnaire, and the residents of Louisiana who were interviewed for this study. We would especially like to thank the staff of Louisiana’s Office for Addictive Disorders, especially Michael Duffy, Tonetta Morrison, Matricia Green, and Galen Schum whose guidance was essential to the production of this report. Of course, any and all errors in this report are unintentional, and are the sole responsibility of the authors.
TABLE OF CONTENTS
Acknowledgements ...I LIST OF TABLES AND FIGURES ... IV
Chapter 1 -- EXECUTIVE SUMMARY... 1
CHAPTER 2 - INTRODUCTION AND METHODS ... 10
INTRODUCTION ... 11
BACKGROUND ... 11
GAMBLING TREATMENT SERVICES ... 11
DEFINITION AND DERIVATION OF TERMS ... 12
METHODS ... 13
QUESTIONNAIRE – INDIVIDUAL SURVEYS ... 13
QUESTIONNAIRE – PRINCIPAL SURVEYS ... 13
SAMPLE DESIGN – INDIVIDUAL SURVEYS ... 13
GAMBLING IN LOUISIANA ... 14
GAMBLING IN THE GENERAL POPULATION ... 14
PATTERNS OF GAMBLING PARTICIPATION ... 15
CHAPTER 3 – Statewide Results ... 19
HISTORY OF GAMBLING IN LOUISIANA... 19
GAMBLING ESTABLISHMENTS – STATEWIDE ... 23
PREVALENCE OF GAMBLING – STATEWIDE ... 23
GAMBLING ACTIVITIES – STATEWIDE ... 30
POPULAR GAMBLING ACTIVITIES ... 32
CHAPTER 4 – Regional Analyses... 45
REGION 1... 45
GAMBLING ESTABLISHMENTS – REGION 1... 45
PREVALENCE OF GAMBLING – REGION 1... 46
GAMBLING ACTIVITIES – REGION 1... 46
PROBLEM AND PATHOLOGICAL GAMBLING – REGION 1 ... 47
REGION 2 - CAPITAL AREA HUMAN SERVICES DISTRICT (CAHSD) ... 51
GAMBLING ESTABLISHMENTS - CAHSD ... 51
PREVALENCE OF GAMBLING - CAHSD ... 52
GAMBLING ACTIVITIES - CAHSD... 52
PROBLEM AND PATHOLOGICAL GAMBLING - CAHSD... 55
REGION 3... 57
GAMBLING ESTABLISHMENTS – REGION 3... 57
PREVALENCE OF GAMBLING – REGION 3... 58
GAMBLING ACTIVITIES – REGION 3... 59
PROBLEM AND PATHOLOGICAL GAMBLING – REGION 3 ... 62
REGION 4... 63
GAMBLING ESTABLISHMENTS – REGION 4... 63
PREVALENCE OF GAMBLING, REGION 4... 65
GAMBLING ACTIVITIES – REGION 4... 65
GAMBLING ESTABLISHMENTS – REGION 5... 69
PREVALENCE OF GAMBLING – REGION 5... 70
GAMBLING ACTIVITIES – REGION 5... 72
PROBLEM AND PATHOLOGICAL GAMBLING... 72
REGION 6... 74
GAMBLING ESTABLISHMENTS – REGION 6... 74
PREVALENCE OF GAMBLING – REGION 6... 75
GAMBLING ACTIVITIES – REGION 6... 75
PROBLEM AND PATHOLOGICAL GAMBLING – REGION 6 ... 79
REGION 7... 80
GAMBLING ESTABLISHMENTS – REGION 7... 80
PREVALENCE OF GAMBLING – REGION 7... 80
GAMBLING ACTIVITIES – REGION 7... 81
PROBLEM AND PATHOLOGICAL GAMBLING – REGION 7 ... 83
REGION 8... 85
GAMBLING ESTABLISHMENTS – REGION 8... 85
PREVALENCE OF GAMBLING – REGION 8... 85
GAMBLING ACTIVITIES – REGION 8... 86
PROBLEM AND PATHOLOGICAL GAMBLING – REGION 8 ... 90
REGION 9... 91
GAMBLING ESTABLISHMENTS – REGION 9... 91
PREVALENCE OF GAMBLING – REGION 9... 91
GAMBLING ACTIVITIES – REGION 9... 93
PROBLEM AND PATHOLOGICAL GAMBLING – REGION 9 ... 94
REGION 10 – Jefferson Parish Human Services Authority (JPHSA) ... 96
GAMBLING ESTABLISHMENTS – JPHSA... 96
PREVALENCE OF GAMBLING – JPHSA... 96
GAMBLING ACTIVITIES – JPHSA ... 98
PROBLEM AND PATHOLOGICAL GAMBLING – JPHSA... 98
CHAPTER 5 – Conclusion... 100
GAMBLING ESTABLISHMENTS AND DEVICES ... 100
PERCEPTIONS OF ADOLESCENT GAMBLING... 100
LOUISIANA PROBLEM GAMBLERS HELPLINE CALLS ... 100
PROBLEM AND PATHOLOGICAL GAMBLERS ... 101
NON-GAMBLERS AND WEEKLY GAMBLERS ... 101
IMPLICATIONS FOR FUTURE RESEARCH ... 102
BIBLIOGRAPHY... 104
APPENDIX 1: Questionnaire for the 2002 Louisiana Interview Survey... 105
LIST OF TABLES AND FIGURES
TABLE 1 PREVALENCE OF WAGERING AND PROBLEM GAMBLING BY
REGION... 3
TABLE 2 GAMBLING ESTABLISHMENTS AND DEVICES BY REGION... 5
TABLE 3 GAMBLING HELPLINE AND HIGH SCHOOL PRINCIPAL DATA BY REGION... 6
TABLE 4 Problem Wagering and Pathological Gambling, by Region... 8
Table 2-1: GAMBLING PARTICIPATION IN LOUISIANA, 2002 AND 1998... 15
Table 2-2: DEMOGRAPHICS OF GAMBLERS IN LOUISIANA... 17
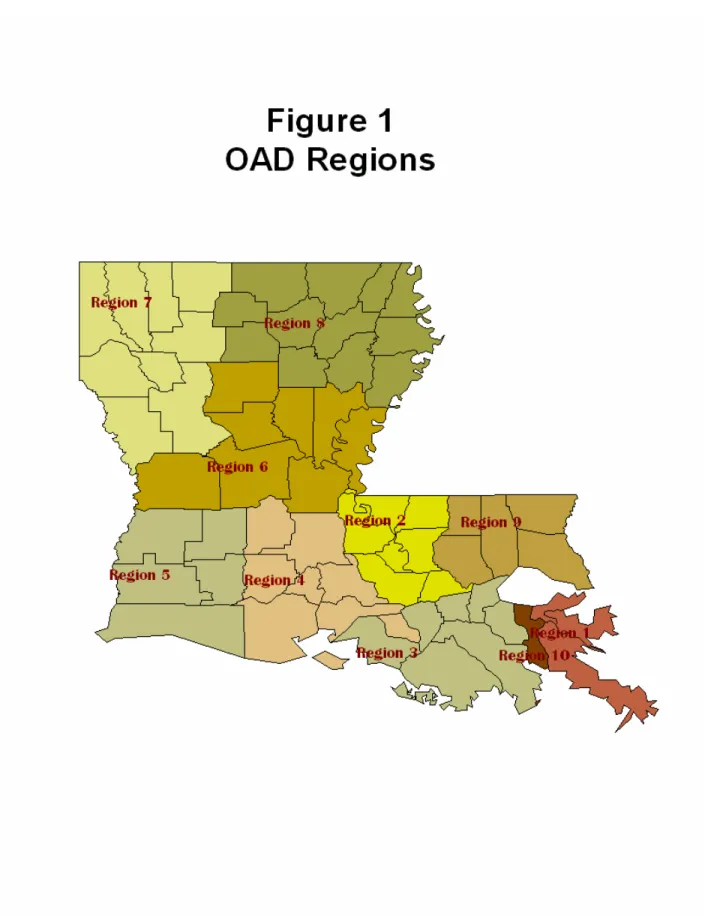
Figure 1: OAD Regions ... 18
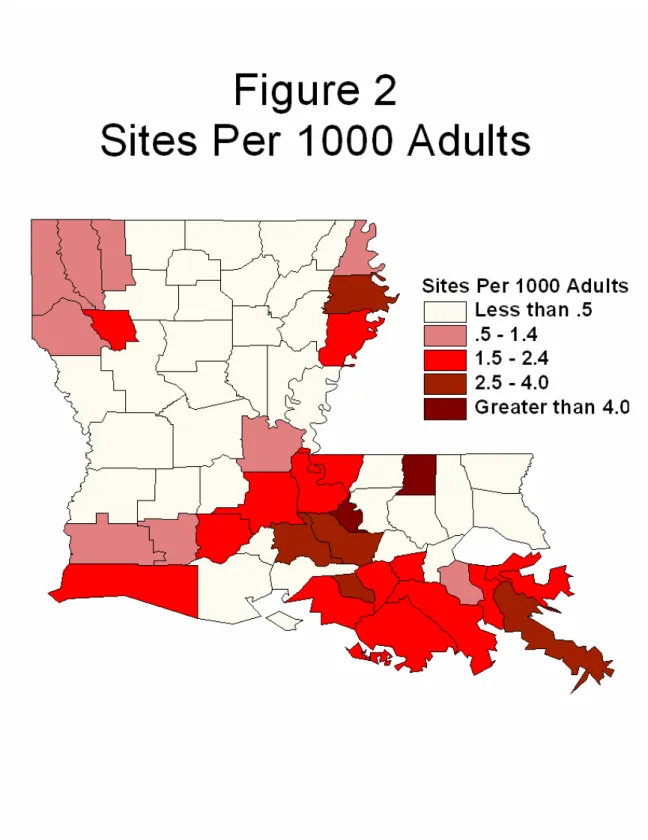
Figure 2: Sites Per 1000 Adults ... 21
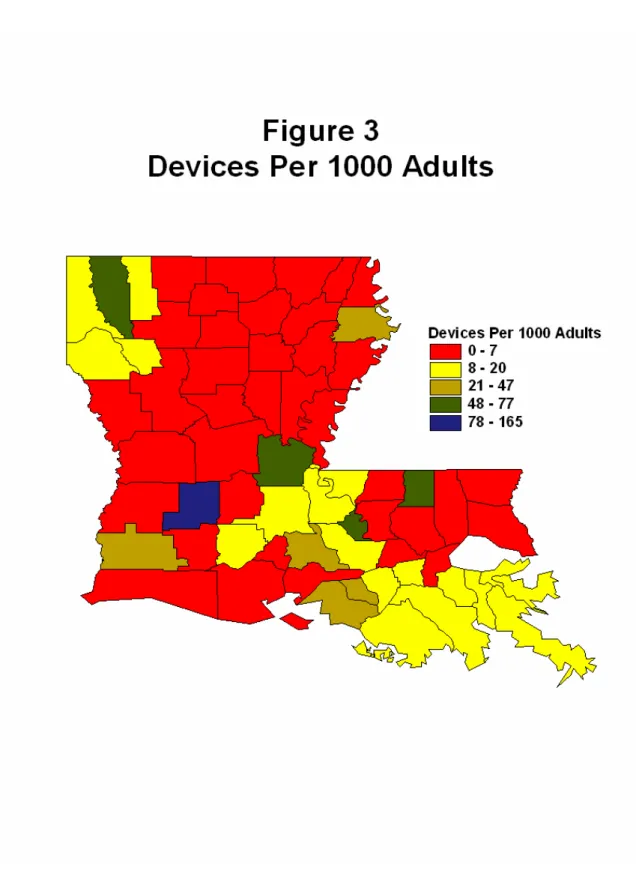
Figure 3: Devices Per 1000 Adults ... 22
TABLE 1, STATEWIDE Gambling Establishments, by Region... 24
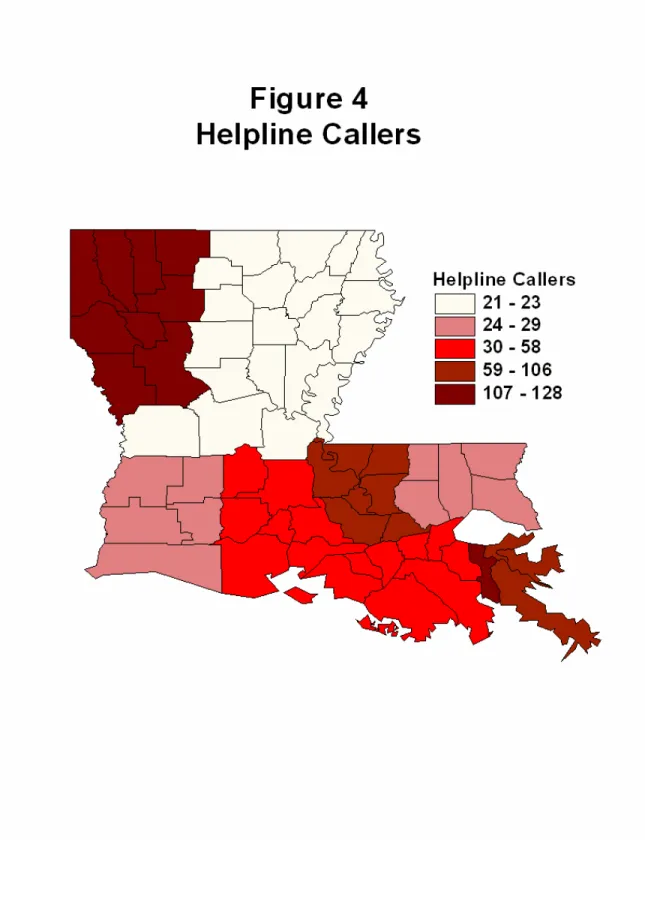
Figure 4: Helpline Callers... 26
TABLE 2, STATEWIDE Indicators of Gambling Problems ... 27
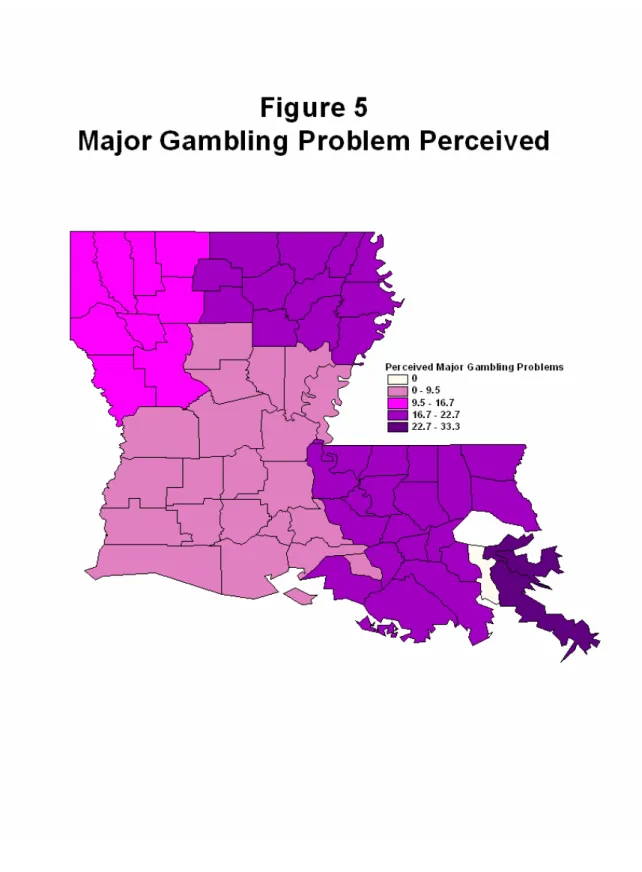
Figure 5: Major Gambling Problem Perceived ... 28
Figure 6: No Gambling Problem Perceived ... 29
TABLE 3, STATEWIDE Prevalence of Gambling Activities ... 32
TABLE 4, STATEWIDE Popular Gambling Activities, by Region ... 34
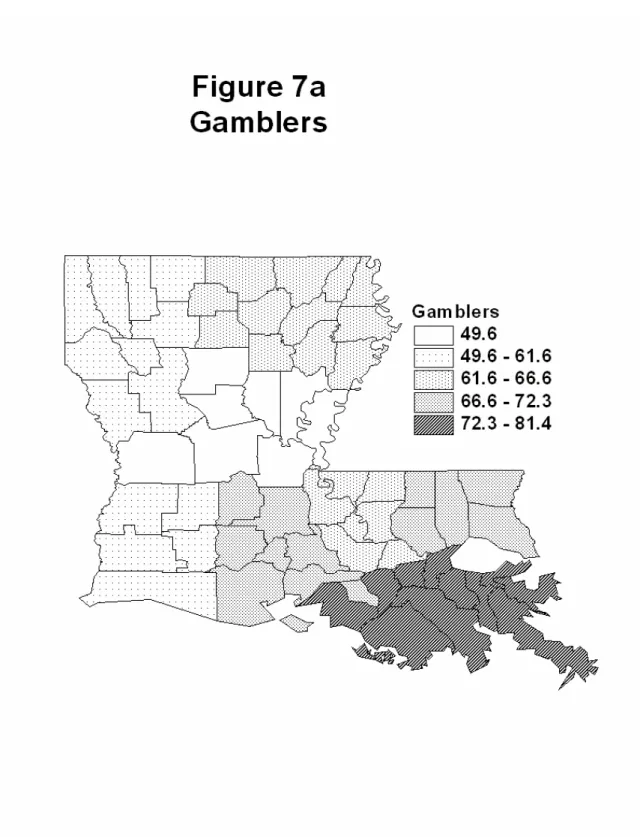
Figure 7a: Gamblers... 35
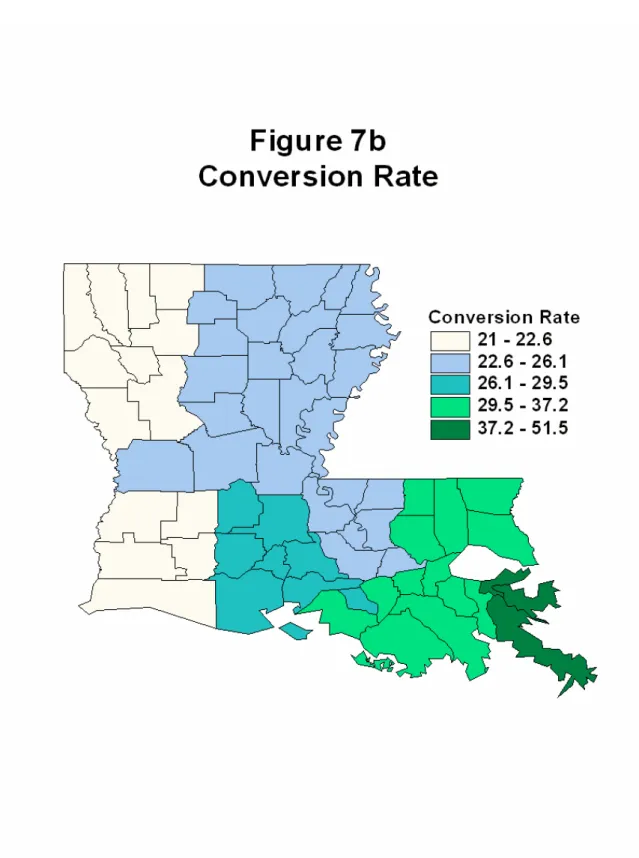
Figure 7b: Conversion Rate ... 36
Figure 8a: Pathological Gambling ... 37
Figure 8b: Problem Gambling ... 38
Figure 9: Percentage of Respondents Who Go To Casinos ... 39
Figure 10: Percent of Respondents Who Play Lottery... 40
Figure 11: Percentage of Respondents Who Play Slots ... 41
TABLE 5, STATEWIDE Problem Wagering and Pathological Gambling, by Region... 43
TABLE 6, STATEWIDE Changes in Problem and Pathological Gambling Prevalence . 44 TABLE 1, REGION 1 Gambling Establishments, by Parish ... 46
TABLE 2, REGION 1 Indicators of Gambling Problems ... 49
TABLE 3, REGION 1 Prevalence of Gambling Activities ... 50
TABLE 4, REGION 1 Problem Wagering and Pathological Gambling ... 50
TABLE 1, CAHSD Gambling Establishments, by Parish... 51
TABLE 2, CAHSD Indicators of Gambling Problems... 54
TABLE 3, CAHSD Prevalence of Gambling Activities... 56
TABLE 4, CAHSD Problem Wagering and Pathological Gambling, ... 56
TABLE 1, Region 3 Gambling Establishments, by Parish and Region... 58
TABLE 2, Region 3 Indicators of Gambling Problems... 60
TABLE 3, Region 3 Prevalence of Gambling Activities... 61
TABLE 4, Region 3 Problem Wagering and Pathological Gambling ... 62
TABLE 1, Region 4 Gambling Establishments, by Parish... 63
TABLE 2, Region 4 Indicators of Gambling Problems... 64
TABLE 3, Region 4 Prevalence of Gambling Activities... 67
TABLE 2, REGION 5 Indicators of Gambling Problems ... 71
TABLE 3, Region 5 Prevalence of Gambling Activities... 73
TABLE 4, Region 5 Problem Wagering and Pathological Gambling ... 73
TABLE 1, Region 6 Gambling Establishments, by Parish... 74
TABLE 2, Region 6 Indicators of Gambling Problems... 77
TABLE 3, Region 6 Prevalence of Gambling Activities... 78
TABLE 4, Region 6 Problem Wagering and Pathological Gambling ... 79
TABLE 1, Region 7 Gambling Establishments, by Parish... 81
TABLE 2, Region 7 Indicators of Gambling Problems... 82
TABLE 3, Region 7 Prevalence of Gambling Activities... 84
TABLE 4, Region 7 Problem Wagering and Pathological Gambling ... 84
TABLE 1, Region 8 Gambling Establishments, by Parish... 86
TABLE 2, Region 8 Indicators of Gambling Problems... 88
TABLE 3, Region 8 Prevalence of Gambling Activities... 89
TABLE 4, Region 8 Problem Wagering and Pathological Gambling, ... 90
TABLE 1, Region 9 Gambling Establishments, by Parish... 91
TABLE 2, Region 9 Indicators of Gambling Problems... 92
TABLE 3, Region 9 Prevalence of Gambling Activities... 94
TABLE 4, Region 9 Problem Wagering and Pathological Gambling ... 95
TABLE 1, JPHSA Gambling Establishments... 96
TABLE 2, JPHSA Indicators of Gambling Problems ... 97
TABLE 3 – JPHSA Prevalence of Gambling Activities ... 99
TABLE 4 – JPHSA Problem Wagering and Pathological Gambling ... 99
Table 5-1 Relationship between Extent of Legal Gambling and Gambling Problem Indicators... 102
Chapter 1 -- EXECUTIVE SUMMARY
Gambling is one of the oldest forms of entertainment known to exist; yet the study of gambling is relatively recent. Even more recent is the study of problem or compulsive gambling, including its debilitating effects upon individuals, families, and society.
Beginning in 1990, the Louisiana State Legislature concluded that expanding legal gambling to a number of new venues might be a method to reduce pressures on the State budget without increasing taxes. Authorizations were provided for a series of gambling activities that made legal gambling more accessible to the average adult living in the State. First, horse racetracks were permitted to simulcast out-of-state racing and off track betting (OTB) facilities were set up across the State. Then, a State lottery was approved, with the later addition of Powerball. Soon after, video poker facilities were licensed at racetracks, OTBs and truck stops throughout the State. Next, the State Legislature permitted riverboat casino gambling at venues spread throughout the State. Finally, a land-based casino was sanctioned for the New Orleans area in 1992 (Volberg & Moore, 1999). As gambling enterprises became more extensive throughout Louisiana, the State Legislature determined that studies should be conducted to examine the effects, if any, upon residents of the State.
This study is the third in a sequence (1995 and 1998) designed to study the problem of compulsive gambling, the best ways to prevent and address the problem of compulsive gambling, the most effective, responsible, and equitable way to support the infrastructure necessary to prevent problem gambling, and the steps that should be taken by the State Legislature to accomplish the establishment of the recommended infrastructure (Louisiana Compulsive Gambling Study Committee Report, 1996). The aims of this specific project were to:
• Compare/contrast regional and statewide results of telephone interviews of individual gambling activity and the number of establishments and devices in each region of the State;
• Measure the incidence of problem wagering and pathological gambling at the State and regional levels, using the phone interview data;
• Survey high school principals throughout Louisiana to find the levels of perceived gambling problems affecting their students, at regional and State levels;
• Examine Gambling Helpline data to see the relationship between self-reported problem gambling and gaming activity in each region;
• Study the different data sets to determine if gambling activity is concentrated in any specific region of Louisiana.
This report summarizes the findings of the study, and compares the results to previous studies conducted in Louisiana.
Table 1 exhibits four different measures obtained through sampling individuals in each region of the State. The first column notes the number of individuals surveyed who acknowledged that they had gambled in any way in the previous year. The survey data1 shows the three regions of the State where respondents were more likely to report that they gambled were in the southeastern part of Louisiana.
1 Due to the relatively small sample sizes in each of the ten regions (ranging from about 110 – 140 for each region), the confidence intervals are relatively wide at this level. See the regional discussions for a more definitive analysis.
TABLE 1
PREVALENCE OF WAGERING AND PROBLEM GAMBLING BY REGION
Region % Who
Gambled % Gamblers Who Gambled Once a Week or More
% Problem
Gamblers % Pathological Gamblers
Region 1 81.4 51.5 3.42 3.42
CAHSD 66.6 26.1 3.79 0
Region 3 80.5 31.6 2.90 .7
Region 4 71.8 29.5 3.21 2.56
Region 5 60.9 21.0 1.50 1.50
Region 6 49.6 25.4 2.52 .8
Region 7 61.6 22.6 2.64 1.99
Region 8 64.4 24.7 3.79 1.52
Region 9 72.3 32.9 .8 .8
JPHSA 78.4 37.2 4.17 2.5
TOTAL 67.7 29.8 2.87 1.58
The second column measures, for each region, those respondents who reported that they engaged in some form(s) of gambling during the past year, the percentage who gambled more than once per week on a given activity. This measure was devised to gauge those who gambled more frequently. Results indicated that respondents from Region 1 (the New Orleans area) gambled more frequently than respondents from any other section of the State.
The third column shows the percentage of those who were surveyed by region and scored either 3 or 4 points out of 20 questions on the current South Oaks Gambling Screen (SOGS)2. Historically, this response level reliably indicates an individual at a problem gambling level (Volberg, 1999). Here we see a wide variation among the regions, with respondents from Jefferson Parish (JPHSA), Capital Area (CAHSD), New
Orleans (Region 1), and Monroe (Region 8) regions with much higher levels than those from other areas of the State.
Finally, the fourth column represents the percentage of respondents who scored 5 or higher on the current SOGS. Once again, we see that Region 1 far outpaces the other sections of the State with the percentage of respondents meeting this criterion at levels of 150% or more than other regions.
In summary, the different measures of gambling consistently demonstrated higher gambling tendencies in the southeastern regions of the State than in the other regions, with Region 1 notably high on all four measures.
Next, we examined the number of gambling establishments and devices in each region. We examined this data in four different ways: the number of sites, the number of devices, the number of gambling sites per 1000 adults, and the number of devices per 1000 adults. The advantage to looking at both the number of establishments and the number of devices is that they are alternative measures that show the accessibility of legal gambling within a region. We find that most parishes that have casinos do not have truck stops or video poker outlets, so they would have a high number of devices, but very few sites.
When the number of gambling establishments per 1000 adults is examined (see Table 2), the regions with the highest number per capita are Regions 1, 3 and Jefferson Parish Human Services Authority (JPHSA), all located near New Orleans. On the other hand, when we look at the number of gambling devices per 1000 people, the two regions with the highest number are Regions 5 and 7, both located along the Texas border. These two areas, Lake Charles and Shreveport, respectively, both have casinos and rely on tourist dollars as a revenue source.
Later, in the State analysis section of the paper, we will discuss the relationship between sites per capita and establishments per capita and each of the four measurements of gambling cited in Table 1 in more detail. To summarize the results here, the correlation between sites per capita and each of the four measurements was positive, while interestingly, the relationship between devices per capita and each of the four measurements was negative3. This indicates, at least tentatively, that the greater the
number of sites, the more prevalent the gambling problems. A reason that this might occur is that, for regions with a high number of sites per capita, impulse gambling is more accessible; for those with a few sites but a high number of devices, impulse gambling is more difficult.
TABLE 2
GAMBLING ESTABLISHMENTS AND DEVICES BY REGION Region Sites4 Devices Adult
Population5 Sites/1000 Adults Devices/1000 Adults Region 1 693 2,618 424,497 1.63 6.17
CAHSD 197 3,413 442,831 .44 7.71
Region 3 522 5,064 272,890 1.91 18.56
Region 4 256 2,236 390,815 .66 5.72
Region 5 203 8,108 207,009 .98 39.17
Region 6 35 2,345 218,782 .16 10.72
Region 7 345 8,666 381,688 .90 22.70
Region 8 44 418 258,597 .17 1.62
Region 9 25 479 314,028 .08 1.53
JPHSA 570 4,517 322,014 1.77 14.03
TOTAL 2890 37,864 323,3151 .89 11.71
We next look at the other two data sets accumulated during the course of this study, a survey that was conducted of the high school principals’ impressions of gambling habits among their students, and data collected and provided for this research by Gambling Helpline.
TABLE 3
GAMBLING HELPLINE AND HIGH SCHOOL PRINCIPAL DATA BY REGION
Region % of Gambling
Helpline Calls6 % of State Population % Principals Aware of Minor Problems % Principals Aware of Major Problems
Region 1 16.1 12.9 44.5 33.3
CAHSD 14.2 13.5 64 20
Region 3 8.8 8.6 62.4 18.8
Region 4 7.6 12.3 68.2 9.1
Region 5 4.4 6.3 57.2 9.5
Region 6 3.5 6.7 60.9 8.7
Region 7 18.8 11.7 58.3 16.7
Region 8 3.2 7.9 60 20
Region 9 4.4 9.8 54.6 22.7
JPHSA 19.1 10.2 50 0
TOTAL 58. 16.7
The regions where principals generally felt that major gambling problems were worse than the State average were Regions 1, 9, 8, and CAHSD. When major and minor gambling problems are combined, the region that reported the most gambling problems is CAHSD, where 84% of principals think that there were some gambling problems among their charges. Other areas that were above the statewide average for this statistic included Regions 3, 8, 1, and 4. Actually, all the regions except for JPHSA show about the same levels of gambling among high school students making the case that gambling problems are pervasive among high school students statewide. As stated earlier, the sole exception to these results was JPHSA. One reason for this might be that the sample size (6) here is so much smaller than in the other regions. This was not due to anything other than the fact that there are less public high schools in JPHSA (15) than there are in the other areas of the State.
The Gambling Helpline data reveal that the regions of the State where they received a greater number than expected calls (based on population) are located primarily
6 Gambling Helpline calls received during 2002 that noted the region of the caller were included in this analysis.
in the Shreveport area and in Regions 1 and JPHSA. Perhaps the reason that Shreveport area residents are more likely to call the Helpline for assistance might be because the Helpline is located there. Once again in this case, the correlation statewide between sites per population and Helpline calls is very high and positive, while the relationship between devices and calls is negligible.
Table 4 examines the levels of problem and pathological gamblers in each of the regions of Louisiana. There are two regions of the State, Region 1 and JPHSA, where the levels of both problem and pathological gambling are higher than the statewide averages. These two regions adjoin each other in the southeastern sector of the State. These two regions also lead the State when we estimate the potential number of problem and pathological gamblers in their geographic areas.
Next, we shall see how the pattern of problem and pathological gambling in the 2002 study compares to those in previous studies of Louisiana. There has been virtually no change in the pathological gambling rates in the three studies conducted over a seven year time period. This remarkably stable set of numbers may reflect that there are a core number of individuals who suffer from severe problems caused by gambling over the course of their lifetimes. On the other hand, the steep decline found in the 1998 survey in the area of problem gambling has been reversed, and the 3.0% rate found in this study shows a return nearly to the 1995 levels.
TABLE 4
PROBLEM WAGERING AND PATHOLOGICAL GAMBLING, BY REGION
REGION % OF
PROBLEM GAMBLERS
% OF
PATHOLOGICAL GAMBLERS
# OF PROBLEM GAMBLERS (UP TO)
# OF
PATHOLOGICAL GAMBLERS (UP TO)
Region 1 3.4 3.4 28,000 28,000
CAHSD 3.8 0 31,400 10,300
Region 3 2.9 .7 15,600 5,700
Region 4 3.2 2.6 19,900 23,300
Region 5 1.5 1.5 7,400 7,400
Region 6 2.5 .8 11,600 5,300
Region 7 2.6 2.0 20,800 17,200
Region 8 3.8 1.5 18,700 9,400
Region 9 .8 .8 7,300 7,300
JPHSA 4.2 2.5 28,200 19,100
TOTAL 3.0 1.6 67,900-126,000 29,100-74,400
Finally, we will briefly discuss the four dimensions of gambling (problem gambling, pathological gambling, prevalence of gambling, and prevalence of frequent gambling) in each region compared to State averages.
REGION 1 In each of the four dimensions mentioned, Region 1 is above the statewide average. For three of the four measurements, Region 1 contains the highest values of any area of the State.
CAHSD The only dimension in which CAHSD was above the State average was problem gambling percentage. For each of the others, it was lower.
REGION 3 Region 3 presents a mixed picture. The rate of pathological gambling is the lowest of any region. The percentage of gamblers and the conversion rate is higher than the State average.
REGION 4 Likewise, the figures for Region 4 are varied. While the rate of problem gambling is slightly below the State average, the pathological gambling rate is among the highest in the State.
REGION 5 The results for Region 5 are consistently lower than the State average. For one of the dimensions, conversion rate, the percentage is the lowest of any region.
REGION 6 In this section of the State, each of the dimensions used in Table 4 is lower than the Louisiana average. The rate of gamblers is lower than in any other region.
REGION 7 The results are mixed for this section of the State. While problem gambling exceeds the statewide average, the other three dimensions are each below it.
REGION 8 There were varied results for Region 8. The only measurement that was above the State average was problem gambling; each of the other three were below Louisiana’s average.
REGION 9 This region also has diverse results from the above table. While both problem and pathological gambling rates were higher than the State average, the other dimensions were lower.
JPHSA Jefferson Parish is above statewide regional averages on all four measures used in table 4. The level of problem gambling in this section of the State was higher than in any other region.
In summary, then, Region 1 and JPHSA each are above the regional average using any of the four domains. Region 5 and Region 6 are below the statewide average on all measurements in Table 4. The other six regions present mixed results, with some dimensions above the State average and others below the average.
CHAPTER 2 - INTRODUCTION AND METHODS
During the 1990’s, with the expansion of legalized gambling throughout the nation, an integral component of government sanctioning of gaming establishments has been the monitoring of the negative impacts of gambling upon individuals, families, and communities (Volberg & Dickerson, 1996). The study herein, initiated and funded by the Louisiana Office for Addictive Disorders, examines problem and pathological gambling, the extent of different forms of gambling for adults in Louisiana, the perception of adolescent gambling problems by high school principals, and the relationship of Louisiana Problem Gamblers Helpline data to the other data sources.
This report has several purposes. The primary aim of the report is to examine each region of the State to perceive the relationship between the number of gambling locations, the prevalence of adult gambling, the perceived prevalence of adolescent gambling, the types of activities most used and abused by adults and adolescents, and the number of problem and pathological gamblers. An additional purpose is to examine each of the regions, in relationship to each other, for each of the above discussion items. The final purpose is to examine the difference in problem and pathological gambling between this study and those conducted in 1995 and 1998 in Louisiana. The results of this study should prove useful in detailing the differences in regional impact of legal gambling in Louisiana and in providing further services available to individuals in Louisiana with gambling-related difficulties.
This report is organized into several chapters for easy access and clarity of presentation. This chapter has three main sections. The Introduction incorporates a background, a look at gambling treatment services, and a description of terms used in this report. The Methods section includes the details of conducting the individual survey, and a description of the other data sets collected and used for this report. The final section of this chapter looks at the demographic of gamblers in Louisiana. The following chapter contains intra-regional analyses of the data. Chapter 4 provides inter-regional and statewide analyses. The final chapter contains a conclusion and some recommendations.
INTRODUCTION BACKGROUND
Beginning in 1990, the Louisiana State legislature concluded that expanding legal gambling to a number of new venues might be a method to reduce pressures on the State budget without increasing taxes. Authorizations were provided for a series of gambling activities that made legal gambling more accessible to the average adult living in State. First, horse racetracks were permitted to simulcast out-of-state racing and off track betting (OTB) facilities were set up across the State. Then, a State lottery was approved, with the later addition of Powerball. Soon after, video poker facilities were licensed at racetracks, OTBs and truck stops throughout the State. Next, the State legislature permitted riverboat casino gambling at venues throughout the State. Finally, a land-based casino was sanctioned for the New Orleans area in 1992 (Volberg & Moore, 1999).
GAMBLING TREATMENT SERVICES
In 1995, a study was conducted of the Louisiana adult population concluded that weekly gambling participation rates and the prevalence of current problem and pathological gambling in Louisiana were higher than in many other states (Volberg, 1995). In 1995, the Louisiana Compulsive Gambling Study Committee was created in order to study the problem of compulsive gambling, the best ways to prevent and address the problem of compulsive gambling, the most effective, responsible, and equitable way to support the infrastructure necessary to prevent problem gambling, and the steps that should be taken by the State legislature to accomplish the establishment of the recommended infrastructure (Louisiana Compulsive Gambling Study Committee Report, 1996). They recommended a number of initiatives to deal with the threat of compulsive gambling, including that regular studies of pathological gambling be conducted with extension of the age groups surveyed to middle school and adolescents (Louisiana Compulsive Gambling Study Committee Report, 1996).
They further recommended that Louisiana should set up treatment centers designed specifically for pathological gamblers, that prevention and treatment programs be established by the Louisiana Department of Health and Hospitals, that the minimum
Compulsive Gambling Study Committee Report, 1996). Thus far, a number of the actions recommended by the Louisiana Compulsive Gambling Study Committee have been established. These include the formation of Gambling Helpline, which receives calls from gamblers seeking assistance or from their friends and family who are concerned about their condition. The Department of Health and Hospitals has set up an adolescent gambling prevention program provided to schools throughout the State. Training conferences have been conducted for treatment professionals (Volberg & Moore, 1999).
DEFINITION AND DERIVATION OF TERMS
• Adult Population – The number of residents ages 18 or older. This number was computed by multiplying the number of residents in each parish in 2000 (provided by US Census Bureau) by a multiplier (also provided by the US Census Bureau).
• Conversion Rate – The percentage of those who Ever Bet On an activity (see definition below), who do so once per week or more.
• Ever Bet On – For each gambling activity, the percentage of respondents who partake of that activity.
• Gambler – The percentage of respondents in the individual surveys who acknowledged that they had participated in any gambling activities over the past year.
• Gambling Devices – This was derived from data provided from LA State Police.
• Gambling Sites – This was derived from data provided by the LA State Police.
• Pathological Gambling – A full discussion of pathological gambling is provided in another section of this research, but, it should be noted that pathological gambling has four main characteristics: 1) progression; 2) an intolerance of losing; 3) preoccupation; 4) a disregard for consequences (Rosenthal, 1989).
• Problem Gambling – There are similarities between problem gamblers and pathological gamblers (above) but the primary differences are that problem gamblers do not show progression and they do not have the same intolerance for losing as pathological gamblers.
METHODS
Baseline studies are the original examination of variables, and their relationship to other variables. Replication studies are those in which the relationships are essentially the same as those originally studied (Babbie, 1998). This research has some of the characteristics of a baseline study, and some of the characteristics of replication research. The data gathered from high school principals is baseline research, since it was initial research gathered on this population. On the other hand, the individual surveys were, to a great extent, a replication of research performed in 1995 and 1998. An advantage of replication research is that it builds on the knowledge and information gathered originally, permitting us to refine and clarify some of the earlier findings.
QUESTIONNAIRE – INDIVIDUAL SURVEYS
The questionnaire (see Appendix 1) used during the phone interviews contained a number of different sections. The first section asks demographic information of the respondents. The next section asks respondents about twelve types of gambling in Louisiana. For each gambling activity, those interviewed were asked whether they ever tried the activity, and if they had done so once per week or more. Respondents then were asked their expenditure level of gambling. The final section of the survey was the current South Oaks Gambling Screen.
QUESTIONNAIRE – PRINCIPAL SURVEYS
The questionnaire (see Appendix 2) used for the principal surveys contained but one section. Principals were asked, in their opinion, whether each of twelve gambling activities was a problem among their students, and if it were a problem, was it major or minor. These surveys were sent to every public high school principal in Louisiana, and were returned by about 50% of them.
SAMPLE DESIGN – INDIVIDUAL SURVEYS
When constructing sample designs, the most basic approach is to construct a simple random sample. There are many advantages to this design (mainly involving
permitting the researcher to estimate the error present with precision, but is not desirable for many studies. If information is desired about a specific characteristic of the population, a more complex design, referred to as a stratified random sample, whereby the population is subdivided into groups, in which all members of each share the same characteristic. A specific concern in this research was to delineate differences in responses based on the region of Louisiana in which they resided. Therefore, a modified stratified sample was designed that ensured that at least 100 adults in each region would be randomly interviewed.
GAMBLING IN LOUISIANA
The questionnaire that was used for the surveys collected information on twelve different types of gambling activities:
Played cards for money Played bingo Bet on sports using parlay cards, with a bookie,
at jai alai
Played dice games, including craps, over and under, or other dice games
Went to casinos, legal or otherwise Played the numbers or bet on lotteries Bet on horses, dogs, or other animals at OTB,
the track, or with a bookie
Played the stock and/or commodities market Played slot machines, poker machines, or other
gambling machines
Bowled, shot pool, played golf, or some other game of skill for money
Played pull tabs or ‘paper games’ other than lotteries
Some form of gambling not listed
GAMBLING IN THE GENERAL POPULATION
Studies have shown that the percentage of respondents who have gambled changes from state to state and from year to year. In different studies that have been conducted recently, the range of respondents who have stated that they gambled ranged from 64% in Mississippi (1996) to 92% in New Jersey (1989) (Volberg, 1999). Table 2-1 shows the lifetime participation and weekly participation derived from this study. The data reveal that over 2/3 of respondents have gambled at some point in their lifetime, and
that 20% of them reported that they gambled weekly. These numbers are almost identical to the analogous figures found in the 1998 study (69.8% and 20.4%, respectively) (Volberg, 1999). The most popular gambling activities include going to casino (54.5%), playing the lottery (39.3%), playing slot/gambling machines (37.0%), and playing cards (24.9%). Because the gambling activities were not worded the same in the two studies, it is difficult to determine if there has been a change in gambling habits between the 1998 survey and this one. The weekly participation for these events ranges from 8.2% for playing the lottery to 4.1% for playing cards. An interesting comparison with the 1998 findings can be made for the lottery category, as the proportion of respondents has dropped sharply, and weekly participation is about half of what it was four years ago.
Table 2-1: GAMBLING PARTICIPATION IN LOUISIANA, 2002 AND 1998
Activity Lifetime Participation, 2002
Weekly
Participation, 2002
Conversion Rate
Gambler 67.7 20.2 29.8
Went to Casino 54.5 6.7 12.3
Numbers/Lottery 39.3 8.2 20.9
Slot/Gambling Machines 37.0 5.1 13.8
Played Cards 24.9 4.1 16.5
Played Bingo 22.2 2.1 9.5
Bet on Animals 16.8 1.7 10.1
Stock Market 14.0 4.8 34.3
Bet on Sports 12.6 1.7 13.5
Dice Games 8.2 1.6 19.5
Pull Tabs/Paper Games 7.4 .9 12.2
Played Sports or Games for
Money 7.2 1.4 19.4
Other 5.3 .2 3.8
PATTERNS OF GAMBLING PARTICIPATION
In this section, we examine demographic differences in gambling habits among the respondents to the telephone interviews. First, we examine gender differences. Men showed a statistical tendency to gamble, and to gamble frequently, more than women did.
Women are less likely to have ever gambled, and are 50% less likely to gamble weekly than are their male counterparts.
There are definitive age differences, as well, in gambling habits. Gambling participation, and the frequency of gambling steadily increases with age, until the age of 56-65, then begins a steep decline. The reason for this may be that since legalized gambling became widespread in Louisiana in the early 1990’s, gambling habits may never have become engrained in these older residents. The difference is quite significant, with over 25% of 46-55 year olds reporting that they gambled weekly, while only 15% of those over 65 years of age state the same thing.
Ethnicity presents a different picture. Of the demographic characteristics that were collected, race was the only one that did not show a statistically discernable difference. The final demographic variable that was considered in this research was employment status. An interesting result here is that unemployed respondents were more likely to report that they gambled weekly than any other category. Without further inspection of this facet, it would be impossible to state definitively why this would be true. Some possible reasons might include extra leisure time or the need for funds that might not achieved other than gambling.
Table 2-2: DEMOGRAPHICS OF GAMBLERS IN LOUISIANA
Demographic Category Non-Gamblers (%) Lifetime Participation (%) Weekly Gamblers (%)
TOTAL 32.2 47.6 20.2
Gender***
Male 28.9 44.8 26.3
Female 33.9 48.6 17.5
Age***
18-25 35.1 47.3 17.6
26-35 29.1 50.8 20.1
36-45 25.4 52.2 22.4
46-55 24.4 50.0 25.6
56-65 34.2 46.0 19.9
Over 65 45.2 39.4 15.4
Ethnicity
White 31.3 48.0 20.7
African-American 34.5 47.4 18.1
Hispanic 22.2 50.0 27.8
Asian 33.3 33.3 33.3
Other 32.5 44.2 23.4
Employment Status***
Employed 26.8 52.0 21.2
Retired 40.6 42.4 17.0
Unknown 81.8 18.2
Unemployed 27.6 46.6 25.8
CHAPTER 3 – Statewide Results
In this chapter, gambling data for the regions of Louisiana will be compared to each other, and statewide figures will be determined and discussed. In the following chapter, the results for each region will be discussed in detail.
HISTORY OF GAMBLING IN LOUISIANA
Following the Civil War, because of the economic problems facing their State, the Louisiana State legislature granted a license for a State lottery. For over a decade, tickets were sold nationally as the lottery thrived. A decade later, nearby states prohibited the sale of Louisiana lottery tickets within their borders due to a growing moral climate opposed to gambling. By 1894, as the trend spread, the State legislature withdrew the license for the lottery firm (Sullivan, 1972). Gambling remained illegal in all of its forms until 1935, when horse racing was legalized (Westphal, et al, 2000).
Before 1990, legalized gambling was relatively rare in Louisiana, with the only forms extant being such relatively benign long-standing activities as church bingos, community raffles, and pari-mutuel horse racing. Beginning in the early 1990’s though, State licensed gambling expanded greatly, as it was believed to be an unproblematic method to increase State revenues without increasing taxes (Volberg and Moore, 1999).
The first step involved with the expansion of government-licensed gambling entailed the expansion of horse racing gambling opportunities in a number of ways. The four racetracks were granted the right to offer inter-track wagering; racing from out of State racetracks was simulcast on the in-state tracks; and eventually, off-track wagering was provided at a select number of sites. Beginning in 1991, video poker machines were installed at horse racing venues (Volberg and Moore, 1999).
In 1991, a State lottery was begun in Louisiana, and has been expanded during the intervening years to include Powerball opportunities. Also, in that same year, video poker machines were licensed at truck stops and off-track facilities (Volberg and Moore, 1999). In that same year, the State legislature authorized riverboat gambling. By 1993, the first riverboat casinos opened (out of 15 that were originally licensed), in four major
demographic areas (New Orleans, Baton Rouge, Shreveport, and Lake Charles) (Volberg and Moore, 1999).
In 1992, land-based casino operations were approved in New Orleans. This casino, after many delays, eventually opened in 2000. As well, there are three Indian casinos thriving in diverse sections of Louisiana that were each opened since 1990 (Volberg and Moore, 1999).
Late 1998 found a moderating effect on the increase in gambling facilities in the form of a referendum among the electorate throughout Louisiana. Voters in each parish had a choice in that election: allow all gambling that currently existed to remain legalized; allow some types of gambling to remain officially authorized, and while closing others; force all gambling venues to remove operations.
GAMBLING ESTABLISHMENTS – STATEWIDE
Table 1 shows the same data that was looked at in the previous chapter, expanded to statewide levels. Looking at the amount of gambling sites in each region, Regions 1, 3, and JPHSA are at a much higher level than the other parishes. The same three regions have the most sites per capita, each of them nearly doubling the regional average. The regions that have much fewer sites than the others are Regions 6, 8, and 9. This holds true on a per capita basis as well, with each of them averaging less than 1 site for every 5,000 adults.
Looking at the devices in each region, a different picture appears. Now, the two regions that have nearly double the regional average are Regions 5 and 7. On a per capita basis, Region 5 by far has the largest amount, tripling the regional average. The regions that have many less devices than the others are Regions 8 and 9, with about one-tenth the average number of gambling devices that exists statewide.
PREVALENCE OF GAMBLING – STATEWIDE
Table 2 shows the incidence of gambling in two different data sets that were used in this study, the high school principals’ questionnaire and the Louisiana Problem Gamblers Helpline calls made from January through June 2002. Of the high school principals who responded, one-sixth of them stated that they believe that major gambling problems existed among the students in their schools. Another six out of ten believe that there are gambling problems among the students but that they are minor in nature. Only one-quarter of the principals in Louisiana believe that their students have no gambling problems.
Looking at the regional comparison, the regions where principals generally felt that major gambling problems were worse than the State average were Regions 1, 9, 8, and CAHSD. When major and minor gambling problems are combined, the region that reported the most gambling problems is CAHSD, where 84% of principals think that there are some gambling problems among their charges. Other areas that were above the statewide average for this statistic included Regions 3, 8, 1, and 4. Actually, all the regions except for JPHSA show about the same levels of gambling among high school students making the case that gambling problems are pervasive among high school students statewide. As stated earlier, the sole exception to these results was JPHSA. One reason for this might be that the sample size (6) here is so much smaller than in the other regions. This was not due to anything other than the fact that there are less public high schools in JPHSA (15) than there are in the other areas of the State.
TABLE 1, STATEWIDE Gambling Establishments, by Region
REGION ADULT POP GAMBLING SITES SITES/1000 ADULTS GAMBLING DEVICES DEVICES/1000 ADULTS
1 424,498 693 1.63 6426 15.14
CAHSD 442,830 197 .44 3413 7.70
3 272,890 522 1.91 5064 18.56
4 390815 256 .66 2236 5.72
5 207010 203 .98 8108 39.17
6 218,781 35 .16 2345 10.72
7 381,687 345 .90 8666 22.70
8 264,145 47 .18 418 1.58
9 314,029 30 .10 479 1.53
JPHSA 322,014 570 1.77 4517 14.03
TOTALS 3,238,699 2898 .89 41,672 12.87
The other data set examined in Table 2 is the number of calls made to the Gambling Helpline during the first half of 2002. Merely looking at the raw numbers, the areas that had the most calls for assistance were Regions JPHSA, 7, and 1. Comparing the percentage of statewide calls made from each region to that region’s share of Louisiana’s
adult population, the regions neatly cluster into three diverse groups; those where the calls are much greater than one would expect given their population, ones where the calls reflect their population, and those where the calls are much fewer than one would expect. The first group includes Regions 1, 7, and JPHSA. An interesting note is that these three regions, referring to Table 1 in this chapter, rank in the top
TABLE 2, STATEWIDE Indicators of Gambling Problems
Prevalence of Gambling Among Adolescents Gambling Helpline Callers Population
Region 1 Region 1
REGION NO PROBLEMS
SOME MINOR PROBLEMS
SOME MAJOR PROBLEMS
REGION CALLS ADULT
POPULATION
SHARE OF POP
1 22.2% (4) 44.5% (8) 33.3% (6) 1 16.0% (106) 424,498 13.1%
CAHSD 16% (4) 64% (16) 20% (5) CAHSD 14.0% (93) 442,830 13.7%
3 18.8% (3) 62.4% (10) 18.8% (3) 3 8.8% (58) 272,890 8.4%
4 22.7% (5) 68.2% (15) 9.1% (2) 4 7.6% (50) 390,815 12.1%
5 33.3% (7) 57.2% (12) 9.5% (2) 5 4.4% (29) 207,010 6.4%
6 30.4% (7) 60.9% (14) 8.7% (2) 6 3.5% (23) 218,781 6.8%
7 25% (6) 58.3% (14) 16.7% (4) 7 18.9% (125) 381,687 11.8%
8 20% (3) 60% (9) 20% (3) 8 3.2% (21) 264,145 8.2%
9 22.7% (5) 54.6% (12) 22.7% (5) 9 4.4% (29) 314,029 9.7%
JPHSA 50% (3) 50% (3) 0 JPHSA 19.3% (128) 322,014 10.0%
TOTALS (n=192)
half in both gambling sites per capita and gambling devices per capita. The second cluster, where the calls are about the same levels as the population, include Regions 3 and CAHSD. The final group, where there were fewer calls than their proportion of the population, includes Regions 4,5,6,8, and 9. Other than Region 5, these locales are in the bottom half of the State in both sites per capita and devices per capita. Region 5, though, in and around Lake Charles has numerous gambling sites and casinos. It ranks first in the State in sites per capita and third in devices per capita. Why then does this region provide so few calls to the Louisiana Problem Gamblers Helpline? Although we cannot provide an unqualified answer to this question, we can offer some suppositions. Perhaps the great majority of the individuals visiting the gambling sites are from Texas or other venues outside of the immediate district. Or maybe the Louisiana Problem Gamblers Helpline advertising is not as pervasive in this region as in other sections that have a number of gambling sites.
GAMBLING ACTIVITIES – STATEWIDE
There will be a change here from the manner in which the regional analyses were provided for the various gambling activities. In Table 3, which follows, each of the gambling activities will be examined using statewide data. Following that, the most common activities will be looked at regionally, as well as statewide, in Table 4.
Among the respondents to the telephone interviews, the most common gambling activities engaged in during the previous year were going to casinos (54.5%), playing the numbers or lottery (39.3%), and playing slot machines (37.0%). Of the twelve different activities that individuals were questioned about, nine were engaged in by at least 10% of respondents throughout the State. Of these events, the ones with the highest conversion rates (which measures the percentage of weekly participants of those who engage in an event) were the stock market (34.3%), playing the lottery (20.9%), and playing cards (16.5%).
For the high school principals, two activities appeared to be major problems much more than any others, playing dice games (13.0%) and playing card games (9.5%). It should be mentioned that usage of many of the activities in the survey by adolescents were regulated. These activities, betting on animals (1.6%), going to casino (1.1%),
playing the lottery (1.6%), and playing slot or gambling machines (1.1%), were consistently low in the principals’ appraisal. Thus, it appears that the enforcement agencies and the entrepreneurs are consistently doing a fine job in prohibiting usage among adolescents, in the opinion of the high school administrators.
There are two main activities that individuals calling the Louisiana Problem Gamblers Helpline seek assistance with, going to casinos (76.2%) and playing slot/gambling machines (37.7%). As was stated in some of the regional analyses in the previous chapter, at least part of the reason for this may be the widespread availability of Louisiana Problem Gamblers Helpline information at casinos and other gambling venues. Another reason for the dominance of casinos in this dataset may be that, compared to some other forms of gambling mentioned, gambling there is conducted in a closed environment, which might induce individuals to lose more than they planned, causing them to recognize or believe that they have a gambling problem.
TABLE 3, STATEWIDE Prevalence of Gambling Activities
Telephone Interviews Principal
Surveys
Gambling Helpline
ACTIVITY EVER BET
ON
CONVERSION
RATE7 PROBLEM MAJOR PROBLEMS REPORTED
Played Cards 24.9 16.5 9.5% 4.2
Bet on Animals 16.8 10.1 1.6% 2.9
Bet on Sports 12.6 13.5 .5% 1.7
Dice Games 8.2 19.5 13.0% 1.8
Went to Casino 54.5 12.3 1.1% 76.2
Numbers/Lottery 39.3 20.9 1.6% 8.8
Played Bingo 22.2 9.5 4.2% 2.6
Stock Market 14.0 34.3 0 0
Slot/Gambling
Machines 37.0 13.8 1.1% 37.7
Played Sports or Games for Money
7.2 19.4 3.2% .2
Pull Tabs/Paper Games for Money
7.4 12.2 2.1% 0
Other 5.3 3.8 1.4% 1.7
Total Responses N=190
POPULAR GAMBLING ACTIVITIES
In Table 4, the three most popular gambling activities in the State are looked at to see how their usage differs among the regions. Also, the percentage of respondents in each region who gamble and their usage of gambling will be compared to one another. The three regions that have the highest rates of individuals who go to casinos are Regions 1, 3, and JPHSA. Over 60% of respondents in each of these regions asserted that they have gone to casinos. The interesting notation about this is that all three of these regions are secreted in the southeastern sector of the State, in and around the mouth of the Mississippi River. The areas with the lowest rates of casino usage, below 50% in each,
7 Conversion rate was computed by dividing the ‘once/week or more’ number by the ‘ever bet on’ number. It measures, of those who gamble on an activity, what percentage do so with frequency.
were Regions 5, 6,and 8. The areas of the State where those who went to casinos were most likely to go once a week or more were Regions 1 and 4, where the conversion rates for each were around 20%. The two lowest conversion rates occurred in Regions 5 and 8, each around 2%. The implication to this latter figure is that for residents of those regions, about one in fifty who go to casinos do so weekly.
The sections that have the highest percentage of respondents who play the lottery (or the numbers) are Regions 1, 3, 4, and JPHSA, all of which exceed 45%. The three lowest in lottery usage are Regions 5, 6, and 7, each of which is at 30% or less. Once again, as in the case of casinos, there is a wide divergence of conversion rates in different regions. The three regions with conversion rates greater than 25% are Regions 1, 4, and JPHSA, all of which were among the leaders in lottery usage, as well. The regions that had conversion rates of 10% or less were Regions 6 and CAHSD.
The last gambling activity looked at in depth in this table is playing slot or gambling machines. The usage trends here are different than in the previous two analyses. Here, the regions with the highest percentages of playing slot or gambling machines are Regions 1, 4, and 9, each of which is between 40-50%. The remainder of the regions has between 30-40% of respondents who play slot or gambling machines. Looking at conversion rates for slot machines, Region 4 has a conversion rate 50% higher than any other region, implying that many more respondents in this area who play gambling machines, do so weekly, than other section of the State. The two lowest conversion rates are in Regions 5 and 9.
The final column in this table illustrates the percentage of those interviewed who gambled on any activity in each region. The areas of the State that had the highest rate of gambling participation are Regions 1, 3, and JPHSA, each of which was around 80%. On the other hand, Region 6 had, by far, the lowest percentage of respondents who gambled. While less than half of those interviewed acknowledged gambling in the last year, no other region was below 60%. Region 1 also had the highest conversion rate, exceeding 50%. The implication to this is that over 40% of those interviewed in Region 1 gamble at least weekly. This is nearly double the similar rate for any other area of the State. The lowest conversion rates are in Regions 5, 7, and CAHSD, each of which was below 25%.
TABLE 4, STATEWIDE Popular Gambling Activities, by Region
(Ever Bet On %/Conversion Rate %)
REGION WENT TO
CASINO
PLAYED LOTTERY
PLAYED SLOT MACHINES
GAMBLER
1 70.1/23.1 48.8/40.8 42.7/15.9 81.4/51.5
CAHSD 53.8/15.4 37.9/10.0 31.1/17.0 66.6/21.1
3 63.8/12.5 47.8/18.2 37.9/15.3 80.5/31.6
4 53.9/19.1 46.2/26.4 41.0/23.4 71.8/29.5
5 45.5/1.8 27.3/13.9 31.0/4.8 60.9/21.0
6 41.2/10.2 25.2/9.9 30.3/13.9 49.6/25.4
7 54.0/7.4 30.6/17.3 31.3/16.9 61.6/22.6
8 49.2/2.0 36.3/18.7 39.3/9.7 64.4/24.7
9 57.8/9.5 51.2/21.3 47.6/4.8 72.3/32.9
JPHSA 64.3/15.4 45.2/28.0 38.8/16.9 78.4/37.2
TOTALS 54.5/12.3 39.3/20.9 37.0/13.8 67.7/29.8
Figure 8b: Problem Gambling
PROBLEM AND PATHOLOGICAL GAMBLING – STATEWIDE
Since the 1980’s, pathological gambling has been defined as a clinical psychiatric disorder. The American Psychiatric Association’s Diagnostic and Statistical Manual of Mental Disorders, Third Edition (DSM-III) defined the diagnostic criteria for pathological gambling. In the DSM-IV, the definition of pathological gambling was revised as a chronic and progressive failure to resist impulses to gamble, that compromises, disrupts, or damages personal, family, or vocational pursuits (Westphal, et al, 2000).
Pathological gambling has a number of devastating consequences for the affected individual. These include a loss of control when gambling, either continual or periodic, an increase in either/both the gambling frequency and the amounts wagered, and an obsession with gambling and procuring funds with which to gamble (Westphal, et al, 2000). There are a number of criteria exhibited by pathological gamblers: (1) preoccupation with gambling; (2) a need to increase the excitement produced by gambling; (3) restlessness or irritability when unable to gamble; (4) repeated unsuccessful efforts to control, cut back, or stop gambling; (5) gambling in an effort to win back the amount of money lost during gambling on a previous day; (6) gambling in an effort to escape a dysphoric mood; (7) lying to cover up gambling; (8) jeopardizing a significant job, relationship, or educational opportunity by gambling; (9) engaging in illegal activity to finance gambling; and (10) seeking others to relieve a desperate financial situation produced by gambling (American Psychiatric Association, 1994).
Problem gambling, on the other hand, has not yet been defined by the American Psychological Association. In 1994, Shaffer et al developed a system that classified gambling behaviors into three separate levels of severity. Level 1 gamblers suffer little or no adverse consequences from their gambling endeavors. Level 2 gamblers have encountered some adverse consequences in some areas of their lives but the dysfunction has not reached the level of pathology, as yet. Level 3 gamblers are pathological gamblers. They experience the most severe consequences from their gambling behavior. In order to maintain consistency with previous reports on problem and pathological gambling in Louisiana, we will use Level 2 behaviors to describe problem gambling, and Level 3 behaviors to describe pathological gambling (Westphal, et al, 2000).
Table 5 examines the levels of problem and pathological gamblers in each of the regions of Louisiana. There are two regions of the State where the levels of both problem and pathological gambling are higher than the statewide averages. These two regions adjoin each other, Region 1 and JPHSA, in the southeastern sector of the State. These two regions also lead the State when we estimate the potential number of problem and pathological gamblers in their geographic areas.
TABLE 5, STATEWIDE Problem Wagering and Pathological Gambling, by Region
REGION % OF
PROBLEM GAMBLERS
% OF
PATHOLOGICAL GAMBLERS
# OF PROBLEM GAMBLERS (UP TO)
# OF
PATHOLOGICAL GAMBLERS (UP TO)
1 3.4 3.4 28,000 28,000
CAHSD 3.8 .8 31,400 10,300
3 2.9 .7 15,600 5,700
4 2.6 3.2 19,900 23,300
5 1.5 1.5 7,400 7,400
6 2.5 .8 11,600 5,300
7 2.6 2.0 20,800 17,200
8 3.8 1.5 18,700 9,400
9 .8 .8 7,300 7,300
JPHSA 5.0 3.0 28,200 19,100
TOTALS 3.0 1.6 67,900-126,000 29,100-74,400
Next, we shall see how the pattern of problem and pathological gambling in the 2002 study compares to those in previous studies of Louisiana. There has been virtually no change in the pathological gambling rates in the three studies conducted over a seven year time period. This remarkably stable set of numbers may reflect that there are a core number of individuals who suffer from severe problems caused by gambling over the course of their lifetimes. On the other hand, the steep decline found in the 1998 survey in the area of problem gambling has been reversed, and the 3.0% rate found in this study shows a return nearly to the 1995 levels. The reason for this increase to earlier levels may be statistical in nature. That is, perhaps the numbers found in 1998 were anomalous to the
which may not represent the true values of the population it is purported to represent. But repeated sampling of a population eventually reveals to us the true population values, hence the term regressing to the mean.
TABLE 6, STATEWIDE Changes in Problem and Pathological Gambling Prevalence
1995 Prevalence 1998 Prevalence 2002Prevalence
Current Problem 3.4 2.3 3.0
CHAPTER 4 – Regional Analyses
In the previous chapter, statewide data was examined, and differences between regions was analyzed and discussed. In this chapter, each region will be scrutinized in more detail, and notable features of each will be discussed.
REGION 1
Region 1 (Orleans, Plaquemines, and St. Bernard Parishes) is located in the southeastern part of the State of Louisiana, with a population estimated by the U.S. Census Bureau as of 2000 to be 578,660. This is a decline of 10,484 since 1990, or 1.8%. Orleans is the most populous parish in the region, with about 84% of the region’s population located within its borders. Region 1 is centered in New Orleans, one of the most important cities in the United States. The region is heavily dependent on tourism, especially adult tourism, from around the nation and the world. New Orleans, especially, is viewed as an adult playground, sort of a Disneyland for grown-ups. There are hopes that legalized gambling will increase the amount of dollars that these tourists spend while visiting the region.
GAMBLING ESTABLISHMENTS – REGION 1
In Table 1, we see the prevalence of gambling establishments and devices in each parish in the region. Controlling for adult population, the data show that Orleans has a much lower number of sites per capita than the other two parishes in the region. However, when we look at the amount of legal gaming devices, Orleans Parish has about twice as many as Plaquemines Parish, and about one and a half more devices per capita than are in St. Bernard Parish.
Comparing Region 1 to other sections of the State, it ranks third in the number of gambling sites per capita, and fourth in the amount of devices per capita.
TABLE 1, REGION 1 Gambling Establishments, by Parish PARISH ADULT POP GAMBLING SITES SITES/1000 ADULTS GAMBLING DEVICES DEVICES/1000 ADULTS
Orleans 355,266 533 1.50 5755 16.20 Plaquemines 18,944 52 2.74 155 8.18 St. Bernard 50,288 108 2.15 516 10.26
TOTAL 424,498 693 1.63 6426 15.14
PREVALENCE OF GAMBLING – REGION 1
In Table 2, three separate sets of information are combined; surveys received from high school principals, calls made to Louisiana Problem Gamblers Helpline from January through June 2002, and adult population in the parishes. When we examine the overall responses from high school principals serving in Region 1, we see that one-third of all principals who responded to the survey believe that there are major problems relating to gambling among their students. This percentage is much higher than in any other region of the State. Indeed, fourteen out of eighteen principals in this region believe that there are gambling problems among the students at the school in which they operate. The perceived problems are even worse for those serving in Orleans Parish. Forty percent of the principals assert that they believe that major gambling problems exist among the student body; another 40% believe that minor gambling problems are present. Likewise, the Louisiana Problem Gamblers Helpline received the lion’s share of its Region 1 calls from Orleans Parish. This parish has nearly 84% of the region’s adult population, but over 87% of calls made from this region came from Orleans. St. Bernard Parish, with nearly 12% of the adult population of the region, only accounted for 7.5% of calls to the Helpline.
GAMBLING ACTIVITIES – REGION 1
Table 3 shows how often different gambling activities surface as problems for Region 1 inhabitants in the different data sets. For the random interviews that were conducted, 70.1% reported that they had gambled at a casino at some point over the previous year. Other activities that were named by respondents with some frequency included playing the lottery (48.8%) and playing gambling machine (42.7%). Of the
activities that people mentioned were conducted at least once per week, the two most cited activities were playing the lottery (40.8%) and playing sports or games for money (31.5%).
Over one-fifth of the high school principals found that major problems existed with two different types of gambling activities, playing cards (27.8%) and playing dice games (27.8%). An interesting facet of the principals’ responses was that although a number of them felt that gambling problems were a major problem among their students, no regulated activities were cited. Thus, it appears that in this region, the State police and other regulatory agencies seeking to keep adolescents away from gambling sites are doing a good job, in the opinion of the high school administrators.
Louisiana Problem Gamblers Helpline callers from Region 1 cited casino betting (79.2%) much more than any other activity. This was more than three times as many callers as the next most listed activity, slot/gambling machines (25.5%). One of the reasons for this might be that casino gaming is conducted within a more closed environment, generally, than are other activities, which might lead to people losing more money than they had originally budgeted upon visiting. Thus, this might induce them to feel that they have a problem. Also, since many casinos have the Gamblers Helpline toll-free number readily available, unlike other gaming venues, more casino patrons might call for assistance, compared to alternative activities.
When we compare the responses given by individuals from Region 1 to those from other areas of the State, we see that a higher percentage of them reported going to casinos than in any other area. They also went to casinos more frequently than did those from other sections of the State. Respondents ranked second overall in the percentage that play the lottery; those who do this do so more frequently than do those in other parts of the State. Also, a higher percentage of those interviewed from Region 1 played slot machines than from other sections of Louisiana. In total, a larger number of respondents here acknowledged that they gambled, and gambled more frequently than others did.
PROBLEM AND PATHOLOGICAL GAMBLING – REGION 1
surveys conducted during the summer of 2002. As can be seen, the rates of both problem and pathological gambling are higher within the region (from those sampled) than exists statewide. Due to the relatively small sample size within each of the regions, our estimations have a wide confidence interval, so it is difficult to measure the amount of problem and pathological gamblers within a region with any precision. However, the estimated number of problem (28,400) and pathological (28,400) gamblers should provide a somewhat accurate upper bound for this region.
TABLE 2, REGION 1 Indicators of Gambling Problems
Prevalence of Gambling Among Adolescents Gambling Helpline Callers Population
PARISH NO PROBLEMS SOME MINOR PROBLEMS SOME MAJOR PROBLEMS
PARISH CALLS ADULT POPULATION REGION SHARE OF POP ORLEANS (n=15) 20% (3) 40% (6) 40% (6)
ORLEANS 87.7% (N=93) 355,266 83.7% PLAQUEMINES (n=2) 0 100% (2)
0 PLAQUEMINES 4.7%
(N=5) 18,944 4.4% ST. BERNARD (n=1) 100% (1)
0 0 ST. BERNARD 7.5%
(N=8) 50,288 11.8% TOTALS (n=18) 22.2% (4) 44.5% (8) 33.3% (6)
TABLE 3, REGION 1 Prevalence of Gambling Activities
Telephone Interviews Principal Surveys Gambling Helpline
ACTIVITY EVER BET
ON
CONVERSION
RATE8 PROBLEM MAJOR PROBLEMS REPORTED
Played Cards 33.3 28.2 27.8% (5) 4.7% (5)
Bet on Animals 23.1 26.0 0 2.8% (3)
Bet on Sports 20.5 16.6 5.6% (1) 3.8% (4)
Dice Games 15.4 16.9 22.2% (5) 1.9% (2)
Went to Casino 70.1 23.1 0 79.2% (84)
Numbers/Lottery 48.8 40.8 0 12.3% (13)
Played Bingo 27.4 15.7 0 6.6% (7)
Stock Market 18.8 27.1 0 0
Slot/Gambling Machines
42.7 15.9 0 25.5% (27)
Played Sports or Games for Money
16.2 31.5 5.6% (1) 0
Pull Tabs/Paper Games for Money
12.1 21.5 5.6% (1) 0
Other 6.0 15.0 0 3.8% (4)
Total Responses N=117 N=18 N=106
TABLE 4, REGION 1 Problem Wagering and Pathological Gambling
Category Region 1 Statewide
Adult Population 424,498 3,233,151
Sample Size 117 1353
Estimated Prevalence of Problem Gambling 3.4% (6) 3.0% (41)
Estimated Prevalence of Pathological Gambling 3.4% (6) 1.6% (22)
Estimated Number of Problem Gamblers Up to 28,400 67,900 – 126,000
Estimated Number of Pathological Gamblers Up to 28,400 29,100 – 74,400
8 Conversion rate was computed by dividing the ‘once/week or more’ number by the ‘ever bet on’ number. It measures, of those who gamble on an activity, what percentage do so with frequency.