Hot Weather Load Test
Final Report October 2002 Stocker Center Ohio University Athens, OH 45701-29792. Government Accession No. 3. Recipient's Catalog No.
6. Performing Organization Code
8. Performing Organization Report No.
10. Work Unit No. (TRAIS)
12. Sponsoring Agency Name and Address
Ohio Department of Transportation 14. Sponsoring Agency Code
1980 West Broad Street Columbus, OH 43223
16. Abstract
The objectives of this project was to conduct vehicle loading tests on the Ohio SHRP Test Pavement (US23) sections under hot weather conditions, collect and analyze pavement response and vehicle dynamic load data, and examine the validity of existing rutting models. To accomplish these objectives, additional sensors (strain gauges and thermocouples) were installed at the SPS-8 sections of the Ohio-SHRP U.S. 23 Test Road. The FHWA Heavy Vehicle Test Truck was used to conduct load tests. The truck was loaded to 19.25 kips for all test series. Each series of test was repeated at least three times or until three different tire prints around the gauges were achieved. Four different sets of tires were used for these tests – two wide base tires and two sets of dual tires (M445 and G286wide base tires and G159 and M275 dual tires). Pavement temperatures and strain responses under truck loading test were collected during July 1996. The processed and cleaned load test data were delivered to ODOT and FHWA in CD-rom as text files. Series of laboratory tests were performed on the cores taken from the test pavements following laboratory test program prepared by FHWA. The laboratory test program included creep and relaxation tests, triangular pulse load tests with rise time varying from 4.5 to 36 milliseconds, with peak load varying from 360 to 2880 lb. For selected specimens, a repeated load tests were performed. Processed and cleaned laboratory test data were also submitted to ODOT and FHWA for further analysis.
9. Performing Organization Name and Address
Department of Civil Engineering Ohio University
Stocker Center Athens, Ohio 45701
11. Contract or Grant No.
State Job No. 14711(0)
1. Report No.
FHWA/OH2002/034
5. Report Date
October 2002
15. Supplementary Notes
Prepared in cooperation with the U.S. Department of Transportation, Federal Highway Administration
7. Author(s)
Dr. Shad Sargand
4. Title and Subtitle
Hot Weather Load Test
13. Type of Report and Period Covered
HOT WEATHER LOAD TEST FHWA/OH-2002/034
Principle Investigator: Dr. Shad Sargand Ohio Department of Transportation
State Job No.: 14711(0) October 2002
FOR COPIES OF THIS REPORT,CONTACT:
Ohio Department of Transportation Office of Research and Development
(614) 644-8173 [email protected]
The objectives of this project was to conduct vehicle loading tests on the Ohio SHRP Test Pavement (US23) sections under hot weather conditions, collect and analyze pavement response and vehicle dynamic load data, and examine the validity of existing rutting models. To accomplish these objectives, additional sensors (strain gauges and thermocouples) were installed at the SPS-8 sections of the Ohio-SHRP U.S. 23 Test Road. The FHWA Heavy Vehicle Test Truck was used to conduct load tests. The truck was loaded to 19.25 kips for all test series. Each series of test was repeated at least three times or until three different tire prints around the gauges were achieved. Four different sets of tires were used for these tests – two wide base tires and two sets of dual tires (M445 and G286wide base tires and G159 and M275 dual tires). Pavement temperatures and strain responses under truck loading test were collected during July 1996. The processed and cleaned load test data were delivered to ODOT and FHWA in CD-Rom as text files. Series of laboratory tests were performed on the cores taken from the test pavements following laboratory test program prepared by FHWA. The laboratory test program included creep and relaxation tests, triangular pulse load tests with rise time varying from 4.5 to 36 milliseconds, with peak load varying from 360 to 2880 lb. For selected specimens, a repeated load tests were performed. Processed and cleaned laboratory test data were also submitted to ODOT and FHWA for further analysis.
HOT WEATHER LOAD TEST Final Report
Prepared in cooperation with the:
OHIO DEPARTMENT OF TRANSPORTATION and the
U.S. DEPARTMENT OF TRANSPORTATION, FEDERAL HIGHWAY ADMINISTRATION
Compiled by:
Shad M. Sargand, Ohio University and staff from the
TABLE OF CONTENTS Page No. 1.0 INTRODUCTION ... 1 1.1 Problem Statement ... 1 1.2 Objectives ... 1 2.0 PROJECT SUMMARY ... 3
2.1 Task 1: Installation of additional sensors as part of the preparation of this ... project ... 3
2.2 Task 2: Controlled Load Test ... 3
2.3 Task 3: Laboratory Tests ... 9
2.3.1 Laboratory Test Procedures... 9
2.3.2 Test Results per Modified Laboratory Test Plan (Phase I) ... 11
2.3.3 Subtask 3.1. Creep and Relaxation Tests (Compression test only)... 13
2.3.4 Subtask 3.2 Triangular Pulse Load Test, Compression Only, No Confining Pressure... 13
2.3.5 Subtask 3.3: Repeated Cyclic Tests at 70°F, Compression Only, No Confining Pressure... 19
2.4 Task 4: Data Analysis ... 19
LIST OF TABLES Table 2.1 Truck Load Test Run Summary... 7
Table 2.2 Actual Truck Load Testing Time Line ... 8
Table 2.3 Summary of Uniaxial Creep/Relaxation Test ... 13
Table 2.4 Triangular Pulse Load Test at 70°F, Compression Only, ... No Confining Pressure... 15
Table 2.5 Triangular Pulse Load Test at 90°F, Compression Only, ... No Confining Pressure... 16
Table 2.6 Triangular Pulse Load Test at 110°F, Compression Only, ... No Confining Pressure... 18
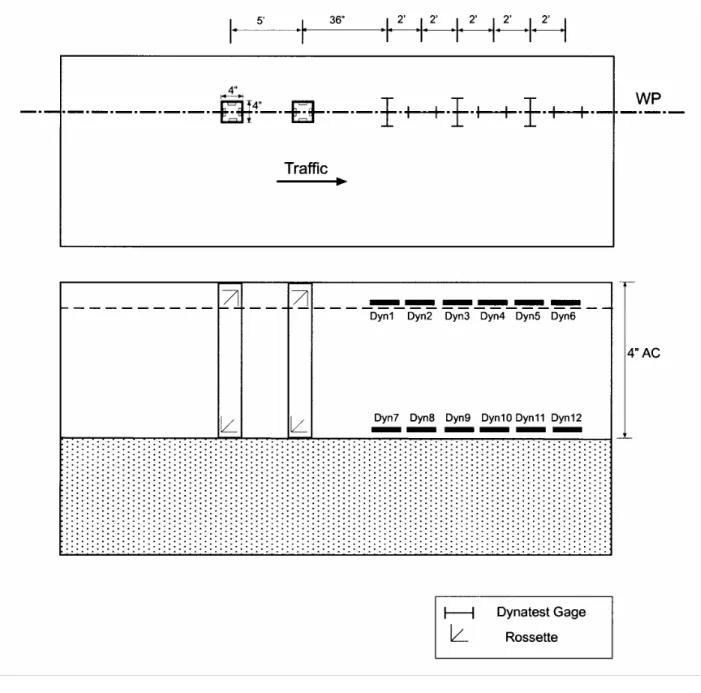
LIST OF FIGURES Figure 2.1 Instrumentation of 4 inch AC Section ... 4
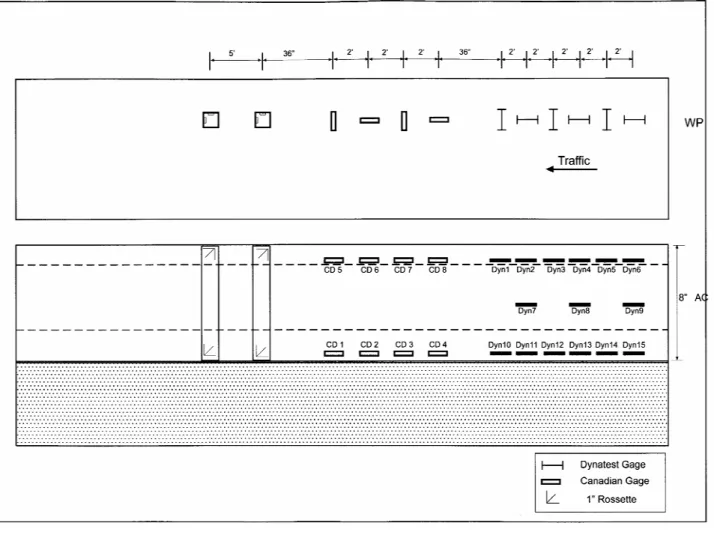
Figure 2.2 Instrumentation of 8 inch AC Section ... 5
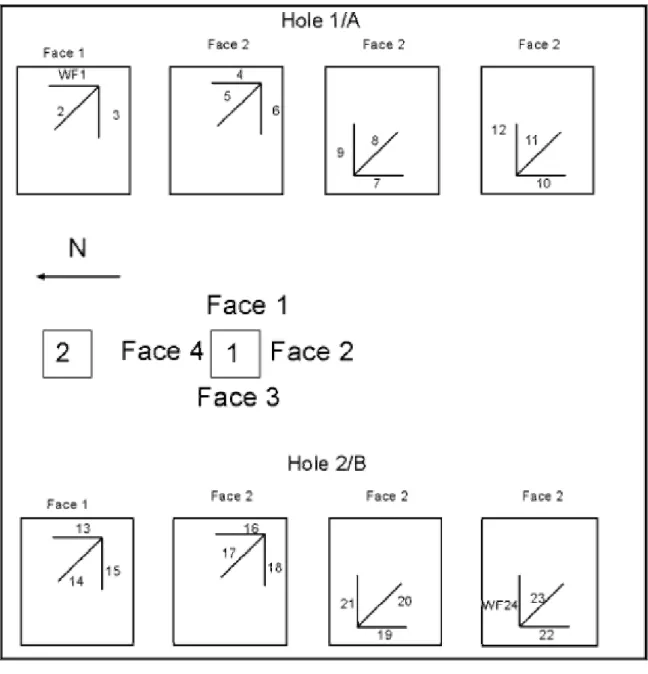
Figure 2.3 Strain Gauge Rosettes Installed in Square Holes of 4 inch AC Section... 6
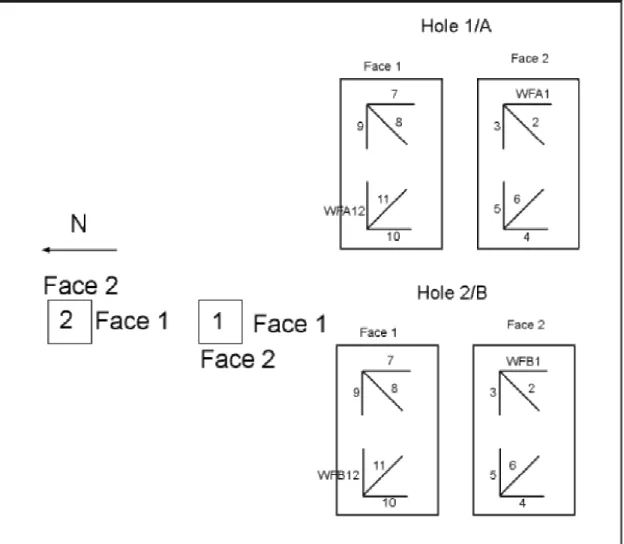
Figure 2.4 Strain Gauge Rosettes Installed in Square Holes of 8 inch AC Section... 7
Figure 2.5 Extensometer Set-up ... 11
1.0 INTRODUCTION 1.1 PROBLEM STATEMENT
During the fall 1997, sections of the Ohio-SHRP U.S. 23 Test Road were replaced. Additionally, two sections on the SPS-8 experiment were instrumented for further testing. The SPS-8 experiment includes four inch thick and seven inch thick Asphalt Concrete (AC) sections. Two hundred feet of the seven inch AC section was modified to an eight inch thick section with uniform materials throughout the depth. The controlled load test was performed on the four inch and eight inch AC sections. These sections were constructed over six inches of dense graded aggregate base.
During construction, several layers of sensors were placed. These included the Dynatest H-shaped gauges and Canadian Strain Gauges. In addition to the strain gauge instrumentation, cables were placed in the base at specific locations for future use. Four inch square holes were created above the location of the buried wires, and strain gauge rosettes were epoxied to the side of the holes. Thermocouples were also placed in the pavement sections at three different depths (top, middle, and bottom) of each section to be tested in this project.
1.2 OBJECTIVES
The objectives of this project were to conduct vehicle loading tests on the Ohio SHRP Test Pavement (US23) sections under hot weather conditions, collect and analyze pavement response and vehicle dynamic load data, and examine the validity of existing rutting models. To accomplish these objectives, the following tasks were performed:
Task 1 Installation of Additional Sensors as part of the preparation for this Project Task 2 Controlled Load Test
Task 3 Laboratory Tests Task 4 Data Analysis Task 5 Reporting Task 6 Work Plan
2.0 PROJECT SUMMARY
2.1 TASK 1: INSTALLATION OF ADDITIONAL SENSORS AS PART OF THE PREPARATION OF THIS PROJECT
During the fall 1997, sections of the Ohio-SHRP U.S. 23 Test Road were replaced. Additionally, two sections on the SPS-8 experiment were instrumented for further testing.
During construction, several layers of sensors were placed. These included the Dynatest H-shaped gauges and Canadian Strain Gauges. Strain gauges were placed as shown in Figures 1 and 2. In addition to the strain gauge instrumentation, cables were placed in the base at specific locations for future use. Four inch square holes were created above the location of the buried wires, and strain gauge rosettes were epoxied to the side of the holes as shown in Figures 3 and 4. Thermocouples were also placed in the pavement sections at three different depths (top, middle, and bottom) of each section to be tested in this project.
2.2 TASK 2: CONTROLLED LOAD TEST
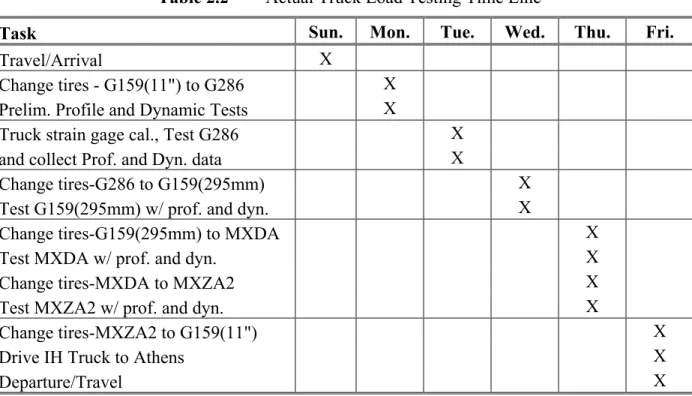
The FHWA Heavy Vehicle Test Truck was used to conduct the load tests. The truck was loaded to 19.25 kips for all test series. Each series of tests was repeated at least three times or until three different tire prints around the gauges were achieved. Four different sets of tires were used for these tests – two wide base tires and two sets of dual tires. The FHWA supplied the M445 wide base tires and both the G159 and M275 dual tires and Ohio University supplied the G286 wide base tires. Tire changes were conducted on-site as necessary. Table 1 summarizes the test runs and Table 2 outlines the sequence of events during the truck load testing.
Figure 2.4 Strain Gauge Rosettes Installed in Square Holes of 8 inch AC Section
Table 2.1 Truck Load Test Run Summary
Wide-Base (G286 & MXDA) Duals (G159 & MXZA2) Test
Series Speed (mph) Tire Pressure (psi) Series Test Speed (mph) Tire Pressure (psi)
1 5 70 10 5 70 2 25 70 11 25 70 3 55 70 12 55 70 4 5 100 13 5 100 5 25 100 14 25 100 6 55 100 15 55 100 7 5 120 16 5 120
Table 2.2 Actual Truck Load Testing Time Line
Task Sun. Mon. Tue. Wed. Thu. Fri.
Travel/Arrival X
Change tires - G159(11") to G286 X Prelim. Profile and Dynamic Tests X
Truck strain gage cal., Test G286 X
and collect Prof. and Dyn. data X
Change tires-G286 to G159(295mm) X
Test G159(295mm) w/ prof. and dyn. X
Change tires-G159(295mm) to MXDA X
Test MXDA w/ prof. and dyn. X
Change tires-MXDA to MXZA2 X
Test MXZA2 w/ prof. and dyn. X
Change tires-MXZA2 to G159(11") X
Drive IH Truck to Athens X
Departure/Travel X
Strain Gauge response data were collected using two Optim Electronic Megadac Systems. Temperature data from the thermocouple were collected using a portable temperature reader. In addition, weather condition data were monitored using the on-site weather station available for the test road.
Data was collected on July 21st, 22nd and 23rd 1998. The data acquisition systems collected dynamic data at a minimum rate of 1200 samples per second per sensor. Megadac number 1 collected data from sensors in the four inch section. The Megadac files were named SPS8A4 for all runs collected on the 21st, SPS8B4 for all runs collected on the 22nd, and SPS8C4 for all runs collected on the 23rd. Each run was identified by a run number starting with 001. A typical file name would be SPS8B4.008. This file would contain data collected from all the
sensors for that run. Sensor labels are as shown in Figure 2. Dynatest gauges were labeled Dyn1 through Dyn15 and the Canadian Strain Gauges were labeled CD1 through CD16. The rosette strain gauges epoxied in Hole A were labeled WFA1 through WFA12, and rosette strain gauges epoxied in Hole B were labeled WFB1 through WFB12, as shown in Figure 4. The processed and cleaned load test data were delivered to ODOT and FHWA in CD-Rom as text files.
2.3 TASK 3: LABORATORY TESTS
Laboratory tests were performed on the cores taken from the test pavement and followed the laboratory test program dated June 7, 2000 outlined by FHWA research personnel and revised April 10, 2001, also by FHWA. According to the FHWA laboratory test program, creep and relaxation tests were to be run at 40, 65, 90, and 115°F. Triangular pulse load tests were to be run at 70, 90 and 110°F. The laboratory test program included creep and relaxation tests, triangular pulse load tests with rise time varying from 4.5 to 36 milliseconds, with peak load varying from 360 to 2880 lb. For selected specimens, a repeated load tests were performed at 70°F only
Creep test, relaxation test, triangular pulse load test, and repeated cyclic load test were performed on 27 specimens following modified test plan (Phase I). All tested specimens together with 13 unused core specimens were saved for further testing. Phase I tests were performed in compression mode without confinement (uniaxial test). Following describes detailed test set-up/procedure and summary of test results.
In the FHWA requested laboratory test program (dated June 7, 2000 and revised April 10, 2001), the resilient modulus tests were not included.
2.3.1 Laboratory Test Procedures
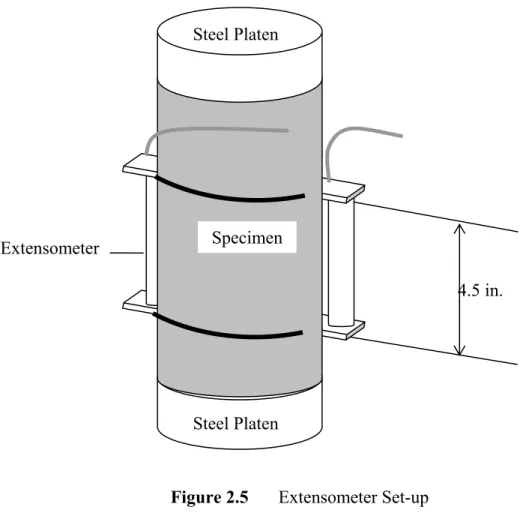
1. Creep and relaxation tests were performed as described in the Phase I plan. For measurement of vertical deformation, a set of two 4.5 inch gauge length extensometers was mounted at the opposite sides at the middle height of the specimen, as shown in Figure 5. Some of the creep tests at high temperature and high stress levels could not be performed because of specimen failure. Creep tests were conducted with 180 seconds of loading immediately followed by
2. Triangular pulse load tests were performed in load-control mode following the procedures described below.
a) Each pulse shape was defined by specifying the initial base load and peak load, time to reach the peak load and base load, and times to reach the base load (file-playback command in MTS software was used for this task).
b) For each pulse type (A1, A2) and each temperature, using a laboratory prepared asphalt specimen, the MTS test system was tuned to produce the desired triangular shape of load pulse (peak load and rise time). For deformation measurements, a set of two 4.5 inch gauge length extensometers was mounted at the middle height of the specimen.
c) The best possible MTS tuning parameter values (PDIF) were recorded for each pulse type and temperature.
d) The trimmed core specimens were tested following the desired test sequence. For each pulse type, MTS PDIF (tuning parameters in MTS system) was set to the values determined in step b.
e) Nearly every time, the first pulse load applied to the specimen produced a much lower peak load than the desired load level due to large plastic deformation that existed at the beginning of bituminous materials testing. Usually, repeating the test without changing any MTS tuning parameters produced a pulse closer to the desired pulse shape.
f) Occasionally, PDIF values needed re-adjustment. The repeated tests were labeled as A1b, A1c, and so on.
g) At the very short rise time (4.5 milliseconds), there were vibratory noise in the displacement measurement. The noise was cleaned using the Fourier transform in MS Excel and the cleaned data were compared with the original data to check the reasonableness of the data cleaning.
Figure 2.5 Extensometer Set-up
2.3.2 Test Results per Modified Laboratory Test Plan (Phase I)
All test data are stored in the accompanied CD. As shown in Figure 6, the CD contains 6 directories for the different types of tests performed; creep, relaxation, pulse tests at 70, 90, and 110°F and cyclic tests at 70°F. The contents of these 6 directories are also shown in Figure 6.
Extensometer
4.5 in.
Steel Platen Steel Platen
2.3.3 Subtask 3.1. Creep and Relaxation Tests (Compression test only)
Six data files are stored in the 'Creep Test' directory and another six data files are stored in the 'Relaxation Test' directory. In the file name, for example, "T1S15", "T1" represents Test #1 (called as Specimen # on the original FHWA laboratory test plan) and "S15" represents the specimen ID assigned by the field engineer who drilled the cores. The last worksheet in the Excel file, usually named as "SX-1", contains raw data [Time (sec), Actuator Displacement (in.), Load Cell (lb), and Extensometer (in.)] and calculated stress and strain using Load Cell and Extensometer values. Creep and relaxation plots are also included in the Excel files. Table 3 summarizes the creep/relaxation tests performed. All creep and relaxation curves are saved in the respective Excel files.
Table 2.3 Summary of Uniaxial Creep/Relaxation Test Test
Number
Sample ID
Temperature
°F Creep/Relax Test Sequence
1 15 40 Creep 10, 20, 40, 80, 160 psi 2 39 40 Relax 50, 100, 200 µε 3 42 40 Creep 10, 20, 40, 80, 160 psi 4 38 65 Relax 50, 100, 200, 400 µε 5 28 65 Creep 10, 20, 40, 80, 160 psi 6 29 65 Relax 50, 100, 200, 400 µε 7 30 90 Creep 10, 20, 40, 80 psi 8 20 90 Relax 50, 100, 200, 400, 800 µε 9 101 90 Creep 10, 20, 40, 80 psi 10 37 115 Relax 50, 100, 200, 400, 800 µε 11 35 115 Creep 10, 20 psi 12 12 115 Relax 50, 100, 200, 400, 800 µε
2.3.4 Subtask 3.2 Triangular Pulse Load Test, Compression Only, No Confining Pressure
Five specimens were used for each of three test temperatures; 70, 90, and 110°F. Results of each pulse load applied to a specimen were saved as a separate Excel file. The last worksheet of each Excel file contains the raw data [Time (sec), Load Cell (lb), and Extensometer [C] (in.)] and calculated stress, and if needed, filtered strain [clean data], unfiltered strain [original], and
transform is used, the extensometer deformation plot on frequency domain, the plot of stress and filtered strain on time domain, and the plot of filtered and unfiltered strains versus time are included. Results of the 70, 90, and 110°F test results are summarized in Tables 4-6 and their plots are saved in respective Excel files. The tables include actual load, stress, stress-rate and strain-rate at the straight portions of loading/unloading curves.
Table 2.4 Triangular Pulse Load Test at 70°F, Compression Only, No Confining Pressure
Loading Unloading
Test Number
File Name & Sequence of Testing Intended Peak Load, lb Intended Rise Time, ms Actual Peak Stress, psi Actual Peak Load, lb. Stress Rate, psi/ms Strain Rate, µε/ms Stress Rate, psi/ms Strain Rate, µε/ms T18S8C_1 A1 360 4.5 34.8 438 8.0 8.8 7.0 9.7 T18S8C_1b A1 360 4.5 51.2 643 9.2 13.7 10.4 9.2 T18S8C_2 B1 720 4.5 49.3 619 9.2 15.0 11.3 13.2 T18S8C_3 C1 1440 4.5 78.9 992 12.9 22.5 13.8 19.4 T18S8C_4 D1 2880 4.5 102.3 1286 16.0 32.1 17.9 21.7 18 T18S8C_4b D1 2880 4.5 112.0 1407 16.7 33.3 18.5 21.8 T19S33C_1 A2 360 9 23.9 300 2.7 6.2 2.1 2.8 T19S33C_0 A2 360 9 40.2 505 5.9 12.9 6.1 10.0 T19S33C_2 B2 720 9 51.7 649 7.5 13.9 4.1 7.1 T19S33C_3 C2 1440 9 105.2 1322 11.7 25.9 11.4 15.7 19 T19S33C_4 D2 2880 9 208.8 2623 21.7 50.0 22.7 35.3 T21S13C_1 A4 360 36 22.4 282 0.8 1.7 0.6 0.9 T21S13C_2 B4 720 36 52.8 663 2.3 6.5 1.6 2.6 T21S13C_3 C4 1440 36 121.8 1530 4.1 11.6 3.2 5.0 21 T21S13C_4 D4 2880 36 220.5 2771 6.8 22.7 5.8 9.7 T13S31_A1 A1 360 4.5 25.7 323.2 0.8 2.4 0.8 1.3 T13S31_A2 A2 360 9 19.1 239.6 2.0 4.0 1.5 3.5 T13S31_A3 A3 360 18 24.4 306.5 1.3 3.8 1.0 2.0 T13S31_A4 A4 360 36 24.6 308.8 0.8 2.4 0.7 1.4 T13S31_B1 B1 720 4.5 59.5 747.1 12.0 22.2 14.0 20.9 T13S31_B2 B2 720 9 47.4 595.0 5.1 9.8 4.5 10.2 T13S31_B3 B3 720 18 56.8 713.5 3.3 8.2 2.9 4.8 T13S31_B4 B4 720 36 57.2 718.2 1.8 5.4 1.6 2.9 T13S31_C1 C1 1440 4.5 111.0 1394.2 17.9 36.2 18.2 24.4 T13S31_C2 C2 1440 9 109.2 1372.0 12.2 26.9 11.0 13.0 T13S31_C3 C3 1440 18 109.9 1380.5 5.6 14.0 5.2 8.0 13 T13S31_C4 C4 1440 36 109.6 1377.4 3.2 9.8 3.0 4.9 T15S7_B1 B1 720 4.5 5.5 68.9 T15S7_B1(b) B1 720 4.5 48.6 610.6 10.3 16.1 12.7 15.7 T15S7_B2 B2 720 9 57.5 722.2 6.9 11.7 5.4 6.9 T15S7_B3 B3 720 18 59.1 742.8 3.4 7.7 3.3 4.3 T15S7_B4 B4 720 36 59.7 749.6 1.8 5.1 1.7 2.4 T15S7_C1 C1 1440 4.5 126.2 1585.5 21.2 33.8 20.9 21.4 T15S7_C2 C2 1440 9 121.5 1527.2 14.3 21.6 13.1 14.0 T15S7_C3 C3 1440 18 120.1 1509.2 6.1 11.9 6.1 7.5 T15S7_C4 C4 1440 36 115.8 1455.2 3.5 8.2 3.2 4.3 T15S7_D1 D1 2880 4.5 154.5 1941.8 23.1 36.6 22.8 26.9 T15S7_D1(b) D1 2880 4.5 161.1 2024.7 22.0 36.8 20.9 29.0 15
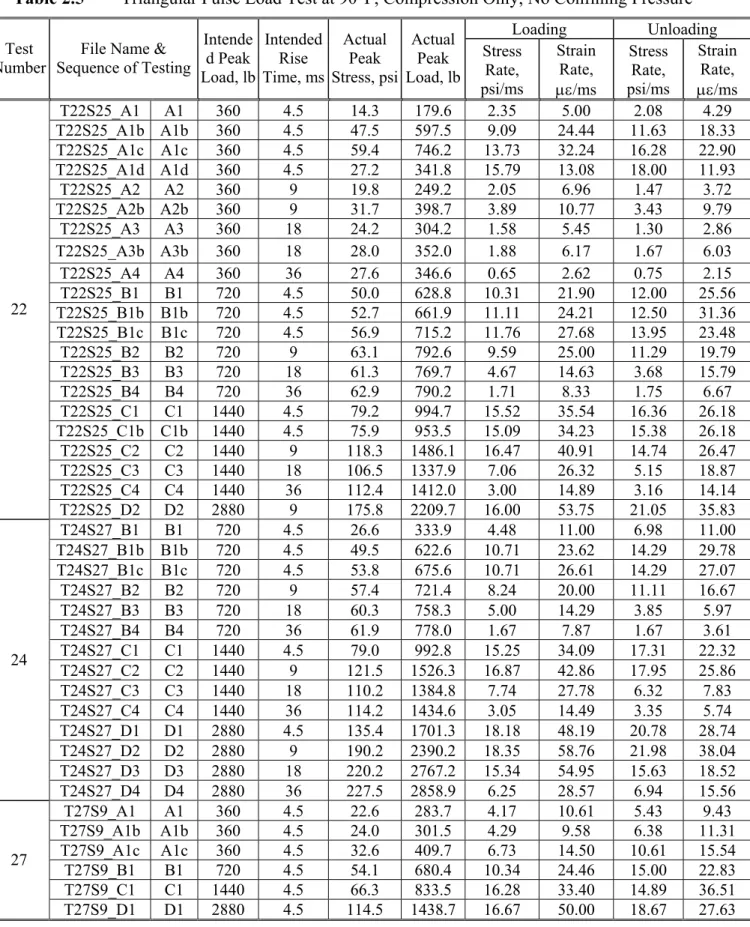
Table 2.5 Triangular Pulse Load Test at 90°F, Compression Only, No Confining Pressure
Loading Unloading Test
Number
File Name & Sequence of Testing Intende d Peak Load, lb Intended Rise Time, ms Actual Peak Stress, psi Actual Peak Load, lb Stress Rate, psi/ms Strain Rate, µε/ms Stress Rate, psi/ms Strain Rate, µε/ms T22S25_A1 A1 360 4.5 14.3 179.6 2.35 5.00 2.08 4.29 T22S25_A1b A1b 360 4.5 47.5 597.5 9.09 24.44 11.63 18.33 T22S25_A1c A1c 360 4.5 59.4 746.2 13.73 32.24 16.28 22.90 T22S25_A1d A1d 360 4.5 27.2 341.8 15.79 13.08 18.00 11.93 T22S25_A2 A2 360 9 19.8 249.2 2.05 6.96 1.47 3.72 T22S25_A2b A2b 360 9 31.7 398.7 3.89 10.77 3.43 9.79 T22S25_A3 A3 360 18 24.2 304.2 1.58 5.45 1.30 2.86 T22S25_A3b A3b 360 18 28.0 352.0 1.88 6.17 1.67 6.03 T22S25_A4 A4 360 36 27.6 346.6 0.65 2.62 0.75 2.15 T22S25_B1 B1 720 4.5 50.0 628.8 10.31 21.90 12.00 25.56 T22S25_B1b B1b 720 4.5 52.7 661.9 11.11 24.21 12.50 31.36 T22S25_B1c B1c 720 4.5 56.9 715.2 11.76 27.68 13.95 23.48 T22S25_B2 B2 720 9 63.1 792.6 9.59 25.00 11.29 19.79 T22S25_B3 B3 720 18 61.3 769.7 4.67 14.63 3.68 15.79 T22S25_B4 B4 720 36 62.9 790.2 1.71 8.33 1.75 6.67 T22S25_C1 C1 1440 4.5 79.2 994.7 15.52 35.54 16.36 26.18 T22S25_C1b C1b 1440 4.5 75.9 953.5 15.09 34.23 15.38 26.18 T22S25_C2 C2 1440 9 118.3 1486.1 16.47 40.91 14.74 26.47 T22S25_C3 C3 1440 18 106.5 1337.9 7.06 26.32 5.15 18.87 T22S25_C4 C4 1440 36 112.4 1412.0 3.00 14.89 3.16 14.14 22 T22S25_D2 D2 2880 9 175.8 2209.7 16.00 53.75 21.05 35.83 T24S27_B1 B1 720 4.5 26.6 333.9 4.48 11.00 6.98 11.00 T24S27_B1b B1b 720 4.5 49.5 622.6 10.71 23.62 14.29 29.78 T24S27_B1c B1c 720 4.5 53.8 675.6 10.71 26.61 14.29 27.07 T24S27_B2 B2 720 9 57.4 721.4 8.24 20.00 11.11 16.67 T24S27_B3 B3 720 18 60.3 758.3 5.00 14.29 3.85 5.97 T24S27_B4 B4 720 36 61.9 778.0 1.67 7.87 1.67 3.61 T24S27_C1 C1 1440 4.5 79.0 992.8 15.25 34.09 17.31 22.32 T24S27_C2 C2 1440 9 121.5 1526.3 16.87 42.86 17.95 25.86 T24S27_C3 C3 1440 18 110.2 1384.8 7.74 27.78 6.32 7.83 T24S27_C4 C4 1440 36 114.2 1434.6 3.05 14.49 3.35 5.74 24
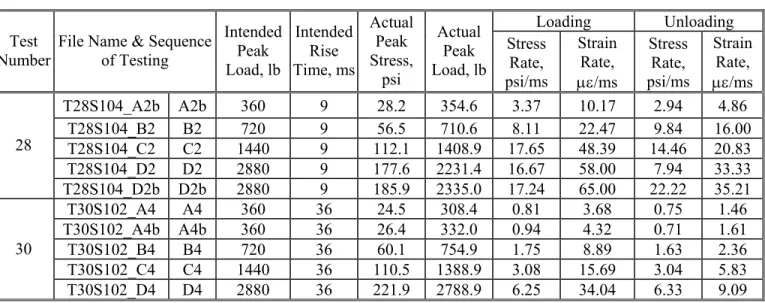
Table 2.5 Triangular Pulse Load Test at 90°F, Compression Only, No Confining Pressure
Loading Unloading Test
Number
File Name & Sequence of Testing Intended Peak Load, lb Intended Rise Time, ms Actual Peak Stress, psi Actual Peak Load, lb Stress Rate, psi/ms Strain Rate, µε/ms Stress Rate, psi/ms Strain Rate, µε/ms T28S104_A2b A2b 360 9 28.2 354.6 3.37 10.17 2.94 4.86 T28S104_B2 B2 720 9 56.5 710.6 8.11 22.47 9.84 16.00 T28S104_C2 C2 1440 9 112.1 1408.9 17.65 48.39 14.46 20.83 T28S104_D2 D2 2880 9 177.6 2231.4 16.67 58.00 7.94 33.33 28 T28S104_D2b D2b 2880 9 185.9 2335.0 17.24 65.00 22.22 35.21 T30S102_A4 A4 360 36 24.5 308.4 0.81 3.68 0.75 1.46 T30S102_A4b A4b 360 36 26.4 332.0 0.94 4.32 0.71 1.61 T30S102_B4 B4 720 36 60.1 754.9 1.75 8.89 1.63 2.36 T30S102_C4 C4 1440 36 110.5 1388.9 3.08 15.69 3.04 5.83 30 T30S102_D4 D4 2880 36 221.9 2788.9 6.25 34.04 6.33 9.09
Table 2.6 Triangular Pulse Load Test at 110°F, Compression Only, No Confining Pressure
Loading Unloading Test
Number
File Name & Sequence of Testing Intended Peak Load, lb Intended Rise Time, ms Actual Peak Stress, psi Actual Peak Load, lb Stress Rate, psi/ms Strain Rate, µε/ms Stress Rate, psi/ms Strain Rate, µε/ms T31S40_A1 A1 360 4.5 17.3 100.4 4.17 19.54 2.99 11.39 T31S40_A1b A1b 360 4.5 40.0 242.0 8.49 53.39 9.78 35.71 T31S40_A2 A2 360 9 25.3 206.6 3.00 8.11 2.03 9.00 T31S40_A3 A3 360 18 29.0 281.1 1.75 15.91 1.75 7.35 T31S40_A4 A4 360 36 28.31 329.1 .79 9.09 .71 3.68 T31S40_B1 B1 720 4.5 57.26 334.3 12.50 72.73 12.73 45.00 T31S40_B2 B2 720 9 52.2 377.6 8.00 48.75 6.59 30.00 T31S40_B3 B3 720 18 56.7 525.6 4.00 13.61 3.49 13.88 T31S40_B4 B4 720 36 56.4 653.6 1.58 17.78 1.58 8.06 T31S40_C1 C1 1440 4.5 109.3 706.2 14.29 95.68 16.90 59.09 T31S40_C2 C2 1440 9 107.5 831.9 13.33 90.91 13.33 40.77 T31S40_C3 C3 1440 18 108.7 976.5 6.59 58.09 5.11 17.61 31 T31S40_C4 C4 1440 36 108.9 1147.4 1.62 30.19 2.73 12.37 T33S106_B1 B1 720 4.5 51.03 299.5 10.00 56.56 13.33 38.46 T33S106_B2 B2 720 9 57.7 378.8 9.72 51.72 10.14 31.08 T33S106_B3 B3 720 18 59.6 508.1 4.32 33.33 3.59 10.95 T33S106_B4 B4 720 36 58.0 637.5 1.67 18.39 1.56 6.58 T33S106_C1 C1 1440 4.5 114.4 663.6 18.92 73.68 17.72 48.28 T33S106_C2 C2 1440 9 115.8 785.3 14.74 88.50 15.56 40.27 T33S106_C3 C3 1440 18 107.6 937.9 7.50 57.14 4.74 14.48 T33S106_C4 C4 1440 36 110.0 1136.0 2.96 30.77 2.89 8.77 T33S106_D2 D2 2880 9 180.8 1197.7 15.38 102.82 21.05 58.33 T33S106_D2b D2b 2880 9 177.01 1179.7 15.90 102.10 19.61 61.90 T33S106_D3 D3 2880 18 219.7 1758.9 14.29 110.00 21.74 50.55 33 T33S106_D4 D4 2880 36 219.3 2174.3 6.25 65.22 6.58 27.78 T36S107_A1 A1 360 4.5 28.1 164.8 5.17 34.40 6.38 22.37 T36S107_B1 B1 720 4.5 42.8 289.7 8.93 54.24 11.63 28.12 T36S107_B1b B1b 720 4.5 46.6 268.3 10.87 53.70 11.11 31.52 36 T36S107_C1 C1 1440 4.5 85.0 511.7 11.39 76.87 15.00 41.67 T37S41_A2 A2 360 9 22.4 151.9 2.17 13.85 1.69 4.17
2.3.5 Subtask 3.3: Repeated Cyclic Tests at 70°F, Compression Only, No Confining Pressure
Three specimens tested for pulse load tests were used for repeated cyclic tests. Fifty cycles of pulse shape C3 (1440 lb peak load and 18 millisecond rise time) were applied. Plots of the test results (load and displacement versus time) were saved in respective Excel files together with the raw data.
2.4 TASK 4:DATA ANALYSIS
During the project it was decided that Ohio University collects load test and laboratory data and FHWA analyzes the data and verifies the rutting model. The processed and cleaned data from the controlled load tests and laboratory tests were submitted to FHWA for analysis. Copies of the data on CD were also submitted to ODOT.