Analysis Manual
SPSS
®
SECOND EDITION
performances in reading, mathematics and science, as well as contextual information on students’ background, home characteristics and school factors which could influence performance. The initial results for PISA 2000 is found in Knowledge and Skills for Life – First Results from PISA 2000 (OECD, 2001), for PISA 2003 in Learning for Tomorrow’s World – First Results from PISA 2003 (OECD, 2004) and for PISA 2006 in PISA 2006: Science Competencies for Tomorrow’s World (OECD, 2007).
This publication is an essential tool for researchers, as it provides all the information required to understand the PISA databases and perform analyses in accordance with the complex methodologies used to collect and process the data. It includes detailed information on how to analyse the PISA data, enabling researchers to both reproduce the published results and to undertake further analyses. In addition to the inclusion of the necessary techniques, the manual also includes a detailed account of the PISA 2006 database.
This publication is a revised edition of the PISA 2003 Data Analysis Manual (OECD, 2005). The chapters in the manual are expanded to cover various analytical issues in PISA in general, while applying examples from all available PISA surveys – PISA 2000, PISA 2003 and PISA 2006.
The publication includes:
– introductory chapters explaining the statistical theories and concepts required to analyse the PISA data, including full chapters on how to apply replicate weights and undertake analyses using plausible values; – worked examples providing full syntax in SPSS® ; and
– a comprehensive description of the OECD PISA 2006 international database.
THE OECD PROGRAMME FOR INTERNATIONAL STUDENT ASSESSMENT (PISA)
PISA is a collaborative process among the 30 member countries of the OECD and nearly 30 partner countries and economies. It brings together expertise from the participating countries and economies and is steered by their governments on the basis of shared, policy-driven interests. Its unique features include:
– The literacy approach: PISA defines each assessment area (science, reading and mathematics) not mainly in terms of mastery of the school curriculum, but in terms of the knowledge and skills needed for full participation in society.
– A long-term commitment: It enables countries to monitor regularly and predictably their progress in meeting key learning objectives.
– The age-group covered: By assessing 15-year-olds, i.e. young people near the end of their compulsory education, PISA provides a significant indication of the overall performance of school systems.
– The relevance to lifelong learning: PISA does not limit itself to assessing students’ knowledge and skills but also asks them to report on their own motivation to learn, their beliefs about themselves and their learning strategies, as well as on their goals for future study and careers.
PISA Data Analysis Manual
SPSS
®
Second Edition
ISBN 978-92-64-05626-8 98 2009 03 1P The full text of this book is available on line via this link:
www.sourceoecd.org/education/9789264056268
Those with access to all OECD books on line should use this link: www.sourceoecd.org/9789264056268
SourceOECD is the OECD’s online library of books, periodicals and statistical databases.
For more information about this award-winning service and free trials ask your librarian, or write to us at [email protected].
www.oecd.org/publishing
www.pisa.oecd.org
Data Analysis Manual
SPSS, SECOND EDITION
address the economic, social and environmental challenges of globalisation. The OECD is also at the forefront of efforts to understand and to help governments respond to new developments and concerns, such as corporate governance, the information economy and the challenges of an ageing population. The Organisation provides a setting where governments can compare policy experiences, seek answers to common problems, identify good practice and work to co-ordinate domestic and international policies.
The OECD member countries are: Australia, Austria, Belgium, Canada, the Czech Republic, Denmark, Finland, France, Germany, Greece, Hungary, Iceland, Ireland, Italy, Japan, Korea, Luxembourg, Mexico, the Netherlands, New Zealand, Norway, Poland, Portugal, the Slovak Republic, Spain, Sweden, Switzerland, Turkey, the United Kingdom and the United States. The Commission of the European Communities takes part in the work of the OECD.
OECD Publishing disseminates widely the results of the Organisation’s statistics gathering and research on economic, social and environmental issues, as well as the conventions, guidelines and standards agreed by its members.
Corrigenda to OECD publications may be found on line at: www.oecd.org/publishing/corrigenda.
PISATM,OECD/PISATM and the PISA logo are trademarks of the Organisation for Economic Co-operation and Development (OECD). All use of OECD trademarks is prohibited without written permission from the OECD.
© OECD 2009
You can copy, download or print OECD content for your own use, and you can include excerpts from OECD publications, databases and multimedia products in your own documents, presentations, blogs, websites and teaching materials, provided that suitable acknowledgment of OECD as source
and copyright owner is given. All requests for public or commercial use and translation rights should be submitted to[email protected]. Requests for
permission to photocopy portions of this material for public or commercial use shall be addressed directly to the Copyright Clearance Center (CCC) at[email protected] or the Centre français d'exploitation du droit de copie (CFC)[email protected].
This work is published on the responsibility of the Secretary-General of the OECD. The opinions expressed and arguments employed herein do not necessarily reflect the official views of the Organisation or of the governments of its member countries.
The OECD Programme for International Student Assessment (PISA) surveys, which take place every three years, have been designed to collect information about 15-year-old students in participating countries. PISA examines how well students are prepared to meet the challenges of the future, rather than how well they master particular curricula. The data collected during each PISA cycle are an extremely valuable source of information for researchers, policy makers, educators, parents and students. It is now recognised that the future economic and social wellbeing of countries is closely linked to the knowledge and skills of their populations. The internationally comparable information provided by PISA allows countries to assess how well their 15-year-old students are prepared for life in a larger context and to compare their relative strengths and weaknesses. The initial results for PISA 2000 is found inKnowledge and Skills for Life – First Results from PISA 2000(OECD, 2001), for PISA 2003 inLearning for Tomorrow’s World – First Results from PISA 2003(OECD, 2004a) and for PISA 2006 in PISA 2006: Science Competencies for Tomorrow’s World
(OECD, 2007).
ThePISA Data Analysis Manual has been developed to provide researchers with various techniques needed to correctly analyse the complex databases. It helps researchers confidently replicate procedures used for the production of the PISA initial reports and thematic reports, and accurately undertake new analyses in areas of special interest. In addition to the inclusion of the necessary techniques, the manual also includes a detailed account of the PISA 2006 database. This information for PISA 2000 is found in thePISA 2000 Database Manual
(OECD, 2002a) and for PISA 2003 in thePISA 2003 Data Analysis Manual (OECD, 2005b)
ThisPISA Data Analysis Manual is a revised edition of thePISA 2003 Data Analysis Manual (OECD, 2005b). The chapters in the manual are expanded to cover various analytical issues in PISA in general, while applying examples from all available PISA surveys – PISA 2000, PISA 2003 and PISA 2006.
The following new features are included in this manual:
•Chapter 1 is expanded to include how the PISA data can be used, and what can be examined with the
PISA data for various stakeholders such as policy makers, researchers, experts on survey methodology. •Chapter 2 is new and provides a brief description of important features of the PISA data and a section
introducing “shortcut” approaches which will facilitate the cumbersome computation process using plausible values and replicate weights. This chapter also provides a detailed description of when these shortcut approaches can be used as well as advantages and disadvantages of using them.
•Chapters 3 to 13 are largely based on the PISA 2003 Data Analysis Manual (OECD, 2005b), but the
following updates and modifications are implemented in the macros.
– The macro for regression analysis has a new function to compute R-square and its standard error. – All macros have a new function of flagging “cautious” statistics which are based on too few observations.
Users can set the criteria for the minimum number of students and schools as well as the minimum percentage.
• Chapter 14 is expanded to include more examples such as added values analysis, which examines the student residuals of a regression with school factors. The following new macros intended to facilitate computation are also presented:
– macro for quartile of indices and mean performance by the quartile with standard errors, – macro for relative risk,
– macro for effect size.
• Chapter 15 is expanded to include an introduction to a three-level model. Macros for multilevel (two-level) regression are also developed and these provide the decomposition of variance of continuous variables. • Chapter 16 is new and provides three examples of possible analysis with the PISA data.
PISA is a collaborative effort by its participating countries, guided by their governments on the basis of shared policy-driven interests. Representatives of each country form the PISA Governing Board, which decides on the assessment and reporting of results in PISA.
There are two versions of this manual – one for SAS®users and one for SPSS® users. The OECD recognises
the creative work of Christian Monseur in preparing the text, syntax and macros for both versions of the manual. The coding for the SPSS® user manual was prepared by Eveline Gebhardt and Alexander Daraganov.
The main editorial work was carried out by Miyako Ikeda, Sophie Vayssettes and Maciej Jakubowski in the OECD secretariat with the help of Julie Harris. The PISA assessments and the data underlying the manuals were prepared by the PISA Consortium under the direction of Raymond Adams.
Ryo Watanabe
Chair of the PISA Governing Board
Barbara Ischinger
FOREWORD...3
USER’S GUIDE...17
CHAPTER 1 THE USEFULNESS OF PISA DATA FOR POLICY MAKERS, RESEARCHERS AND EXPERTS ON METHODOLOGY...19
PISA – an overview...20
•The PISA surveys...20
How can PISA contribute to educational policy, practice and research?...22
• Key results from PISA 2000, PISA 2003 and PISA 2006...23
Further analyses of PISA datasets...25
•Contextual framework of PISA 2006...28
• Influence of the methodology on outcomes...31
CHAPTER 2EXPLORATORY ANALYSIS PROCEDURES...35
Introduction...36
Weights...36
Replicates for computing the standard error...39
Plausible values...43
Conclusion...45
CHAPTER 3SAMPLE WEIGHTS...47
Introduction...48
Weights for simple random samples...49
Sampling designs for education surveys...51
Why do the PISA weights vary?...55
Conclusion...56
CHAPTER 4REPLICATE WEIGHTS...57
Introduction...58
Sampling variance for simple random sampling...58
Sampling variance for two-stage sampling...63
Replication methods for simple random samples...68
Replication methods for two-stage samples...70
•The Jackknife for unstratified two-stage sample designs...70
•The Jackknife for stratified two-stage sample designs...71
•The Balanced Repeated Replication method...72
Other procedures for accounting for clustered samples...74
CHAPTER 5 THE RASCH MODEL...77
Introduction...78
How can the information be summarised?...78
The Rasch Model for dichotomous items...79
• Introduction to the Rasch Model...79
• Item calibration...83
•Computation of a student’s score...85
•Computation of a student’s score for incomplete designs...89
•Optimal conditions for linking items...90
•Extension of the Rasch Model...91
Other item response theory models...92
Conclusion...92
CHAPTER 6 PLAUSIBLE VALUES...93
Individual estimates versus population estimates...94
The meaning of plausible values (PVs)...94
Comparison of the efficiency of WLEs, EAP estimates and PVs for the estimation of some population statistics...97
How to perform analyses with plausible values...100
Conclusion...101
CHAPTER 7COMPUTATION OF STANDARD ERRORS...103
Introduction...104
The standard error on univariate statistics for numerical variables...104
The SPSS® macro for computing the standard error on a mean...107
The standard error on percentages...110
The standard error on regression coefficients...112
The standard error on correlation coefficients...114
Conclusion...115
CHAPTER 8 ANALYSES WITH PLAUSIBLE VALUES...117
Introduction...118
Univariate statistics on plausible values...118
The standard error on percentages with PVs...121
The standard error on regression coefficients with PVs...121
The standard error on correlation coefficients with PVs...124
Correlation between two sets of plausible values...124
A fatal error shortcut...128
An unbiased shortcut...129
Conclusion...130
CHAPTER 9 USE OF PROFICIENCY LEVELS...133
Introduction...134
Generation of the proficiency levels...134
Other analyses with proficiency levels...139
CHAPTER 10 ANALYSES WITH SCHOOL-LEVEL VARIABLES...143
Introduction...144
Limits of the PISA school samples...145
Merging the school and student data files...146
Analyses of the school variables...146
Conclusion...148
CHAPTER 11STANDARD ERROR ON A DIFFERENCE...149
Introduction...150
Statistical issues and computing standard errors on differences...150
The standard error on a difference without plausible values...152
The standard error on a difference with plausible values...157
Multiple comparisons...161
Conclusion...162
CHAPTER 12OECD TOTAL AND OECD AVERAGE...163
Introduction...164
Recoding of the database to estimate the pooled OECD total and the pooled OECD average...166
Duplication of the data to avoid running the procedure three times...168
Comparisons between the pooled OECD total or pooled OECD average estimates and a country estimate...169
Comparisons between the arithmetic OECD total or arithmetic OECD average estimates and a country estimate...171
Conclusion...171
CHAPTER 13 TRENDS...173
Introduction...174
The computation of the standard error for trend indicators on variables other than performance...175
The computation of the standard error for trend indicators on performance variables...177
Conclusion...181
CHAPTER 14STUDYING THE RELATIONSHIP BETWEEN STUDENT PERFORMANCE AND INDICES DERIVED FROM CONTEXTUAL QUESTIONNAIRES...183
Introduction...184
Analyses by quarters...184
The concept of relative risk...186
• Instability of the relative risk...187
•Computation of the relative risk...188
Effect size...191
Linear regression and residual analysis...193
• Independence of errors...193
Statistical procedure...196
CHAPTER 15 MULTILEVEL ANALYSES...199
Introduction...200
Two-level modelling with SPSS®...202
• Decomposition of the variance in the empty model...202
• Models with only random intercepts...205
• Shrinkage factor...207
• Models with random intercepts and fixed slopes...207
• Models with random intercepts and random slopes...209
• Models with Level 2 independent variables...214
•Computation of final estimates and their respective standard errors...217
Three-level modelling...219
Limitations of the multilevel model in the PISA context...221
Conclusion...222
CHAPTER 16 PISA AND POLICY RELEVANCE – THREE EXAMPLES OF ANALYSES...223
Introduction...224
Example 1: Gender differences in performance...224
Example 2: Promoting socio-economic diversity within school?...228
Example 3: The influence of an educational system on the expected occupational status of students at age 30...234
Conclusion...237
CHAPTER 17SPSS® MACRO...239
Introduction...240
Structure of the SPSS® Macro...240
REFERENCES...321
APPENDICES...323
Appendix 1 Three-level regression analysis...324
Appendix 2 PISA 2006 International database...332
Appendix 3 PISA 2006 Student questionnaire...341
Appendix 4 PISA 2006 Information communication technology (ICT) Questionnaire...350
Appendix 5 PISA 2006 School questionnaire...352
Appendix 6 PISA 2006 Parent questionnaire...359
Appendix 7 Codebook for PISA 2006 student questionnaire data file...363
Appendix 8 Codebook for PISA 2006 non-scored cognitive and embedded attitude items...407
Appendix 9 Codebook for PISA 2006 scored cognitive and embedded attitude items...427
Appendix 10 Codebook for PISA 2006 school questionnaire data file...439
Appendix 11 Codebook for PISA 2006 parents questionnaire data file...450
LIST OF BOXES
Box 2.1 WEIGHT statement inSPSS®...37
Box 7.1 SPSS® syntax for computing 81 means (e.g. PISA 2003)...104 Box 7.2 SPSS® syntax for computing the mean of HISEI and its standard error (e.g. PISA 2003)...107 Box 7.3 SPSS® syntax for computing the standard deviation of HISEI and its standard error by gender
(e.g. PISA 2003)...109 Box 7.4 SPSS® syntax for computing the percentages and their standard errors for gender (e.g. PISA 2003)...110 Box 7.5 SPSS® syntax for computing the percentages and its standard errors for grades by gender
(e.g.PISA 2003)...112 Box 7.6 SPSS® syntax for computing regression coefficients, R2 and its respective standard errors: Model 1
(e.g. PISA 2003)...113 Box 7.7 SPSS® syntax for computing regression coefficients, R2 and its respective standard errors: Model 2
(e.g. PISA 2003)...114 Box 7.8 SPSS® syntax for computing correlation coefficients and its standard errors (e.g. PISA 2003)...114
Box 8.1 SPSS® syntax for computing the mean on the science scale by using the MCR_SE_UNIV macro
(e.g. PISA 2006)...119 Box 8.2 SPSS® syntax for computing the mean and its standard error on PVs (e.g. PISA 2006)...120 Box 8.3 SPSS® syntax for computing the standard deviation and its standard error on PVs by gender
(e.g. PISA 2006)...131 Box 8.4 SPSS® syntax for computing regression coefficients and their standard errors on PVs
by using the MCR_SE_REG macro (e.g. PISA 2006)...122 Box 8.5 SPSS® syntax for running the simple linear regression macro with PVs (e.g.PISA 2006)...123 Box 8.6 SPSS® syntax for running the correlation macro with PVs (e.g. PISA 2006)...124 Box 8.7 SPSS® syntax for the computation of the correlation between mathematics/quantity and mathematics/
space and shape by using the MCR_SE_COR_2PV macro (e.g. PISA 2003)...126 Box 9.1 SPSS® syntax for generating the proficiency levels in science (e.g. PISA 2006)...135 Box 9.2 SPSS® syntax for computing the percentages of students by proficiency level in science and
its standard errors (e.g. PISA 2006)...136 Box 9.3 SPSS® syntax for computing the percentage of students by proficiency level in science and
its standard errors (e.g. PISA 2006)...138 Box 9.4 SPSS® syntax for computing the percentage of students by proficiency level and
its standard errors by gender (e.g. PISA 2006)...138 Box 9.5 SPSS® syntax for generating the proficiency levels in mathematics (e.g.PISA 2003)...139 Box 9.6 SPSS® syntax for computing the mean of self-efficacy in mathematics and its standard errors
by proficiency level (e.g. PISA 2003)...140 Box 10.1 SPSS® syntax for merging the student and school data files (e.g. PISA 2006)...146 Box 10.2 Question on school location in PISA 2006...147 Box 10.3 SPSS® syntax for computing the percentage of students and the average performance in science,
by school location (e.g. PISA 2006)...147 Box 11.1 SPSS® syntax for computing the mean of job expectations by gender (e.g. PISA 2003)...152 Box 11.2 SPSS® macro for computing standard errors on differences (e.g. PISA 2003)...155
Box 11.3 Alternative SPSS® macro for computing the standard error on a difference for a dichotomous variable
(e.g. PISA 2003)...156
Box 11.4 SPSS® syntax for computing standard errors on differences which involve PVs (e.g. PISA 2003)...158
Box 11.5 SPSS® syntax for computing standard errors on differences that involve PVs (e.g. PISA 2006)...160
Box 12.1 SPSS® syntax for computing the pooled OECD total for the mathematics performance by gender (e.g. PISA 2003)...166
Box 12.2 SPSS® syntax for the pooled OECD average for the mathematics performance by gender (e.g. PISA 2003)...167
Box 12.3 SPSS® syntax for the creation of a larger dataset that will allow the computation of the pooled OECD total and the pooled OECD average in one run (e.g.PISA 2003)...168
Box 14.1 SPSS® syntax for the quarter analysis (e.g. PISA 2006)...185
Box 14.2 SPSS® syntax for computing the relative risk with five antecedent variables and five outcome variables (e.g. PISA 2006)...189
Box 14.3 SPSS® syntax for computing the relative risk with one antecedent variable and one outcome variable (e.g. PISA 2006)...190
Box 14.4 SPSS® syntax for computing the relative risk with one antecedent variable and five outcome variables (e.g. PISA 2006)...190
Box 14.5 SPSS® syntax for computing effect size (e.g. PISA 2006)...192
Box 14.6 SPSS® syntax for residual analyses (e.g. PISA 2003)...196
Box 15.1 Normalisation of the final student weights (e.g. PISA 2006)...203
Box 15.2 SPSS® syntax for the decomposition of the variance in student performance in science (e.g. PISA 2006)...203
Box 15.3 SPSS® syntax for normalising PISA 2006 final student weights with deletion of cases with missing values and syntax for variance decomposition (e.g. PISA 2006)...206
Box 15.4 SPSS® syntax for a multilevel regression model with random intercepts and fixed slopes (e.g. PISA 2006)...208
Box 15.5 Results for the multilevel model in Box 15.4...208
Box 15.6 SPSS® syntax for a multilevel regression model (e.g. PISA 2006)...210
Box 15.7 Results for the multilevel model in Box 15.6...211
Box 15.8 Results for the multilevel model with covariance between random parameters...212
Box 15.9 Interpretation of the within-school regression coefficient...214
Box 15.10 SPSS® syntax for a multilevel regression model with a school-level variable (e.g. PISA 2006)...214
Box 15.11 SPSS® syntax for a multilevel regression model with interaction (e.g. PISA 2006)...215
Box 15.12 Results for the multilevel model in Box 15.11...216
Box 15.13 SPSS® syntax for using the multilevel regression macro (e.g. PISA 2006)...217
Box 15.14 SPSS® syntax for normalising the weights for a three-level model (e.g. PISA 2006)...219
Box 16.1 SPSS® syntax for testing the gender difference in standard deviations of reading performance (e.g.PISA 2000)...225
Box 16.2 SPSS® syntax for computing the 5th percentile of the reading performance by gender (e.g. PISA 2000)...227
Box 16.4 SPSS® syntax for running a preliminary multilevel analysis with one PV...231
Box 16.5 Estimates of fixed parameters in the multilevel model...231
Box 16.6 SPSS® syntax for running preliminaly analysis with the MCR_ML_PV macro...233
Box 17.1 SPSS® macro of MCR_SE_UNI.sps...243
Box 17.2 SPSS® macro of MCR_SE_PV.sps...247
Box 17.3 SPSS® macro of MCR_SE_PERCENTILES_PV.sps...251
Box 17.4 SPSS® macro of MCR_SE_GrpPct.sps...254
Box 17.5 SPSS® macro of MCR_SE_PctLev.sps...257
Box 17.6 SPSS® macro of MCR_SE_REG.sps...261
Box 17.7 SPSS® macro of MCR_SE_REG_PV.sps...265
Box 17.8 SPSS® macro of MCR_SE_COR.sps...270
Box 17.9 SPSS® macro of MCR_SE_COR_1PV.sps...273
Box 17.10 SPSS® macro of MCR_SE_COR_2PV.sps...277
Box 17.11 SPSS® macro of MCR_SE_DIFF.sps...281
Box 17.12 SPSS® macro of MCR_SE_DIFF_PV.sps...285
Box 17.13 SPSS® macro of MCR_SE_PV_WLEQRT.sps...290
Box 17.14 SPSS® macro of MCR_SE_RR.sps...295
Box 17.15 SPSS® macro of MCR_SE_RR_PV.sps...298
Box 17.16 SPSS® macro of MCR_SE_EFFECT.sps...302
Box 17.17 SPSS® macro of MCR_SE_EFFECT_PV.sps...306
Box 17.18 SPSS® macro of MCR_ML.sps...311
Box 17.19 SPSS® macro of MCR_ML_PV.sps...315
Box A1.1 Descriptive statistics of background and explanatory variables...326
Box A1.2 Background model for student performance...327
Box A1.3 Final net combined model for student performance...328
Box A1.4 Background model for the impact of socio-economic background...329
Box A1.5 Model of the impact of socio-economic background: “school resources” module...330
Box A1.6 Model of the impact of socio-economic background: “accountability practices” module...331
Box A1.7 Final combined model for the impact of socio-economic background...331
LIST OF FIGURES Figure 1.1 Relationship between social and academic segregations...27
Figure 1.2 Relationship between social segregation and the correlation between science performance and student HISEI...27
Figure 1.3 Conceptual grid of variable types...29
Figure 1.4 Two-dimensional matrix with examples of variables collected or available from other sources...30
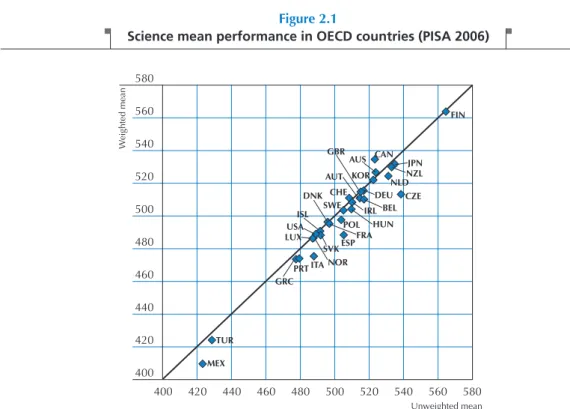
Figure 2.1 Science mean performance in OECD countries (PISA 2006)...37
Figure 2.2 Gender differences in reading in OECD countries (PISA 2000)...38
Figure 2.3 Regression coefficient of ESCS on mathematic performance in OECD countries (PISA 2003)...38
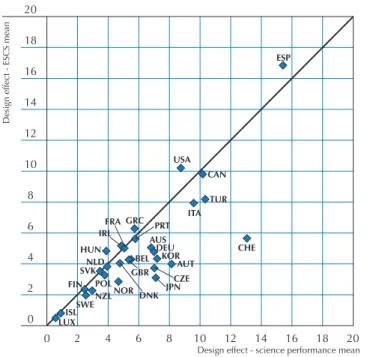
Figure 2.4 Design effect on the country mean estimates for science performance and for ESCS in OECD countries (PISA 2006)...41
Figure 2.5 Simple random sample and unbiased standard errors of ESCS on science performance in OECD countries (PISA 2006)...42
Figure 4.1 Distribution of the results of 36 students...58
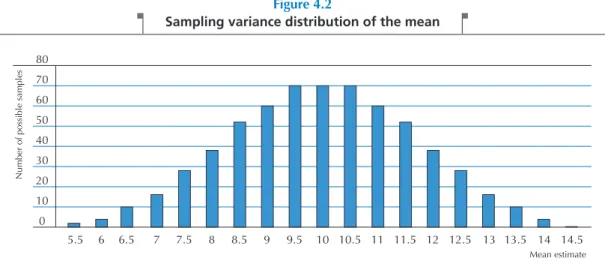
Figure 4.2 Sampling variance distribution of the mean...60
Figure 5.1 Probability of success for two high jumpers by height (dichotomous)...80
Figure 5.2 Probability of success for two high jumpers by height (continuous)...81
Figure 5.3 Probability of success to an item of difficulty zero as a function of student ability...81
Figure 5.4 Student score and item difficulty distributions on a Rasch continuum...84
Figure 5.5 Response pattern probabilities for the response pattern (1, 1, 0, 0)...86
Figure 5.6 Response pattern probabilities for a raw score of 1...87
Figure 5.7 Response pattern probabilities for a raw score of 2...88
Figure 5.8 Response pattern probabilities for a raw score of 3...88
Figure 5.9 Response pattern likelihood for an easy test and a difficult test...89
Figure 5.10 Rasch item anchoring...90
Figure 6.1 Living room length expressed in integers...94
Figure 6.2 Real length per reported length...95
Figure 6.3 A posterior distribution on a test of six items...96
Figure 6.4 EAP estimators...97
Figure 8.1 A two-dimensional distribution...125
Figure 8.2 Axes for two-dimensional normal distributions...125
Figure 13.1 Trend indicators in PISA 2000, PISA 2003 and PISA 2006...175
Figure 14.1 Percentage of schools by three school groups (PISA 2003)...194
Figure 15.1 Simple linear regression analysis versus multilevel regression analysis...201
Figure 15.2 Graphical representation of the between-school variance reduction...209
Figure 15.3 A random multilevel model...210
Figure 15.4 Change in the between-school residual variance for a fixed and a random model...212
Figure 16.1 Relationship between the segregation index of students’ expected occupational status and the segregation index of student performance in reading (PISA 2000)...236
Figure 16.2 Relationship between the segregation index of students’ expected occupational status and the correlation between HISEI and students’ expected occulational status...236
LIST OF TABLES Table 1.1 Participating countries/economies in PISA 2000, PISA 2003, PISA 2006 and PISA 2009...21
Table 1.2 Assessment domains covered by PISA 2000, PISA 2003 and PISA 2006...22
Table 1.3 Correlation between social inequities and segregations at schools for OECD countries...28
Table 1.4 Distribution of students per grade and per ISCED level in OECD countries (PISA 2006)...31
Table 2.1 Design effect and type I errors...40
Table 2.3 Standard deviation estimates and standard errors...44
Table 2.4 Correlation estimates and standard errors...45
Table 2.5 ESCS regression coefficient estimates and standard errors...45
Table 3.1 Height and weight of ten persons...50
Table 3.2 Weighted and unweighted standard deviation estimate...50
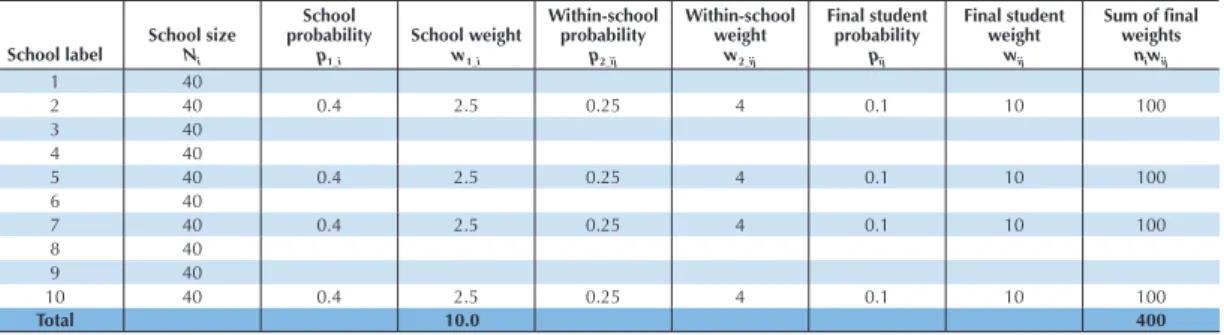
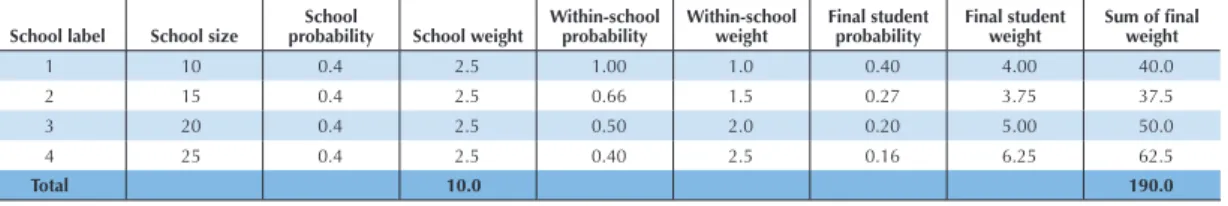
Table 3.3 School, within-school, and final probability of selection and corresponding weights for a two-stage, simple random sample with the first-stage units being schools of equal size...52
Table 3.4 School, within-school, and final probability of selection and corresponding weights for a two-stage, simple random sample with the first-stage units being schools of unequal size...52
Table 3.5 School, within-school, and final probability of selection and corresponding weights for a simple and random sample of schools of unequal size (smaller schools)...53
Table 3.6 School, within-school, and final probability of selection and corresponding weights for a simple and random sample of schools of unequal size (larger schools)...53
Table 3.7 School, within-school, and final probability of selection and corresponding weights for PPS sample of schools of unequal size...54
Table 3.8 Selection of schools according to a PPS and systematic procedure...55
Table 4.1 Description of the 630 possible samples of 2 students selected from 36 students, according to their mean...59
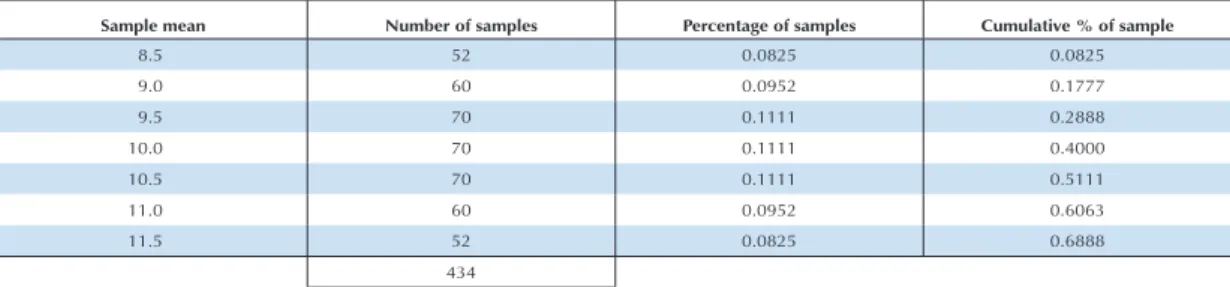
Table 4.2 Distribution of all possible samples with a mean between 8.32 and 11.68...61
Table 4.3 Distribution of the mean of all possible samples of 4 students out of a population of 36 students...62
Table 4.4 Between-school and within-school variances on the mathematics scale in PISA 2003...65
Table 4.5 Current status of sampling errors...65
Table 4.6 Between-school and within-school variances, number of participating schools and students in Denmark and Germany in PISA 2003...66
Table 4.7 The Jackknifes replicates and sample means...68
Table 4.8 Values on variables X and Y for a sample of ten students...69
Table 4.9 Regression coefficients for each replicate sample...69
Table 4.10 The Jackknife replicates for unstratified two-stage sample designs...70
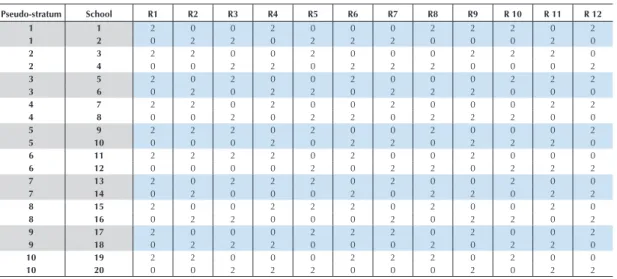
Table 4.11 The Jackknife replicates for stratified two-stage sample designs...71
Table 4.12 Replicates with the Balanced Repeated Replication method...72
Table 4.13 The Fay replicates...73
Table 5.1 Probability of success when student ability equals item difficulty...82
Table 5.2 Probability of success when student ability is less than the item difficulty by 1 unit...82
Table 5.3 Probability of success when student ability is greater than the item difficulty by 1 unit...82
Table 5.4 Probability of success when student ability is less than the item difficulty by 2 units...83
Table 5.5 Probability of success when student ability is greater than the item difficulty by 2 units...83
Table 5.6 Possible response pattern for a test of four items...85
Table 5.7 Probability for the response pattern (1, 1, 0, 0) for three student abilities...85
Table 5.8 Probability for the response pattern (1, 0) for two students of different ability in an incomplete test design...89
Table 6.1 Structure of the simulated data...98
Table 6.2 Means and variances for the latent variables and the different student ability estimators...98
Table 6.3 Percentiles for the latent variables and the different student ability estimators...99
Table 6.4 Correlation between HISEI, gender and the latent variable, the different student ability estimators...99
Table 6.5 Between- and within-school variances...100
Table 7.1 HISEI mean estimates...105
Table 7.2 Squared differences between replicate estimates and the final estimate...106
Table 7.3 Output data file from Box 7.2...108
Table 7.4 Available statistics with the UNIVAR macro...109
Table 7.5 Output data file from Box 7.3...109
Table 7.6 Output data file from Box 7.4...110
Table 7.7 Percentage of girls for the final and replicate weights and squared differences...111
Table 7.8 Output data file from Box 7.5...112
Table 7.9 Output data file from Box 7.6...113
Table 7.10 Output data file from Box 7.7...114
Table 7.11 Output data file from Box 7.8...114
Table 8.1 The 405 mean estimates...118
Table 8.2 Mean estimates and their respective sampling variances on the science scale for Belgium (PISA 2006)...119
Table 8.3 Output data file from Box 8.2...121
Table 8.4 Output data file from Box 8.3...121
Table 8.5 The 450 regression coefficient estimates...123
Table 8.6 HISEI regression coefficient estimates and their respective sampling variance on the science scale in Belgium after accounting for gender (PISA 2006)...123
Table 8.7 Output data file from Box 8.5...123
Table 8.8 Output data file from Box 8.6...124
Table 8.9 Correlation between the five plausible values for each domain, mathematics/quantity and mathematics/space and shape...126
Table 8.10 The five correlation estimates between mathematics/quantity and mathematics/space and shape and their respective sampling variance...127
Table 8.11 Standard deviations for mathematics scale using the correct method (plausible values) and by averaging the plausible values at the student level (pseudo-EAP) (PISA 2003)...128
Table 8.12 Unbiased shortcut for a population estimate and its standard error...129
Table 8.13 Standard errors from the full and shortcut computation (PISA 2006)...130
Table 9.1 The 405 percentage estimates for a particular proficiency level...136
Table 9.2 Estimates and sampling variances per proficiency level in science for Germany (PISA 2006)...137
Table 9.3 Final estimates of the percentage of students, per proficiency level, in science and its standard errors for Germany (PISA 2006)...137
Table 9.4 Output data file from Box 9.3...138
Table 9.5 Output data file from Box 9.4...138
Table 9.6 Mean estimates and standard errors for self-efficacy in mathematics per proficiency level (PISA 2003)...141
Table 10.1 Percentage of students per grade and ISCED level, by country (PISA 2006)...144
Table 10.2 Output data file from the first model in Box 10.3...148
Table 10.3 Output data file from the second model in Box 10.3...148
Table 11.1 Output data file from Box 11.1...153
Table 11.2 Mean estimates for the final and 80 replicate weights by gender (PISA 2003)...153
Table 11.3 Difference in estimates for the final weight and 80 replicate weights between females and males (PISA 2003)...155
Table 11.4 Output data file from Box 11.2...156
Table 11.5 Output data file from Box 11.3...157
Table 11.6 Gender difference estimates and their respective sampling variances on the mathematics scale (PISA 2003)...157
Table 11.7 Output data file from Box 11.4...158
Table 11.8 Gender differences on the mathematics scale, unbiased standard errors and biased standard errors (PISA 2003)...159
Table 11.9 Gender differences in mean science performance and in standard deviation for science performance (PISA 2006)...159
Table 11.10 Regression coefficient of HISEI on the science performance for different models (PISA 2006)...160
Table 11.11 Cross tabulation of the different probabilities...161
Table 12.1 Regression coefficients of the index of instrumental motivation in mathematics on mathematic performance in OECD countries (PISA 2003)...165
Table 12.2 Output data file from Box 12.1...166
Table 12.3 Output data file from Box 12.2...167
Table 12.4 Difference between the country mean scores in mathematics and the OECD total and average (PISA 2003)...170
Table 13.1 Trend indicators between PISA 2000 and PISA 2003 for HISEI, by country...176
Table 13.2 Linking error estimates...178
Table 13.3 Mean performance in reading by gender in Germany...180
Table 14.1 Distribution of the questionnaire index of cultural possession at home in Luxembourg (PISA 2006)...184
Table 14.2 Output data file from Box 14.1...186
Table 14.3 Labels used in a two-way table...186
Table 14.4 Distribution of 100 students by parents’ marital status and grade repetition...187
Table 14.5 Probabilities by parents’ marital status and grade repetition...187
Table 14.6 Relative risk for different cutpoints...187
Table 14.7 Output data file from Box 14.2...189
Table 14.8 Mean and standard deviation for the student performance in reading by gender, gender difference and effect size (PISA 2006)...191
Table 14.9 Output data file from the first model in Box 14.5...197
Table 14.10 Output data file from the second model in Box 14.5...197
Table 14.11 Mean of the residuals in mathematics performance for the bottom and top quarters of the PISA index of economic, social and cultural status, by school group (PISA 2003)...195
Table 15.1 Between- and within-school variance estimates and intraclass correlation (PISA 2006)...204
Table 15.2 Fixed parameter estimates...211
Table 15.3 Variance/covariance estimates before and after centering...213
Table 15.4 Output data file of the fixed parameters file...215
Table 15.5 Average performance and percentage of students by student immigrant status and by type of school...216
Table 15.6 Variables for the four groups of students ...216
Table 15.7 Comparison of the regression coefficient estimates and their standard errors in Belgium (PISA 2006)...218
Table 15.8 Comparison of the variance estimates and their respective standard errors in Belgium (PISA 2006)...218
Table 15.9 Three-level regression analyses...220
Table 16.1 Differences between males and females in the standard deviation of student performance (PISA 2000)...226
Table 16.2 Distribution of the gender differences (males – females) in the standard deviation of the student performance...226
Table 16.3 Gender difference on the PISA combined reading scale for the 5th, 10th, 90th and 95th percentiles (PISA 2000)...227
Table 16.4 Gender difference in the standard deviation for the two different item format scales in reading (PISA 2000)...228
Table 16.5 Random and fixed parameters in the multilevel model with student and school socio-economic background...229
Table 16.6 Random and fixed parameters in the multilevel model with socio-economic background and grade retention at the student and school levels...233
Table 16.7 Segregation indices and correlation coefficients by country (PISA 2000)...234
Table 16.8 Segregation indices and correlation coefficients by country (PISA 2006)...235
Table 16.9 Country correlations (PISA 2000)...237
Table 16.10 Country correlations (PISA 2006)...237
Table 17.1 Synthesis of the 19 SPSS® macros...241
Table A2.1 Cluster rotation design used to form test booklets for PISA 2006...332
Table A12.1 Mapping of ISCED to accumulated years of education...457
Table A12.2 ISCO major group white-collar/blue-collar classification...459
Table A12.3 ISCO occupation categories classified as science-related occupations...459
Table A12.4 Household possessions and home background indices...463
Table A12.5 Factor loadings and internal consistency of ESCS 2006 in OECD countries...473
Preparation of data files
All data files (in text format) and the SPSS® control files are available on the PISA website
(www.pisa.oecd.org).
SPSS
®users
By running the SPSS® control files, the PISA data files are created in the SPSS® format. Before starting
analysis in the following chapters, save the PISA 2000 data files in the folder of “c:\pisa2000\data\”, the PISA 2003 data files in “c:\pisa2003\data\”, and the PISA 2006 data files in “c:\pisa2006\data\”.
SPSS
®syntax and macros
All syntaxes and macros in this manual can be copied from the PISA website (www.pisa.oecd.org). These macros were developed for SPSS 17.0. The 19 SPSS® macros presented in Chapter 17 need
to be saved under “c:\pisa\macro\”, before staring analysis. Each chapter of the manual contains a complete set of syntaxes, which must be done sequentially, for all of them to run correctly, within the chapter.
Rounding of figures
In the tables and formulas, figures were rounded to a convenient number of decimal places, although calculations were always made with the full number of decimal places.
Country abbreviations used in this manual
AUS Australia FRA France MEX Mexico
AUT Austria GBR United Kingdom NLD Netherlands
BEL Belgium GRC Greece NOR Norway
CAN Canada HUN Hungary NZL New Zealand
CHE Switzerland IRL Ireland POL Poland
CZE Czech Republic ISL Iceland PRT Portugal
DEU Germany ITA Italy SVK Slovak Republic
DNK Denmark JPN Japan SWE Sweden
ESP Spain KOR Korea TUR Turkey
of PISA Data for
Policy Makers, Researchers
and Experts on Methodology
PISA – an overview...20
•The PISA surveys...20
How can PISA contribute to educational policy, practice and research?...22
•Key results from PISA 2000, PISA 2003 and PISA 2006...23
Further analyses of PISA datasets...25
•Contextual framework of PISA 2006...28
PISA – AN OVERVIEW
Are students well prepared to meet the challenges of the future? Are they able to analyse, reason and communicate their ideas effectively? Have they found the kinds of interests they can pursue throughout their lives as productive members of the economy and society? The OECD Programme for International Student Assessment (PISA) seeks to provide some answers to these questions through its surveys of key competencies of 15-year-old students. PISA surveys are administered every three years in OECD member countries and a group of partner countries, which together make up close to 90% of the world economy.1
PISA assesses the extent to which students near the end of compulsory education have acquired some of the knowledge and skills that are essential for full participation in society. It focuses on student competencies in the key subject areas of reading, mathematics and science. PISA seeks to assess not merely whether students can reproduce what they have learned, but also to examine how well they can extrapolate from what they have learned and apply their knowledge in novel settings, both in school and non-school contexts.
The PISA surveys
PISA focuses on young people’s ability to use their knowledge and skills to meet real-life challenges. This orientation reflects a change in the goals and objectives of curricula themselves, which are increasingly concerned with what students can do with what they learn and not merely with whether they have mastered specific curricular content.
Key features driving the development of PISA have been its:
• policy orientation, which connects data on student-learning outcomes with data on students’ characteristics and on key factors shaping their learning in and out of school in order to draw attention to differences in performance patterns, and to identify the characteristics of schools and education systems that have high performance standards;
• innovative “literacy” concept, which is concerned with the capacity of students to apply knowledge and skills in key subject areas and to analyse, reason and communicate effectively as they pose, solve and interpret problems in a variety of situations;
• relevance to lifelong learning, which does not limit PISA to assessing students’ curricular and cross-curricular competencies, but also asks them to report on their own motivation to learn, their beliefs about themselves, and their learning strategies;
• regularity, which enables countries to monitor their progress in meeting key learning objectives;
• breadth of geographical coverage and collaborative nature, which in PISA 2006 encompasses the
30 OECD member countries and 27 partner countries and economies.
The relevance of the knowledge and skills measured by PISA is confirmed by recent studies tracking young people in the years after they have been assessed by PISA. Studies in Australia, Canada and Denmark display a strong relationship between the performance in reading on the PISA 2000 assessment at age 15 and the chance of a student completing secondary school and of carrying on with post-secondary studies at age 19. For example, Canadian students who had achieved reading proficiency Level 5 at age 15 were 16 times more likely to be enrolled in post-secondary studies when they were 19-years-old than those who had not reached the reading proficiency Level 1 (Knighton and Bussiere, 2006).2
PISA is the most comprehensive and rigorous international programme to assess student performance and to collect data on the student, family and institutional factors that can help to explain differences in performance. Decisions about the scope and nature of the assessments and the background information to be collected
are made by leading experts in participating countries, and are steered jointly by governments on the basis of shared, policy-driven interests. Substantial efforts and resources are devoted to achieving cultural and linguistic breadth and balance in the assessment materials. Stringent quality assurance mechanisms are applied in translation, sampling and data collection. Consequently, the results of PISA have a high degree of validity and reliability, and can significantly improve understanding of the outcomes of education in the world’s most economically developed countries, as well as in a growing number of countries at earlier stages of economic development.
Although PISA was originally created by the governments of OECD countries, it has now become a major assessment tool in regions around the world. The first PISA survey was conducted in 2000 in 28 OECD countries and 4 partner countries, using written tasks answered in schools under independently supervised test conditions following consistently applied standards. Another 11 partner countries participated in the same survey in late 2001 or early 2002. The second survey was conducted in 2003 in 30 OECD countries and 11 partner countries/economies and in 2006 the third survey included 30 OECD countries and 27 partner countries/economies. In 2009, PISA will be carried out in 30 OECD countries and 37 partner countries/economies. Table 1.1 provides the list of participating countries/economies where PISA 2000, PISA 2003 and PISA 2006 have been conducted and PISA 2009 is planned.
Table 1.1
Participating countries/economies in PISA 2000, PISA 2003, PISA 2006 and PISA 2009
OECD countries Partner countries
PISA 2000 Australia; Austria; Belgium; Canada; Czech Republic; Denmark; Finland; France; Germany; Greece; Hungary; Iceland; Ireland; Italy; Japan; Korea; Luxembourg; Mexico; Netherlands;aNew Zealand;
Norway; Poland; Portugal; Spain; Sweden; Switzerland; United Kingdom; United States
Albania; Argentina; Brazil; Bulgaria; Chile; Hong Kong-China; Indonesia; Israel; Latvia; Liechtenstein; Macedonia; Peru; Romania; Russian Federation; Thailand
PISA 2003 Australia; Austria; Belgium; Canada; Czech Republic; Denmark; Finland; France; Germany; Greece; Hungary; Iceland; Ireland; Italy; Japan; Korea; Luxembourg; Mexico; Netherlands; New Zealand; Norway; Poland; Portugal; Slovak Republic; Spain; Sweden; Switzerland; Turkey; United Kingdom;bUnited States
Brazil; Hong Kong-China; Indonesia; Liechtenstein; Latvia; Macao-China; Russian Federation; Thailand; Tunisia; Uruguay; Serbiac
PISA 2006 Australia; Austria; Belgium; Canada; Czech Republic; Denmark; Finland; France; Germany; Greece; Hungary; Iceland; Ireland; Italy; Japan; Korea; Luxembourg; Mexico; Netherlands; New Zealand; Norway; Poland; Portugal; Slovak Republic; Spain; Sweden; Switzerland; Turkey; United Kingdom; United Statesd
Argentina; Azerbaijan; Brazil; Bulgaria; Chile; Colombia; Croatia; Estonia; Hong Kong-China; Indonesia; Israel; Jordan; Kyrgyzstan; Latvia; Lithuania; Macao-China; Republic of Montenegro; Qatar; Romania; Russian Federation; Republic of Serbia; Slovenia; Chinese Taipei; Thailand; Tunisia; Uruguay
PISA 2009 Australia; Austria; Belgium; Canada; Czech Republic; Denmark; Finland; France; Germany; Greece; Hungary; Iceland; Ireland; Italy; Japan; Korea; Luxembourg; Mexico; Netherlands; New Zealand; Norway; Poland; Portugal; Slovak Republic; Spain; Sweden; Switzerland; Turkey; United Kingdom; United States
Albania; Argentina; Azerbaijan; Brazil; Bulgaria; Chile; Colombia; Croatia; Dominican Republic; Dubai (UAE); Estonia; Hong Kong-China; Indonesia; Israel; Jordan; Kazakhstan; Kyrgyzstan; Latvia; Liechtenstein; Lithuania; Macao-China; Republic of Moldova; Republic of Montenegro; Panama; Peru; Qatar; Romania; Russian Federation; Republic of Serbia; Shanghai-China; Singapore; Slovenia; Chinese Taipei; Thailand; Trinidad and Tobago; Tunisia; Uruguay
a. Response rate is too low to ensure comparability. See Annex 3 in OECD (2003),Literacy Skills for the World of Tomorrow – Further Results from PISA 2000,
OECD, Paris.
b. Response rate is too low to ensure comparability. See Annex 3 in OECD (2004),Learning for Tomorrow’s World – First Results from PISA 2003,OECD, Paris. c. For the country Serbia and Montenegro, data for Montenegro are not available in PISA 2003. The latter accounts for 7.9% of the national population. The name “Serbia” is used as a shorthand for the Serbian part of Serbia and Montenegro.
d. Reading results are not available in PISA 2006. See Chapter 6 in OECD (2007),PISA 2006 – Science Competencies for Tomorrow’s World,OECD, Paris.
Together with the PISA 2000 and PISA 2003 surveys, PISA 2006 completes the first cycle of assessment in the three major subject areas – reading, mathematics and science. PISA is now conducting a second cycle of surveys, beginning in 2009 with reading as the major subject and continuing in 2012 (mathematics) and 2015 (science).
PISA defines the assessment major domains as follows:
• Reading literacy: An individual’s capacity to understand, use and reflect on written texts, in order to achieve one’s goals, to develop one’s knowledge, and potential and to participate in society.
• Mathematical literacy: An individual’s capacity to identify and understand the role that mathematics plays in the world, to make well-founded judgements and to use and engage with mathematics in ways that meet the needs of that individual’s life as a constructive, concerned and reflective citizen.
• Scientific literacy: An individual’s scientific knowledge and use of that knowledge to identify questions, to acquire new knowledge, to explain scientific phenomena, and to draw evidence-based conclusions about science-related issues, understanding of the characteristic features of science as a form of human knowledge and enquiry, awareness of how science and technology shape our material, intellectual, and cultural environments, and willingness to engage in science-related issues, and with the ideas of science, as a reflective citizen.
Across the world, policy makers are using PISA findings to: gauge the knowledge and skills of students in their own country in comparison with those of other participating countries; establish benchmarks for educational improvement, for example, in terms of the mean scores achieved by other countries or their capacity to provide high levels of equity in educational outcomes and opportunities; and understand relative strengths and weaknesses of their education systems. The interest in PISA is illustrated by the many reports produced in participating countries,3 the numerous references to PISA results in public debates and the
intense media attention shown to PISA throughout the world.
HOW CAN PISA CONTRIBUTE TO EDUCATIONAL POLICY, PRACTICE AND
RESEARCH?
PISA does not necessarily answer all questions asked by policy makers, educators or educational researchers. In particular, the following aspects need to be considered, both in terms of restrictions and of potentialities related to the study design:
• PISA is measuring “knowledge and skills” for life and does not have a strong “curricular” focus. This limits the extent to which the study will be able to explore relationships between differences in achievement and differences in the intended or implemented curricula. On the other hand, special consideration is given to the out-of-school factors with a potential of enhancing cognitive and affective learning outcomes. • PISA students are randomly sampled within schools, not from intact classrooms or courses and therefore
come from different learning environments with different teachers and, possibly, different levels of instruction. Consequently, classroom-level variables, including teacher-level variables, can only be collected either at the individual student level or at the school level. PISA does not therefore automatically provide specific recommendations on how teachers should teach.
Major domain Minor domains
PISA 2000 Reading literacy Mathematical literacyScientific literacy
PISA 2003 Mathematical literacy Reading literacy
Scientific literacy Problem solving
PISA 2006 Scientific literacy Mathematical literacy
Reading literacy Table 1.2
• PISA uses an age-based definition of the target population. This is particularly appropriate for a yield-oriented study, and provides a basis for in-depth exploration of important policy issues, such as the effects of a number of structural characteristics of educational systems (e.g.the use of “comprehensive” versus “tracked” study programmes, or the use of grade repetition). On the other hand, the inclusion in the study of an increasing number of non-OECD countries (where the enrolment rate for the 15-year-old age group is maybe less than 100%) requires that a proportion of 15-year-olds still in school be taken into account in the analysis of between-countries differences.
Further, educational issues or challenges highly depend on economical and societal contexts; therefore, what is relevant for one country might be totally irrelevant for another country. As contextual questionnaires have a limited length, testing constraints require making choices in the data that will be collected. Finally, PISA data do not prove causal relationships. Implementing a pedagogical practice or structure in a country based on the observed outcomes in other countries where these practices or structures exist does not guarantee the success of a given reform. Educational systems largely differ and even if some characteristics seem to be associated with higher performance, PISA does not look at the details of policies and practices within schools at a micro level, and therefore cannot describe how these educational features interact. However, as PISA is designed to provide schools, local communities and countries with an opportunity to identify their own strengths and weaknesses, a large set of pointers can be identified and communicated to policy makers. Through the additional collection of information on students and their educational environments, PISA allows the identification of social, cultural, economic and educational factors that are associated with student performance. Using the data from questionnaires, analyses linking contextual information with student outcomes allows PISA to address differences:
• between countries in the relationships between student level factors (such as gender and socio-economic background) and outcomes;
• across countries in the relationships between school level factors and outcomes;
• in the proportion of variation in outcomes between (rather than within) schools, and differences in this value across countries;
• between countries in the extent to which schools moderate or increase the effects of individual-level student factors and student outcomes;
• in educational systems and national contexts that are related to differences in student outcomes across countries;
• in any or all of these relationships over time.
The OECD has largely been analysing the results of the first three cycles of PISA and their implications for policy makers. The most important key findings are summarised in the next section.
Key results from PISA 2000, PISA 2003 and PISA 2006
Differences between countriesAt the education system level, PISA has and will continue to inform countries on their average performance and more importantly, how this performance evolves over time. The PISA initial reports (OECD, 2001, 2004, 2007) show that among OECD countries, only 10% to 15% of the variation in student performance lies between countries. These results may suggest that the major issue is located within countries. However, country differences in performance should not be underestimated. The expected growth in student performance for one year of schooling is usually estimated at about 0.30 standard deviation. For instance, the difference between
the averages of lower grade and upper grade in the Third International Mathematic and Science Study is equal to 0.29 standard deviation (Beatonet al., 1996). In this context, more than two years of schooling separate the top performing OECD countries and the bottom performing OECD countries. Obviously, this difference is large enough for investigating factors that may be associated with higher performance at the country level. A few major features can be identified from the first three data collections of PISA:
•High performing countries in one domain tend to perform well in other domains. The correlations between domains at the country level are all above 0.90. Top performing countries in one domain are also among top performing countries in the other domains and the reverse. This result may reflect high or low demanding curricula across domains but may also reflect the effect of economical background, such as gross domestic product (GDP) or the influence of educational structures.
•Differences in pattern of results according to how students are admitted to schools, grouped across schools and grouped within schools. In schools systems where students are divided into different school groups at relatively early ages, the socio-economic differences in performance by age 15 are relatively large through school composition effects, while the average level of performance is not higher compared to comprehensive education systems. This is likely one of the most important clear-cut finding of PISA: differentiation at an early age damages equity without any discernible benefit for quality. Equity and quality are not incompatible aims. This result is even reinforced by the longitudinal profile of Poland. In 1999, Poland implemented a massive reform of the schooling system, which now provides a more integrated educational system. Between 2000 and 2003, Poland succeeded in raising the average performance of 15-year-olds for the three domains assessed by PISA. A more detailed analysis also showed that this improvement is mainly attributable to an increase at the lower end of the distribution.
•Higher performance in schools that keep track of student performance at a public level. Performance standards can only be maintained if they are consistently implemented and assessed. Different countries use various forms of external assessment, external evaluation or inspection, and schools’ own quality assurance and self-evaluation efforts. While there is no single model that best supports school improvement, higher performing countries in PISA have been putting increased emphasis on the monitoring of their schooling systems.
•Higher performance in countries giving more autonomy to schools to formulate the school budget and to decide on budget allocations within the school even after accounting for other school and system level factors as well as demographic and socio-economic factors. Similarly, students in educational systems that give more autonomy to schools in educational matters such as textbooks and courses offered, tend to perform better, but this effect is not significant after accounting for some other school and system level factors.
Differences between schools within countries
PISA 2000, PISA 2003 and PISA 2006 showed that the percentage of variation in student performance between schools varies greatly from one country to another. On average, at the OECD level, about 30% of this variation lies between schools. However, northern European countries consistently present across cycle percentages below 20% while in some countries like Belgium, Germany and Austria, more than 50% of variation in student performance lies between schools. A few factors that correlate with school performance have been isolated:
• The school social intake is the strongest single factor associated with school performance. It is not just the characteristics of an individual’s family but also the characteristics of the families of other students in the school that are closely associated with how well students in the school performed in PISA. On average, students who attend schools with a more advantaged “social profile” are likely to show considerable
higher levels of performance than those attending less advantaged schools. This effect, usually denoted as the “school composition effect” in literature, tends to be higher in countries that differentiate students into various groups or tracks at an early age.
• Higher performance is found in privately funded schools and in schools that compete for students, but there is no statistically significant effect in either case once the combined effect of individual student socio-economic background and the average socio-economic background of all students in the school are taken into account. The performance of private schools does not tend to be higher once demographic and socio-economic factors have been taken into account.
• A modest relationship exists between certain aspects of school resources and student outcomes. However, much of this relationship disappears when the socio-economic status of the students is accounted for, thus suggesting that there is dependence between school resources and student socio-economic characteristics, i.e.students from high socio-economic backgrounds are attending schools with better educational resources.
• Ability grouping for all subjects within schools appears to have a small negative effect. Schools which tend to avoid grouping students by ability tend to perform better.
• The atmosphere created by students and teachers has measurable positive effects. The PISA results underline the particular importance of school climate as a factor affecting school performance. Its effect is more discernible than the level of school resources. However, school climate also correlates with student background characteristics, showing that the schools with better learning climates are generally attended by students from high socio-economic backgrounds.
Differences between students
Among the numerous relationships identified by PISA at the student level, the findings which are most relevant to policies are:
• Overall, socio-economic difference is the strongest single factor associated with performance in PISA, accounting for about a fifth of all variation in student scores.
• The level of students’ engagement at school and in a particular domain is related to educational outcomes. For instance, those who are habitual readers and who enjoy reading are more likely than others to have high levels of reading literacy. Greater engagement in reading can be a consequence, as well as a cause. A student’s overall engagement at school is also a key factor in secondary education. PISA also showed that schools where students perform poorly overall have a tendency to be those where students become disengaged.
• There are strong relationships between students’ attitudes, learning strategies and performance. The evidence from PISA suggests that students who are more self-confident and highly motivated do better at school largely because they are more inclined to invest in learning strategies that work. These findings suggest that strategies to improve teaching and learning techniques need to do more than just offer students a learning toolkit. Students will only use learning tools if they feel motivated and believe in their capacity to learn.
FURTHER ANALYSES OF PISA DATASETS
As shown by these key findings, PISA offers an inexhaustible source of information for analysing educational issues, and testing hypotheses or educational models that can be translated into policy implications. Even if the initial three PISA and subsequent thematic reports made an extensive use of the PISA data, there are many other possible analyses that may have policy implications.