Sharif University of Technology
Scientia IranicaTransactions E: Industrial Engineering www.scientiairanica.com
Solving a multi-objective resource-constrained project
scheduling problem using a cuckoo optimization
algorithm
A. Ghamginzadeh
a, A.A. Naja
band P. Azimi
a;a. Faculty of Industrial and Mechanical Engineering, Qazvin Branch, Islamic Azad University, Qazvin, Iran. b. Faculty of Industrial Engineering, K.N. Toosi University of Technology, Tehran, P.O. Box 1999143344, Iran. Received 29 May 2013; received in revised form 26 October 2013; accepted 10 March 2014
KEYWORDS Project scheduling; Net present value; Cuckoo optimization algorithm.
Abstract. Scheduling is an important factor in project success. In the real world atmosphere, project scheduling problems involve multiple objectives which must be optimized simultaneously. According to the literature, several meta-heuristic algorithms have been used in single objective resource-constrained project scheduling problems, but very few of them have used a multi-objective framework. In this study, we focus on a multi-objective resource-constrained project scheduling problem by minimizing project completion time and the time value of project costs, which is the main contribution of the current research. The goal is to provide an algorithm that can nd optimum Pareto front solutions, using a multi-objective cuckoo optimization algorithm. In order to increase the eciency of the algorithm, the algorithm parameters are tuned using Taguchi tests. Finally, the solutions derived from the algorithm have been compared to those obtained from NSGA-II. The experiments show the eciency of the proposed algorithm.
© 2014 Sharif University of Technology. All rights reserved.
1. Introduction
Scheduling is one of the keys to successful projects. The correct use of available resources reduces costs and satises the project implementation in minimum time. A Resource-Constrained Project Scheduling Problem (RCPSP) is discussed in the area of project scheduling. RCPSP consists of a project with a set of activities and a set of resources. Implementing each activity requires a certain number of resources and amount of time. In traditional RCPCP, each activity has a single execution. The Multi-mode Resource-Constrained Project Scheduling Problem (MRCPSP) is a more general version of RCPSP in which each activity can be implemented in several modes. Each
*. Corresponding author. Tel.: +98 21 88552640; Fax: +98 21 88705839
E-mail address: [email protected] (P. Azimi)
mode needs its own duration and resource consump-tion in order to be implemented. In MRCPSP, the objective is to decide when an activity begins and how it is performed, so that the goal of the project is optimized. Blazewicz et al. [1] proved that RCPSP is strongly NP-hard. Kolisch and Drexl [2] proved that if MRCPSP had more than one non-renewable constraint, nding even one feasible solution would be NP-complete.
In real-world projects, project managers are con-cerned with several objectives. Although many re-searchers have considered project scheduling prob-lems, very few have studied this problem using multi-objective models. Dierent ways have been used to deal with multi-objective problems, but the majority converts them into a single objective function. A common aggregation function is the linear weighted summation method. However, nding the weights is dicult and the linear transformation could be
non-realistic. Therefore, the Pareto solutions approach can be an appropriate alternative to overcome these issues. Slowinski [3] was the rst author to study the multi-objective RCPSP. He presented a linear pro-gramming model for the multi-objective, multi-mode RCPSP with consideration of resource constraints. He discussed the usability of goal programming and fuzzy linear programming to solve this problem. Objective functions used in this research include project comple-tion time, net present value, total resource consump-tion, total number of delayed activities and weight of consumed resources. Al-fawzan and Haourai [4] con-sidered MRCPSP with limited resources and proposed a two-objective Tabu search algorithm to minimize the makespan and maximize the robustness. Viana and de Sousa [5] proposed a multi-objective annealing simulation and Tabu search algorithm to minimize the makespan, the weight lateness of activities and the violation of resource constraints. Abbasi et al. [6] studied RCPSP with renewable resource constraints with two objective functions, including makespan and robustness. They proposed a simulated annealing al-gorithm, along with the weighted summation method, to deal with the two-objective problem. Abdelaziz et al. [7] considered MRCPSP with renewable limitations and suggested a multi-objective ant colony algorithm to nd non-dominant solutions. The objectives con-sidered in this article include makespan, project costs and the probability of project success. Ballestin and Blanco [8] presented an algorithm based on the concept of non-dominant solutions. They also proposed special rules to help solve the problem. Nabipoor-Afruzi et al. [9] considered a multi-mode, resource-constrained, discrete, time-cost tradeo problem and solved it using an adjusted fuzzy dominance genetic algorithm. Aboutalebi et al. [10] proposed NSGA-II and MOPSO algorithms to solve this problem and, according to some dened indices, showed that NSGA-II is more ecient than MOPSO. Kazemi and Tavakoli-Moghadam [11] studied the multi-objective RCPSP considering maximization of the net present value and minimization of the makespan in terms of the renewable resource constraint. In real world applications, usually, there are non-renewable resource constraints to execute activities. For example, in construction projects, non-renewable resources are very important in project scheduling, such as cement, plas-ter, ironware, etc. Hence, adding this constraint results in a more realistic model. On the other hand, because this problem is a multi-mode problem, and, in each mode, a certain level of non-renewable resources is needed to perform each activity, dening non-renewable resources in the problem model seems to be essential. Thus, to get closer to reality, we consider a multi-objective RCPSP problem, considering non-renewable resource constraints, to maximize the net
present value of the project. In addition to the above mentioned explanations, a new multi-objective meta-heuristic algorithm is developed based on the cuckoo Optimization Algorithm (COA) [12] to nd optimal front Pareto solutions, which are two main contributions of this research. The paper is organized as follows.
In Section 2, the mathematical model of the prob-lem is presented. In the next section, the framework of the multi-objective cuckoo optimization algorithm, including parameter denitions, is proposed. In Section 4, experiment results and discussions are provided. Finally, conclusions and recommendations for future research are mentioned in Section 5.
2. The problem model
A project consists of activities which are shown by a network, G = (N; E), where N represents the nodes (activities), and E represents the edges (priority between activities). Activity i cannot start up unless the preceding activities are nished. Each activity, i, can be completed in one of Mi feasible modes. There
is no interruption in the activity. Each mode selected to be implemented for activity i cannot be changed. Node 1 represents the start event of the project and node n shows its last event. The completion time of activity i in mode m(m = 1; ; Mi) is equal to dim.
A negative cash ow (activity cost) is allocated to each activity, i. We assume that there are R renewable
resources. The number of renewable resources available for resource k(k = 1; ; R) is equal to R
k units.
Each activity, i, requires rimkunits of the kth resource
to be implemented in mode m(m = 1; ; Mi). There
are R non-renewable resources. The non-renewable
resources available for resource k(k = 1; ; R) are
equal to Rk units. Each activity, i, requires imk units
of the kth resource to be implemented in mode m(m = 1; ; Mi). Using NPV, we can consider the time value
of money in the problem. The value of the spent money (received money) is a function of spending (receiving). To calculate the NPV, the reduction rate is selected as , which refers to the project capital return of rate. The objective of MRCPSP is to allocate the modes of implementation to the activities and determine their starting time, considering the priority of activities and existing resources, to obtain a set of optimal Pareto fronts. The cost of each activity is determined at its ending event. The available parameters in a multi-objective MRCPSP are dened as follows:
n : The number of project activities; Cim: Cash ow allocated to activity i in
mode m;
LFi: The latest start time of i;
i: The number of prerequisites of activity
of i;
rimk: The number of required units for
the Kth renewable resource for implementation of activity i in mode m;
imk : The number of required unit for
the Kth non-renewable resource for implementation of activity i in mode m;
T : The upper level of makespan.
Considering the above symbol denitions, the multi-objective MRCPSP model is suggested as fol-lows:
Problem 1:
minXn
i=1 mi X j=1 DD X t=1
Cijxij
(1 + )STi
+ DD X t=1 xn+1;1;t t X u=1 C0
(1 + )u; (1)
min
LFXi+1
t=EFi+1
t:xn+1;1;t: (2)
Subject to: mj X m=1 LFj X t=EFj
ximt = 1; 8i; (3)
mi X j=1 LFi X t=EFi t:xijt mj X m=1 LFj X t=EFj
(t dj)xjmt; 8j; i 2 j;
(4) n X i=1 mi X j=1 rijk
minft+dXij 1;LFjg
b=maxft;EFjg
xijb Rk;
8k = 1; ; R; t = 1; 2; ; T; (5) n X i=1 mi X j=1 ijk LFi X t=EFi
xijt Rk; 8k = 1; ; R; (6)
xijt 2 f0; 1g; i = 1; ; n; j = 1; ; mi;
t = 1; ; T: (7) Xjmt is the decision variable which is equal to 1, if
activity j is completed in mode m at time t, otherwise it equals zero. Eq. (1), the objective function, shows the net present value of the costs. Eq. (2) denes
the objective of minimizing the project makespan. Eq. (3) indicates that during the completion time of the project, just one mode should be allocated to each activity. Eq. (4) ensures the technological precedence of implementing activities. Eq. (5) is the constraint related to the availability of renewable resources, while Eq. (6) relates to the non-renewable resources of the project.
3. The multi-objective cuckoo optimization algorithm
3.1. General overview
Birds lay eggs for reproduction. A bird's egg is high in protein, which causes hunters to search for them, so, birds search for a safe place to nest and lay their eggs. This issue is a great challenge for them. Dierent birds have clever ways to nd a safe place for their eggs. Among the birds, one of the most interesting approaches relates to a bird called \cuckoo". This cunning bird forces other birds to participate in the process of its own survival. The mother cuckoo takes an egg of a host bird's nest and replaces it with her own, which is surprisingly similar to the original. Some birds recognize the cuckoo egg and throw it out of the nest, but, if not, it will mature into a cuckoo bird. The mature bird instinctively does the same herself and tries to nd the best nest for the continued survival of her children.
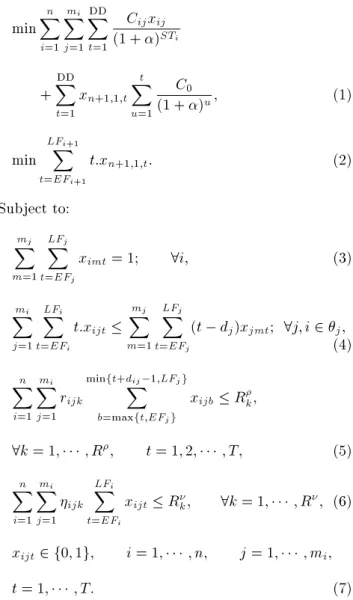
The Cuckoo Optimization Algorithm (COA) is an optimization algorithm which improves the ini-tial solutions (populations) through the algorithm. Figure 1 shows the owchart of MOCOA steps (a Multi-Objective COA). The initial population consists of matured cuckoos, which have laid their eggs in the nests of other birds. The eggs which are more similar to the host bird eggs obtain the opportunity to become a mature cuckoo and the other eggs are destroyed by the hosts. An environment (region) is called protable when a greater number of eggs become matured cuckoos. In other words, the more survived eggs in one region, the more inclination for laying eggs in that region. The goal of the algorithm is to nd an environment which is most protable. Each mature cuckoo represents a society and lives till mating. The best habitat of all societies will be a region to where the other societies migrate, so, the cuckoos settle in the best part of the place. Each cuckoo, according to the number of eggs and the dened egg-laying radius, will begin to lay eggs. This process will continue until the best habitat with more prot is found.
Conducted studies [12] into several specic prob-lems in the single-objective mode show that the cuckoo optimization algorithm has a more favorable perfor-mance than the Genetic Algorithm and Particle Swarm optimization meta-heuristics. The considerable key
Figure 1. Flowchart of the propose MOCOA.
point in this algorithm is the lay-eggs operator, with a specic performance, which has an appropriate ability to create diverse solutions in the optimization process. This paper uses a combination of an elitism mecha-nism [13], together with COA, to generate the Pareto solutions. The new changed parts of the algorithm, in comparison to the original, are shown by dierent colors in Figure 1.
3.2. Generating the initial cuckoo habitat In a cuckoo optimization algorithm, each solution is called a habitat. To start the COA, NP OP habitats
are randomly generated. It is assumed that each of these habitats is allocated to a cuckoo. In the proposed COA, each chromosome is formed by a string with the length of n components (number of activities). Each habitat is shown by a decimal number in an interval (0; Mi), in which Mi represents the mode number of
activity i. The decimal part of each habitat indicates the priority of that activity, and one unit is added to the integer part, which shows the selected completion and implementation mode for completing the activity. This way of representation is called a \random key". 3.3. Decoding
The Schedule Generation Scheme (SGS) is the main core of converting the habitat to a project schedule in the proposed meta-heuristic algorithm. A solu-tion (habitat) is determined using a serial scheduling scheme [14] and by decoding the scheduling of each activity. A major aw in a SGS is that only the
renewable limitation is considered. Thus, we add a penalty function to the SGS that calculates the degrees of violation from the non-renewable limitation. This penalty function is dened as follows:
STF (habitat)=#:
R
X
k=1
max 0;
n
X
i=1
imik RK
!! : (8) 3.4. Cuckoos' style of egg laying
Each mature cuckoo will be assigned a few eggs, randomly. In nature, each cuckoo lays from 5 to 20 eggs. Of course, the number of eggs assigned to each cuckoo has upper and lower bounds, and is part of the problem parameters. The cuckoo will lay eggs in its territory. This territory radius is called the Egg Laying Eadius (ELR). ELR is determined using the following formula:
ELR (habitat) =
Number of current cuckoo's eggsTotal number of eggs
(varhi varlow); (9)
where varhi and varlow are the upper and lower limits
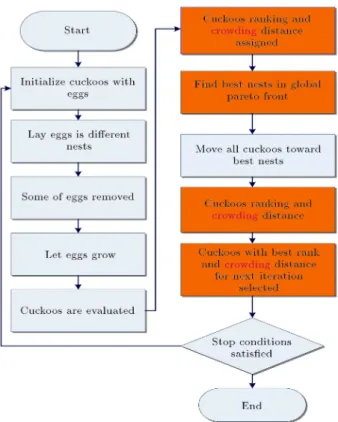
decided by the decision maker, and is an integer that controls the maximum values of ELR. The cuckoo's egg laying is shown in Figure 2 (here, it is assumed that the cuckoo has 4 eggs). Each mature cuckoo starts laying eggs randomly in some other host birds' nests within her ELR. After laying eggs in the nests of other birds, a percentage of eggs are to be identied and destroyed, (Usually 10% of the population solutions with the highest ranks are destroyed.) In this phase, the cuckoos and chicks are evaluated. The chicks grow and become mature cuckoos. Now, all cuckoo rankings
Figure 2. Cuckoo's egg laying process for searching the feasible region.
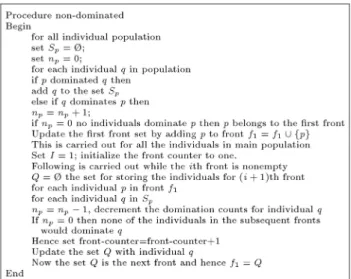
Figure 3. Ranking approach of non-dominated solutions.
are based on the concept of non-domination solutions. The ranking approach is shown in Figure 3. When the sorting process is completed, the value of the crowding distance will be assigned to the population fronts [13]. This approach is shown in Figure 4. The best solutions have to be selected among the rst ranked solutions, based on the tournament selection rule. The crowding distance criterion is an important criterion for choosing the best solutions among the rst ranked solutions. 3.5. Immigration of cuckoos
When the cuckoo chick matures and comes to lay eggs itself, it will migrate close to the best place that the group has already found. In order to reduce computations, we categorize the cuckoos into some cluster divisions. For each cluster, we calculate the criterion of Mean Ideal Distance (MID). Each cluster with the highest MID will migrate towards the selected point. To achieve a favorable habitat, the birds require a transfer vector. The transfer vector involves a direct path and a direction. At the beginning of the movement towards the optimal point, the cuckoos do not y straight to the target, but pave % of a direct path between two points directly, and divert ! degrees
from the direction of the transfer vector. This issue makes a better search space solution and prevents falling into the trap of local optimality. Usually, ! is a random angle between =6 and =6. At the end, the total solutions produced during the migration and laying process are ranked, based on the non-dominated solutions, and the value of the crowding distance is assigned to the population fronts. The number of Npop
cuckoos which have the lowest rank and the highest crowding-distance are transferred as mature cuckoos for future egg laying processes in the next generation.
4. Experiment results and discussions
In this section, rst, the parameters of MOCOA have been tuned, in order to improve the solution quality and computational speed, using the Taguchi design. Then, the set of Pareto solutions obtained from MO-COA will be compared to the set of solutions obtained from non-dominated sorting in the Genetic Algorithms (NSGA-II). The algorithms have been coded in MAT-LAB 7.8 software. The program is run on a PC with Core i7, 2.4 GHz as CPU, 4 GB RAM under Windows 7 platform.
4.1. Parameter tuning
The optimization process of the algorithm parameters can be empirically an extremely time consuming activ-ity. The factorial method is usually used to optimize the algorithm parameters. In this approach, each level of a factor is experimented with the levels of all other factor. In this method, the optimum levels of factors are detected by a high possibility. The main defect of this method is that if factors are more than 4, and levels are more than 3, then, the number of experiments required grows increasingly. To overcome this problem, orthogonal arrays can be used to decrease the number of experiments, while the strength of nding optimality is not decreased. A favorite method using orthogonal arrays is the Taguchi design, which has been used in this research.
In the Taguchi method, factors aecting the
Table 1. Parameter levels of the problem.
Factor levels
(Number of cuckoos, maximum iteration)
(100,50), (50,100), (40,120), (120, 40) Number of clusters 1-2-3-4
Control parameter
of egg laying 2-4-6-8 Maximum egg 4-5-6-7 Minimum egg 1-2-3-4
algorithm are divided into two categories: controllable factors and noise factors. We cannot control the noise factors, thus, they are eliminated from the algorithm. Therefore, the objective of the Taguchi method is to minimize noise and nd optimum levels of controllable factors for the algorithm. For this purpose, the Taguchi method converts solution values to a ratio of signal to noise. The signal determines the optimal value (the solution variable average) and the noise represents the non-optimal value (standard deviation). The signal to noise ratio shows a deviation rate in the solution variable. In this research, smaller values are better:
S=Nratio = 10 log10X yn2
: (10)
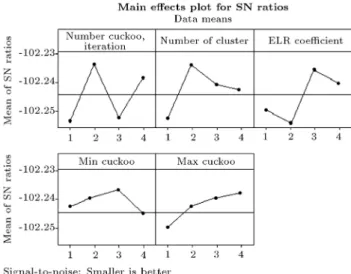
We studied the impacts of 6 factors on the proposed algorithm eciency. For each factor, 4 levels were dened, which can be seen in Table 1. Hence, to optimize these levels (L16(54)), designs of orthogonal
arrays, including 16 experiments, were used. The aim is to nd the best levels for the algorithm parameters, so that a set of Pareto solutions is optimal or near optimal. For this purpose, we use the index of MID (Mean Ideal Distance) [15]. This criterion measures the approximation of the Pareto solutions to the ideal point (0, 0) using Euclidean distance. According to this criterion, the best Pareto solution set has the lowest MID. The Graph Rate S=N parameter is shown in Figure 4. As seen in Figure 5, the best levels for various parameters are, respectively, levels 2, 2, 3, 3 and 1. So, the number of cuckoos equals 50, the number of algorithm iterations equals 120, the number of clusters equals 2, the controlling coecient controlling the egg laying radius is 6, the maximum number of eggs per cuckoo equals 7 and, the minimum number of eggs per cuckoo is 3.
5. Comparison indices
In order to evaluate the eciency of the proposed algorithm, it has been compared to the NSGA-II results. The NSGA-II has been shown as an ecient approach to dealing with project scheduling problems
Figure 5. Inuence diagram of parameters on the possibility of nding optimum solution.
and could be a good competitor for comparison pur-poses and in the validation process of the proposed algorithm. To compare these two algorithms, we have adapted problems including 10, 18, 20 and 30 activities, from the PSPLIB library; totally, 40 test problems. The costs of activities are assumed to have uniform distribution (between 1000 and 4000). Each of these problems involves 10 dierent ones. Then, we compare the two algorithms, based on three criteria, described below.
Mean Ideal Distance (MID): is the Euclidean distance between the ideal point (0, 0) and Pareto solutions. The smaller values of this criterion are the better ones:
MID =
n
P
i=1
p
f1i+ f2i
n : (11)
Spread of solution (SNS): calculates the dispersion amount of the non-dominated solutions. The larger values of this criterion lead to higher solution quality:
SNS = v u u u t
n
P
i=1(MID
p
f1i+ f2i)2
n 1 : (12)
Rate of achievement to the two objectives, simultaneously (RAS): The smaller the values, the higher quality solutions:
RAS =
n
P
i=1
f1i min(f1i;f2i)
min(f1i;f2i) +
f2i min(f1i;f2i)
min(f1i;f2i)
n : (13)
Table 2 shows the parameter values obtained from implementationof the algorithm for these problems. In
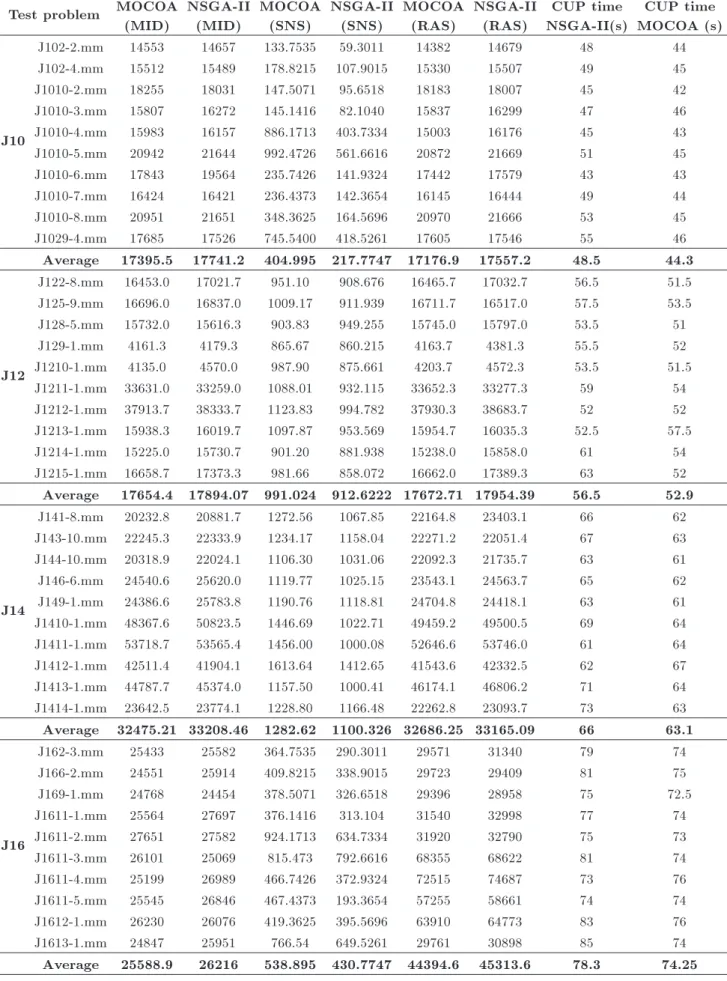
Table 2. Evaluation of non-dominated solutions. Test problem MOCOA
(MID)
NSGA-II (MID)
MOCOA (SNS)
NSGA-II (SNS)
MOCOA (RAS)
NSGA-II (RAS)
CUP time NSGA-II(s)
CUP time MOCOA (s)
J10
J102-2.mm 14553 14657 133.7535 59.3011 14382 14679 48 44
J102-4.mm 15512 15489 178.8215 107.9015 15330 15507 49 45
J1010-2.mm 18255 18031 147.5071 95.6518 18183 18007 45 42
J1010-3.mm 15807 16272 145.1416 82.1040 15837 16299 47 46
J1010-4.mm 15983 16157 886.1713 403.7334 15003 16176 45 43
J1010-5.mm 20942 21644 992.4726 561.6616 20872 21669 51 45
J1010-6.mm 17843 19564 235.7426 141.9324 17442 17579 43 43
J1010-7.mm 16424 16421 236.4373 142.3654 16145 16444 49 44
J1010-8.mm 20951 21651 348.3625 164.5696 20970 21666 53 45
J1029-4.mm 17685 17526 745.5400 418.5261 17605 17546 55 46
Average 17395.5 17741.2 404.995 217.7747 17176.9 17557.2 48.5 44.3
J12
J122-8.mm 16453.0 17021.7 951.10 908.676 16465.7 17032.7 56.5 51.5 J125-9.mm 16696.0 16837.0 1009.17 911.939 16711.7 16517.0 57.5 53.5 J128-5.mm 15732.0 15616.3 903.83 949.255 15745.0 15797.0 53.5 51
J129-1.mm 4161.3 4179.3 865.67 860.215 4163.7 4381.3 55.5 52
J1210-1.mm 4135.0 4570.0 987.90 875.661 4203.7 4572.3 53.5 51.5 J1211-1.mm 33631.0 33259.0 1088.01 932.115 33652.3 33277.3 59 54 J1212-1.mm 37913.7 38333.7 1123.83 994.782 37930.3 38683.7 52 52 J1213-1.mm 15938.3 16019.7 1097.87 953.569 15954.7 16035.3 52.5 57.5 J1214-1.mm 15225.0 15730.7 901.20 881.938 15238.0 15858.0 61 54 J1215-1.mm 16658.7 17373.3 981.66 858.072 16662.0 17389.3 63 52 Average 17654.4 17894.07 991.024 912.6222 17672.71 17954.39 56.5 52.9
J14
J141-8.mm 20232.8 20881.7 1272.56 1067.85 22164.8 23403.1 66 62 J143-10.mm 22245.3 22333.9 1234.17 1158.04 22271.2 22051.4 67 63 J144-10.mm 20318.9 22024.1 1106.30 1031.06 22092.3 21735.7 63 61 J146-6.mm 24540.6 25620.0 1119.77 1025.15 23543.1 24563.7 65 62 J149-1.mm 24386.6 25783.8 1190.76 1118.81 24704.8 24418.1 63 61 J1410-1.mm 48367.6 50823.5 1446.69 1022.71 49459.2 49500.5 69 64 J1411-1.mm 53718.7 53565.4 1456.00 1000.08 52646.6 53746.0 61 64 J1412-1.mm 42511.4 41904.1 1613.64 1412.65 41543.6 42332.5 62 67 J1413-1.mm 44787.7 45374.0 1157.50 1000.41 46174.1 46806.2 71 64 J1414-1.mm 23642.5 23774.1 1228.80 1166.48 22262.8 23093.7 73 63 Average 32475.21 33208.46 1282.62 1100.326 32686.25 33165.09 66 63.1
J16
J162-3.mm 25433 25582 364.7535 290.3011 29571 31340 79 74
J166-2.mm 24551 25914 409.8215 338.9015 29723 29409 81 75
J169-1.mm 24768 24454 378.5071 326.6518 29396 28958 75 72.5
J1611-1.mm 25564 27697 376.1416 313.104 31540 32998 77 74
J1611-2.mm 27651 27582 924.1713 634.7334 31920 32790 75 73
J1611-3.mm 26101 25069 815.473 792.6616 68355 68622 81 74
J1611-4.mm 25199 26989 466.7426 372.9324 72515 74687 73 76
J1611-5.mm 25545 26846 467.4373 193.3654 57255 58661 74 74
J1612-1.mm 26230 26076 419.3625 395.5696 63910 64773 83 76
J1613-1.mm 24847 25951 766.54 649.5261 29761 30898 85 74
Table 2. Evaluation of non-dominated solutions (continued). Test problem MOCOA
(MID)
NSGA-II (MID)
MOCOA (SNS)
NSGA-II (SNS)
MOCOA (RAS)
NSGA-II (RAS)
CUP time NSGA-II(s)
CUP time MOCOA (s)
J18
J1810-1.mm 32085 33100 818.181 439.014 30122 30133 110 116
J1811-1.mm 30004 30850 757.656 546.983 30035 31877 115 120
J1812-1.mm 30096 30736 313.754 208.386 28107 30767 127 122
J1813-1.mm 64731 65150 715.200 415.447 64776 64199 121 119
J1814-1.mm 75668 75828 919.500 557.376 74706 74388 122 118
J1815-1.mm 47411 49205 587.486 345.623 48447 49245 120 122
J1816-1.mm 62534 64354 714.929 574.322 63576 64399 125 120
J1817-1.mm 23101 23890 737.000 389.300 22134 23106 119 121
J1818-1.mm 22584 23770 305.392 205.828 23630 23811 123 122
J1819-1.mm 32937 33524 361.000 385.310 32552 32969 120 118
Average 42515.1 43040.7 623.01 406.7589 41808.5 42689.4 120.2 119
J20
J203-2.mm 27583 28510 639.800 204.507 30343 32112 128 121
J203-5.mm 30458 30156 442.104 333.3486 30495 30181 127 126
J2010-1.mm 27706 30142 259.424 151.9401 30168 29730 131 122
J2011-1.mm 33737 35279 421.535 143.500 32312 33770 128 123
J2012-1.mm 33517 34513 380.090 277.295 32543 33562 127 130
J2013-1.mm 66347 71284 745.700 140.019 69335 69394 129 128
J2014-1.mm 75420 75201 759.000 107.689 73317 75459 134 121
J2015-1.mm 57981 58542 984.200 697.077 58027 59154 128 125
J2016-1.mm 62590 63499 904.000 108.164 64642 65545 126 123
J2017-1.mm 32454 32642 577.284 345.402 30483 31670 127 118
Average 44779.3 45976.8 611.3137 250.8942 45166.5 46057.7 128.5 123.7
J30
J3010-1.mm 47038 48744 1432.300 405.028 47076 48777 155 158
J3011-1.mm 47767 48190 706.517 414.817 47814 47230 159 156
J3012-1.mm 44875 44528 1590.500 526.764 44914 45070 161 157
J3013-1.mm 10163 10217 876.000 259.644 10170 10823 154 155
J3014-1.mm 10084 11389 642.709 305.983 10290 11396 155 154
J3015-1.mm 98572 97456 943.021 475.346 98636 97511 156 157
J3016-1.mm 111420 112680 1050.500 663.346 111470 113730 159 156
J3017-1.mm 45494 45738 972.600 539.708 45543 45785 160 165
J3018-1.mm 43354 44871 382.600 324.815 43393 45253 156 155
J3019-1.mm 47655 49799 623.992 253.215 47665 49847 158 158
Average 50642.2 51361.2 922.0739 416.8666 50697.1 51242.2 157.3 156.1
this table, the rst column is the problem named in the library. The second column is the MID criterion value, obtained using MOCOA. The third column is the same value for NSGA-II. The 4th and 5th columns are the values of the SNS criterion for MOCOA and NSGA-II, respectively. Also, the 6th and 7th columns are RAS values for the two algorithms. The 8th and 9th columns show the CPU time in both algorithms. As the results show, MOCOA dominates
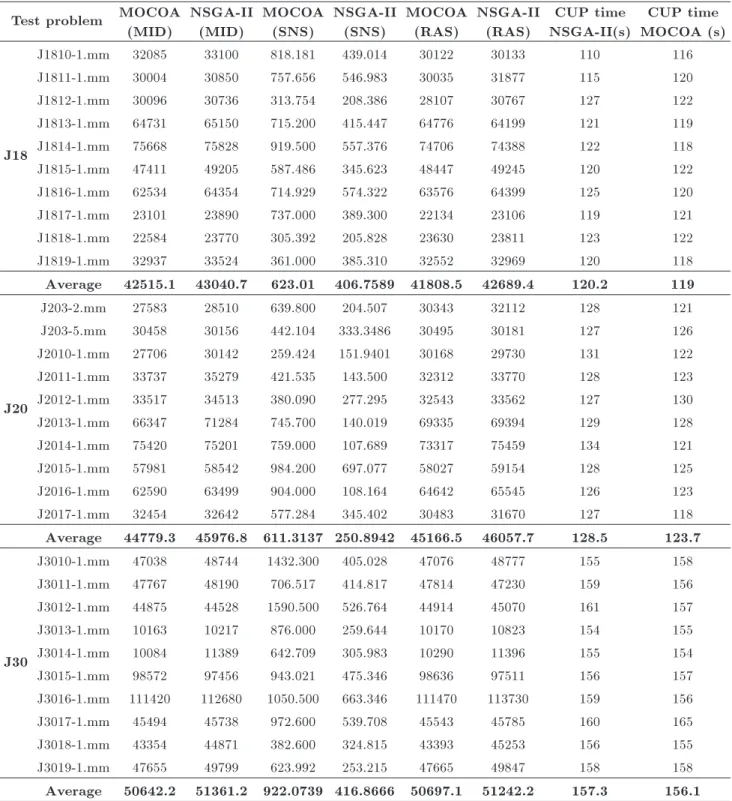
NSGA-II regarding all dened criteria, on average. This fact shows the performance of the proposed algorithm in comparison to its famous competitor. Regarding CPU time, both algorithms have more or less the same values, on average. Also, Table 3 shows the paired T-test for the indices obtained from both algorithms. As the results show, distribution of the Pareto solutions in the MOCOA algorithm is better than those of NSGA-II. In general, according
Table 3. Paired comparisons of two algorithms. Test
problem
T -value (MID)
P -value (MID)
T -value (SNS)
P -value (SNS)
T -value (RAS)
P -value (RAS)
J10 -1.87 0.095 3.60 0.006 -2.92 0.017
J12 -2.21 0.055 3.63 0.003 -2.82 0.024
J14 -2.48 0.035 3.95 0.002 -2.44 0.037
J16 -2.02 0.075 3.56 0.006 -3.38 0.008
J18 -2.36 0.043 5.09 0.001 -3.28 0.009
J20 -2.45 0.037 4.56 0.001 -3.26 0.010
J30 -2.99 0.015 5.03 0.001 -2.28 0.049
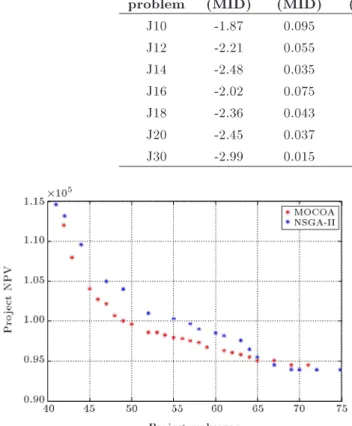
Figure 6. Dispersion of non-dominated solutions for MOCOA and NSGA-II.
to the computational results, with a signicant level of 90.5%, the MOCOA algorithm performs better than NSGA-II in terms of dened indices. In addition, to show the eciency of the proposed algorithm, Figure 6 shows the non-dominated solutions of MO-COA and NSGA-II algorithms for the problem, J3015-1.mm.
6. Conclusions
In this research, we presented a multi-objective cuckoo optimization algorithm to solve a multi-mode resource constraint project scheduling problem with two ob-jective functions, including the project makespan and the project NPV. To validate the proposed algorithm, we evaluated its performance using 40 test problems taken from the literature. The solutions resulted from this algorithm were compared to the results obtained by multi-objective genetic algorithms, including several dierent metrics. The results show that the proposed algorithm has a good performance in solving the test problems. According to the computational results, in 91% cases, the multi-objective cuckoo optimization algorithm performed better than the multi-objective genetic algorithm. We believe that cuckoo optimization algorithms have a high ability to deal with optimization
problems. Therefore, the authors also recommend con-sidering the use of this algorithm in other combinatorial problems.
References
1. Blazewicz, J., Lenstra, J.K. RinnooyKan, A.H.G. \Scheduling subject to resource constraints: Classica-tion and complexity", Discrete Applied Mathematics, 5, pp. 11-24 (1983).
2. Kolisch, R. and Drexl, A. \Local search for non-preemptive multi-mode resource-constrained project scheduling", IIE Transactions, 29, pp. 987-999 (1997). 3. Slowinski, R. \Multi-objective network scheduling with ecient use of renewable and nonrenewable re-sources", European Journal of Operational Research, 7, pp. 265-73 (1981).
4. Al-Fawzan, M.A. and Haouari, M. \A bi-objective model for robust resource-constrained project schedul-ing", Int. Journal of Production Economics, 96, pp. 175-187 (2005).
5. Viana, A. and De Sousa, J.P. \Using metaheuristics in multi-objective resource constrained project schedul-ing", European Journal of Operational Research, 120, pp. 359-374 (2000).
6. Abbasi, B., Shadrokh, Sh. and Arkat, J. \Bi-objective resource-constrained project scheduling with robust-ness and makespan criteria", Applied Mathematics and Computation, 180, pp. 146-152 (2006).
7. Abdelaziz, F.B., Krichen, S. and Dridi, S., A Multi-Objective Resource-Constrained Project Schedul-ing Problem, K. Mellouli, Ed., ECSQARU, LNAI 4724, pp. 719-730 (2007).
8. Ballestn, F. and Blanco, R. \Theoretical and prac-tical fundamentals for multi-objective optimization in resource-constrained project scheduling problems", Computers & Operations Research, 38, pp. 51-62 (2011).
9. Nabipoor-Afruzi, E., Roghanian, E., Naja, A.A. and Mazinani, M. \A multi-mode resource-constrained discrete time-cost tradeo problem solving using anad-justed fuzzy dominance genetic algorithm", Scientia Iranica, 20(3), pp. 931-944 (2013).
10. Aboutalebi, R.S., Naja, A.A. and Ghorashi, B. \Solv-ing multi-mode resource-constrained project schedul-ing problem usschedul-ing two multi-objective evolutionary al-gorithms", African Journal of Business Management, 6(11), pp. 4057-4065 (2012).
11. Kazemi, F.S. and Tavakkoli-Moghaddam, R. \Solv-ing a multi-objective multi-mode resource-constrained project scheduling problem with particle swarm op-timization", International Journal of Academic Re-search, 3(1), pp. 103-110 (2011).
12. Rajabioun, R., Cuckoo Optimization Algorithm, Ap-plied Soft Computing, 11, pp. 5508-5518 (2011). 13. Deb, K., Pratap, A., Agarwal, S. and Meyarivan, T.
\A fast and elitist multi-objective genetic algorithm: NSGA-II", IEEE Transactions on Evolutionary Com-putation, 6, pp. 182-197 (2002).
14. Kolisch, R. \Serial and parallel resource-constrained project scheduling methods revisited: theory and com-putation", European Journal of Operational Research, 90, pp. 320-333 (1996).
15. Zitzler, E., Laumanns, M. and Thiele, L. \SPEA2: Im-proving the strength Pareto evolutionary algorithm", Technical Report 103, Computer Engineering and Networks Laboratory (TIK), Swiss Federal Institute of Technology (ETH) Zurich, Gloriastrasse 35, CH-8092 Zurich, Switzerland (2001).
Biographies
Arman Ghamginzadeh was born in Kermanshah,
Iran, in 1987. He received a BS degree in Industrial Engineering in Yazd, Iran, in 2009, and an MS degree in Industrial Engineering at the Islamic Azad University, Qazvin, Iran. His research interests include evolu-tionary computation, optimization, project scheduling, scheduling and sequencing, fuzzy theory and bi-level programming.
Amir Abbas Naja received his BS degree in In-dustrial Engineering from Isfahan University of Tech-nology, Iran, in 1996, and MS and PhD degrees in Industrial Engineering from Sharif University of Technology, Tehran, Iran, in 1998 and 2005, respec-tively. He is currently Assistant Professor of Industrial Engineering at K.N. Toosi University of Technology, Tehran, Iran. His research interests include project scheduling and management, portfolio selection mod-els, reliability engineering and applied operations re-search.
Parham Azimi was born in 1974. He received his BS, MS and PhD degrees in Industrial Engineering from Sharif University of Technology in 1996, 1998 and 2005, respectively, and is currently Assistant Professor of Industrial Engineering at the Islamic Azad University, Qazvin, Iran. His research interests include optimization via simulation technique, facility layout problems, location-allocation problems, graph theory and data mining techniques.