Mackerel and sunshine
13
0
0
Full text
(2) MACKEREL AND SUNSHINE.. 395. though even ir a considerable proportion or it were round to consist or minute animal organisms, these in their turn would reed upon the phytoplankton. It is thererore to the conditions which ravour the production or phytoplankton, the rundamental rood supply, that we must turn. The three most obvious matters to be considered in connection with the production or this vegetable plankton are: (1) the composition ,or the sea-water itself, (2) the temperature, and (3) the amount or light which is available ror the production or plant lire. With regard to the composition or the sea-water itself, the only inrormation available rerers to its salinity, and up to the present it has not been possible to show any simple relation between changes in salinity and changes in the vegetable or animal production in the area under consideration. The same is true or temperature, though this will be considered in more detail below. It is the object or the present paper to call attention to what appears to be evidence or the influence or the third ractor, the intensity or light. Experiments on the cultivation or marine plankton diatoms in the laboratory, upon which I had been engaged, had drawn my attention to the great importance to be attached to the intensity or the light to which the diatoms were exposed. It thererore occurred to me that a special abundance of Copepods during the month or May in any year might be due to a special amount or sunshine during the earlier months or the year, which would increase the amollnt or phytoplankton, the Copepod rood. An attempt was thererore made to correlate the average quantity or mackerel per boat taken in May with the number or hours or bright sunshine recorded during the first quarter or the year. The official statistics or mackerel landed are not very satisractory ror such a purpose, since they give only the total quantities or fish and give no inrormation as to the number of vessels rrom which the fish are obtained. In making use or them, thererore, one must bear in mind that the number or vessels to which the figures relate varies rrom year to year, although the amount or this variation over a small number or consecutive years will not generally be very large. In order to get figures or a more definite character, I applied to Messrs. Peacock & Co., or Lowestort, who have had vessels engaged in the western mackerel fishery ror many years. Messrs. Peacock were good enough to rurnish me with a series or figures giving the number or hundreds or mackerel landed each month rrom February: to June, at Newlyn and Milford,* by three or their steam drirters, ror each or the * These vessels landed fish only at N ewlYll and Milford, so that, by combining the figures for the two ports, we get the total number of fish taken by each boat from the western fishing grounds. KEW SERIES.-VOL. VIII. No.4. 2E.
(3) MACKEREL AND SUNSHINE.. :-196. years 1902-1908, as well as similar figures for three sailing drifters. These figures are given in Tables 1. and II. Messrs. Peacock's figures show that by far the largest quantities of mackerel are landed in the month of May, and that, as in the case of,. the officialstatistics (cf. Bullen, lococit.,p. 277),the figuresrepresenting the May landings dominate the curve representing the total landings from the spring fishing. Moreover, it is practically certain that the vessels fished throughout May, whereas for the other months, except, perhaps, April, one has not generally any definite knowledge as to when they began or ended their fishing. In the diagram below (Fig. 1) the average number of mackerel per HUNDREDS. HRS. SUNI. OF MACKEREL. 275 .~'~oM;Y. .~ 250. J 600. -\~ /-. \\. I. \\. \. \. 100 ,. \ \. 225, AV£RAC£ 211'5. '. iW~GE 455 '\"". "'100. \S'~t1' 1- ~1'1-,,"11' 1-{"\ "" ' -'lC",!? "-. 200. ~. 500. ~---. 175. 1200 150. '9°2 FIG. I.-The. 1')0:'>. 19O~. '9°5. 19°6. '9°7. '903. dotted line indicates the average number of hours of bright sunshine recorded for the months of February and March, in each of the years 1902-1908, at the meteorological stations at Plymouth, Falmouth, and Scilly. The continuous line indicates the average number of "hundreds" (120 fish) of mackerel per boat landed at Newlyn and Milford in the month of May of the same years 1902-1908, by three steam drifters belonging to Messrs. Peacocl, & Co., of Lowestoft.. boat in "hundreds" (each "hundred" really means 120 fish) landed in May by Messrs. Peacock's three steam drifters is represented by the continuous line, whilst the number of hours bright sunshine during February and March is represented by the dotted line. The sunshine figures were obtained by taking the average of the number of hours.
(4) MACKEREL,. AND SUNSHINE.. 397. recorded at the three meteorological stations, Plyhlouth, Falmouth, and Scilly. Although the extreme closeness of the agreement between the two curves may be due to chance, it seems scarcely possible to doubt that they indicate a fundamental correlation between the abundance of mackerel in May and the amount of bright sunshine during the earlier months of the year. The sunshine curve, it should be added, has practically the same shape, whether it is taken for the three stations chosen, or for the whole south-western district of England, which includes inland stations, or for the south-west of England and south Ireland combined. The figures on which the sunshine curve is based will be found in Table III. In Fig. 2 the continuous line gives the total number of cwts. of mackerel landed on the south and west coasts of England and Wales in May* for each of the years from 1886-1908, as given by the official statistics of the Board of Trade and Board of Agriculture and Fisheries (see Table IV.), whilst the dotted line gives the average number of hours bright sunshine recorded for the south-west of England and south Ireland for the first quarter of the year (J an.March), as given in the reports of the Meteorological Office (see Table V.). As already pointed out, the official figures of mackerel landed take no account of the number of boats fishing, and those taken during the first four or five years are known to be very imperfect and should therefore be neglected. It is practically certain that the fishing power has increased during the years for which the records are given, more especially since the introduction of steam drifting about 1902. Oomparing the two curves in Fig. 2 generally, and bearing in mind the above limitations, there is, I think, sufficient similarity in the way in which they rise and fall together to justify us. in regarding them as in no way contradicting the very definite agreement shown between Messrs. Peacock's figures and the sunshine curve as seen in Fig. 1. Oonsidering in more detail the years 1902-1908, it will be seen that the most striking difference between the curve given by the official figures and that representing the averages for Messrs. Peacock's boats is the great drop which the official figures show in 1906. A similar though less marked drop in 1906 is also shown by the curve given in Fig. 3, which represents the average number of "hundreds" of mackerel landed by Messrs. Peacock's three sailing drifters. A reference to the figure given by Bullen (loc.cit., p. 279, Fig. 1) also shows a minimum in 1906 for the Oopepods taken at the International Stations E.5. and E.6. The high figure for 1906 given by the three steam drifters, although it agrees with the high February and March sunshine for that * Most of the fish are landed at Newlyn and Milford Haven;.
(5) HOURS BRIGH. MACKEREL CWTS. .71530,000. OF. T. SUNSHINE. 5'1-0,000. 520. ". p , \. ,. , , i I. \ \. 2~0. 240. I. ,. \. ". \. 1 I I / / kJl 2/ il. 2201- fii ::J/ "'I 200'. ,. \. ,. ," '. ,. /. /. /. .. \. \. 500,000. II. \. /. -..,. //. \. -.J. \. 260,000. /"\. / I I. \. ~. \. \. \. 220,000 \. \ \. 130.000 140,000. v. ,. ",0:-":'. I '. "*,, :c:-. -J. 100,000 GO,OOO. 1110 1"36. FIG. 2.-The. '~7. '1\1). '1)9. '90. '9'. '92. '93. '94. '95. '96. '97. '93. '99. 19°0. '01. '02. '03. '0... '05. '06. '°7. '01). dotted line indicates the average number of hours of bright sunshine recorded for the first quartel' of the year (January to March) for each of the years 1886-1908, for the Meteorological OfficeDistricts England S.W. and S. Wales, and Ireland South. The continuous line indicates the number of hundredweights of mackerel recorded as landed on the South and West Ooasts of England and Wales, in the month of May, for each of the years 1886-1908 (Official Statistics)..
(6) ~. . 399. MACKEREL AND SUNSHINE.. year, does not therefore agree with the official figures for mackerel, with the catches of the three sailing drifters, nor with the figure taken to represent the Copepods. Any explanation of this discrepancy can only be of a speculative kind, but it is probable that the steam drifters fished much further west of the Scilli-es than the sailing arifters would go, or than the International Stations are situated. If this is the explanation of the difference shown, it would seem to suggest that in May, 1906, there was some local factor at work on the grounds nearer the shore which did not operate on those which were more,distant. HUNDREDS OF MACKEREL. 400. 300. 200 ~. ~. ""'l.'ty <; D", 'TIF--"/i: 'T~. 100 1902. 19°3. f 9 04-. 19°5. f906. 1907. FIG. 3.-0urve indicating the average number of "hundreds" (120 fish) of mackerel per boat, landed at Newlyn and Milford, in the month of May of the years 19021907, by three sailing drifters belonging to Messrs. Peacock & 09., of Lowestoft.. Before leaving the question of sunshine it should be stated that curves representing the bright sunshine in the months of April and May have not shown any kind of correlation with the quantities of mackerel taken. In order to ascertain whether the temperature of the water during the fishing months in the different years bore any relation to the takes of mackerel, and to meet the suggestion that the effect of the bright sunshine might have been simply to increase that temperature, a series of curves have been drawn showing the average temperature of the surface water in February, March, April, and May for each of the years 1902-1908 in the area between 48° and 50° North Latitude and 4° and 10° West Longitude. The temperatures given in Table Vr., and.
(7) 400. MACKERELAND SUNSHINE.. represented in Fig. 4,are the means of the six temperature averages given for this area on the Monthly Pilot Charts of the North Atlantic, issued by the Meteorological Office in London. For comparison with these, Table VII, and Fig. 5 give the mean temperatures at the surface and at 10 meters (5 fathoms) depth found at Stations E.5. and E.6. on the International Cruises carried out in May in each of the years 1903-8. It will be seen that the two curves follow! the same general course. The outstanding feature of these temperature curves is the occurrence of two very marked maxima in 1903 and 1905. On. C <12°. HO. 9°. ". ". go. 19°2. 19°5. 1904. i905. i906. 19°7. 19°5. FIG. 4.-Curves showing the mean surface temperature O'fthe sea in degrees Centigrade in the area between Lat. 480 and 52° N., and Long. 4° and 10° IV., as given on the Monthly Pilot Charts of the Meteorological Office for the months of February, March, April, and May, in the years 1902-1908. ". comparing the curves with the curves representing the catches of mackerel, either with that given by Messrs. Peacock's figures, or by the official figures, no relation between the two can be traced. Whilst the 1905 temperature maximum agrees with the maximum total catch of mackerel as shown by the official statistics and the high average catch shown by Messrs. Peacock's figures, the temperature maximum of 1903 is accompanied by low catches of mackereL'" The other parts of the curves also give no indication of any close connection between the surface sea temperatures and the mackerel catches..
(8) 401. MACKEREL AND SUNSHINE.. I have to, thank Mr, G. E. Bullen for assistance in plotting the early curves which rendered the relation between sunshine and mackerel probable, though I am myself entirely responsible for the accuracy of the curves and figures as given in this pap'er. Mr. D. J. Matthews has also helped me in various ways. My thanks are especially Q1;leto Messrs. Peacock & 00., of Lowestoft, for the very great trouble they have taken in supplying the figures showing the numbers of mackerel caught by their vessels and for allowing them to be used. Without their r~ady co.operation this paper could not have been written.. c 11°. 10°. 9° 19°5. 1904. 19°5. 1906. 19°7. 190B. FIG. 5.-Curves showing the means of the temperatures, in degrees Centigrade, recorded at Stations E.5 and E.6 at the surface (continuous line) and at 10 meters (dotted Hne), on the International Investigation: Cruises in the month of May, for the years 1903-1908..
(9) 402. MAOKEREL AND SUNSHINE.. TABLE I. Table showing the number of "hundreds" of Mackerel landed by three STEAMDRIFTERSat Newlyn and Milford Haven for the years 1902-8, from figures supplied by Messrs. Peacock & 00., of Lowestoft. LANDED AT NEWLYN.. I"ANDED AT MILFORD.. .A.... '. /. 1902. March. ilpril May Tune 1903. March. ilpril May. Tune. ". Steam drifter A. Rds. 103 490 287. Steam drifter B. Rds. 222 263 263 289. Steam drifter C. Hds. 18 134 113 -. 247! 1201. 1271 140. 4091 202. 328. 218. 196. 117. 57. 3001 11l 293 277!. Steam drifter A. Rds. -. -. Steam drifter B. Rds. -. -. .. Average Number 0 'hundred,. -. per boat landeda1 Newlyn and Milford. Rds. 120 201 289 288 261. Steam drifter C. Rds. -. -. -. -. -. -. 24. 162. 47. -. -. 60 -. 268 74. 347! 2163 ..,. 293 143. 2371 313 197 -. -. -. 34 -. 295 225 261. 19 182 37 -. 3741 2911 4701 -. 96 98 -. 49i 871 429£ 378£ -. 12 25 -. 16 62. 12 1291. 4 4. 11111. -12t. 1904.. March. A.pril May Tune 1905.. February. March. A.pril May June 1906. February March. April. 120 235 585 47! 27 110. '. -. -. -. -. -. 71 319 517tt. 661* 266 616. 37t 3261 237£'IT. 109! 363£ 418. -. -. -. 1051 457 -. -. -. -. -. -. -. * Steam drifter B is not the same vessel in 1908 as in previous years. Commenced March 17th.. t. 'ITFinished May 19th. Average for vessels A and B.. tt. .... 61. 83 178 637. 481 1051 584 -. 1601. 59 296 319 490 47. -. 91 3201 869 -. 1907. March.. I. 321 - 41 -. -. 83, -. 767 -. 210. 125 581 25. -. 269 29. -. -. 708 21. May June. April May June : 1908. March. April May June. -. -. -. -.
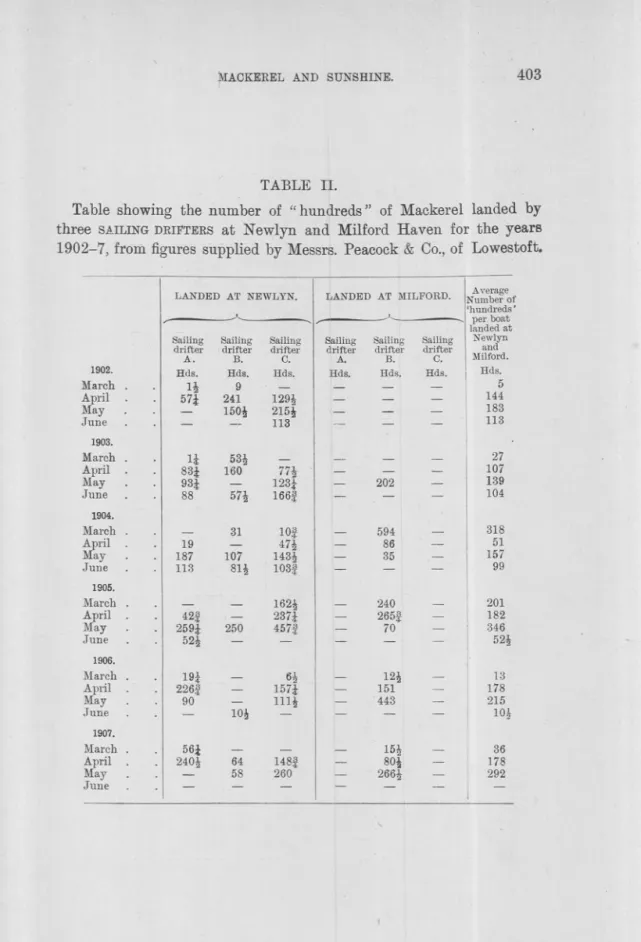
(10) .. I. 403. MACKEREL AND SUNSHINE.. TABLE II. Table showing the number of "hundreds" of Mackerel landed by three SA.ILING DRIFTERSat Newlyn and Millord Haven for the years 1902-7, from figures supplied by Messrs. Peacock & Co., of Lowestoft. LANDEDAT NEWLYN. --'-. ,. 1902. March. A.pril May June 1903. March. April May June 1904. March. April May June 1905. March.. April May June. Sailing Sailing drifter ' drifter B. A. Hds. Hds. 9 I! 241 571 150! -11 831 931 88 19 187 113. 42i 2591 52!. 1906. March.. 191. April May June. 226i 90 -. 1907. March. April May June. 56!. 240! -. 53! 160. -. 57!. " Sailing drifter C. Hd.. 129i 215! 113 77! 1231 166!. Average LANDEDAT MILFORD. Number 01 'hundred. --', per boat landedat Sailing Sailing Sailing Newlyn and drifter drifter drifter Milford. B. C. A. Hd.. Hd.. Hd.. Hd.. 5 144 183 113. --. -. -. -. 202. -. -. -. -. 143! 103!. -. 594 86 35. 162i 2371 457! -. -. 240 265¥ 70. 10!. 6! 1571 111i -. -. 12! 151 443 -. 64 58 -. 148! 260 -. -. 15i 80! 266!. 31. -. 107 81!. -. 250 -. 10!!. 4n. -. -. -. -. -. -. -. -. -. -. 27 107 139 104 318 51 157 99. 201 182 346 52i. -. 13 178 215 10. -. 36 178 292 -. ,'-.
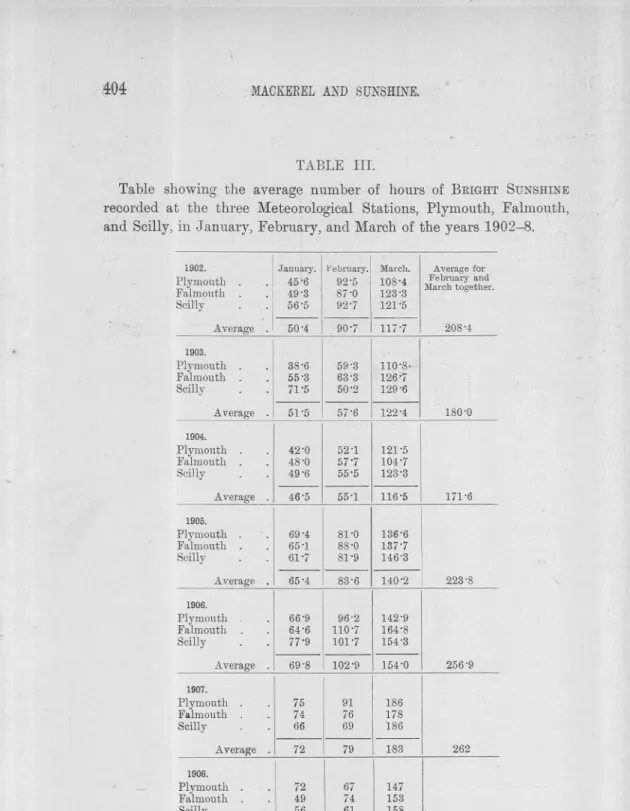
(11) ,404. ,. MACKERELAND SUNBHINE.. TABLE III. Table showing the average number of hours of BRIGHTSUNSHINE. recorded at the three Meteorological Stations, Plymouth, Falmouth,. and Scilly, in January, February, and March of the years 1902-8, 1902.. January.. Plymouth, Falmouth SciHy Average. February. 92'5. 45'6. 49 '3 56 '5 -,._,50'4. 87 '0 92 '7. I. Average. March,. 1. 108'4 123 '3 121 '5. .. 1. 90'7. 117'7. 59'3 63'3 50'2. 110'8,.' 126'7 129'6. I. for. February and March together, 208'4. 1903.. Plymouth Falmouth Scilly. --. Average. 38'6 55'3 71'5. -. -. 51'5'. 57'6. 122'4. 42'0 48'0 49'6. 52'1 57'7 55'5. 121'5 104'7 123'3. 180'0. 1904. Plymouth Falmouth SciJ]y. -. Average. -. -. 46'5. 55'1. 116'5. 69'4 65'1 61'7. 81'0 88'0 81'9. 136'6 137'7 146'3. 171'6. 1905, Plymouth Falmouth Scilly. -. Average , 1906. Plymouth Falmouth Scilly. 65'4. -. Average 1907. Plymouth Falmouth Scilly. --. Average 1908, Plymouth Falmouth Scilly Average. '". -. 66'9 64'6 77'9. '. -. 83'6. uo:2\. 96'2 110'7 101'7. 142'9 164'8 154'3. -. 69'8. 102'9. 154'0. 75 74 66. 91 76 69. 186 178 186. -. -. 72. 79. 183. 72 49 56. 67 74 61. 147 153 158. 59. -. 67. -. 153. 223'8. 256'9. I. 262. I. 220.
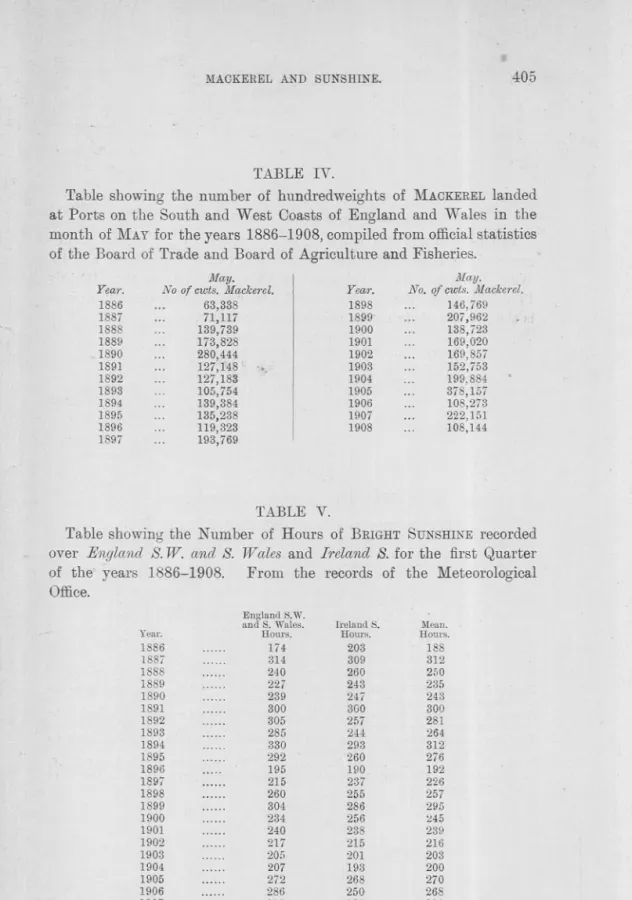
(12) 405. MACKEREL AND SUNSHINE.. TABLE. IV.. Table showing the number of hundredweights of MACKEREL landed at Ports on the South and West Coasts of England and Wales in the .month of MAY for the years 1886-1908, compiled from official statistics of the Board of Trade and Board of Agriculture and Fisheries. May. May. No of cwts.Mackerel. Year. No. of cwts.Mackerel. Y~!I'r. 1886 63,338 1898 ... 146,769 1887 71,117 1899' ... 207,962 1888 139,739 1900... 138,723 1889 173,828 1901... 169,020 ..1890 280,444 1902 ... 169,857 1891 1892 1893 1894 1895 1896 1897. 127,T48 c. ",. 1903.... 127,183 105,754 139,384 135,238 119,323 193,769. 152,753. 1904... 1905... 1906... 1907... 1908.... 199,884 378,157 108,273 222,151 108,144. TABLE V. Table showing the Number of Hours of BRIGHTSUNSHINErecorded over England S. W. and S. Wales and Ireland S. for the first Quarter of the years 1886-1908. From the records of the Meteorological Office. England S.W.. Year. 1886 1887 1888 1889 1890 1891 1892 1893 1894 1895 1896 1897 1898 1899 1900 1901 1902 1903 1904 1905 1906. .'. I. 1907 1908. ...... ...... ...... ...... ...... ...... ...... ...... ...... ...... ..." ...... ...... ...... ...... ...... ...... """. ...... ...... ....... ....... ....... and S. Wales. Hours. 174 314 240 227 239 300 305 285 330 292 195 215 260 304 234 240 217 205 207 272 286. 315 246. IrelandS. Hours. 203 309 260 243 247 300 257 244 293 260 190 237 255 286 256 238 215 201 193 268 250. 256 229. Mean. Hours. 188 312 250 235 243 300 281 264 312 276 192 226 257 295 245 239 216 203 200 270 268. 286 238.
(13) r"'-- -. I. '406. .MAGKEREL,. AND SUNSHINE.. I. , .. II I. TABLE 'Vb Table showing the average surface temperature in degrees Centi,grade of the Area between 48° a~'d 52° North Latitude and 4° and 10~ West Longitude from February 'to May, as given on, the Monthly Pilot Charts of the Meteorological Officer Each temperature given is the average of six means printe.!i ou tb,e'~harts. 1902. 8'7 9~ 9~ 10'7. February March April May. 1903. 10'0 9~ 10~ 11'6. 1904. 9'1 8~ 9~ 10'7. 1905. 9'6 9~ 9~ 11'9. 1907. 8'4 (:)'0 9'6 10'6. 1906. 9'3 9~ 9~ 10'4,. I. I. I. 1908. 9'4 9'0 8'9 -10'8. TABLE VII.. ,-. MAY HYDROGRAPHICCRUISES: TEMPERATURES(CO) AT STATIONS E.5 AND E.6. 10 meters. Surface, E.5. 1903 1904 1905 1906 1907 1908. '.. I E.6.. 11'08. 9'63. I 10'20 9'30. 11'39 10'16 10'69 10'69. I 10 '83 9'68 9'79* 9'91. I. .Mean. 10'64, 9'46 11'11 9'92 10'24 10'30. I I. ' I. I. E.5.. E.6.. Mean.. 11'02 9'60. 10'19 9'15 10'71 9'62 9'33* 9'85. ]0'60" 9;3'l 10'98 '9'82 9'98 10'27. 11'25 10'03. 10'69 110:63 ,. I. -,. Station E,5 is situated in Lat. 49° 6' N., Long. 6° 32' W.; i,e. about 50 miles to the southward of the Scilly Isles. Station E.6 is situated in Lat. 50° 24' N., Long, 6° 5' W,; i.e. about 30 miles to the northward of the Scilly Isles. . The Temperature records are taken from the Bulletin des resultats acquis pendant les croisieresperiodiques. 1902 onwards. * Sta. E. 1907. Y. 14. 50° 35' ~. Lat" 6° 14' W. Long., 89 m., worked for E,6. (about 11 miles further north), Probable surface temp. at E.6. would be 0'4° lower. '. ". .-'. -. J.
(14)
Figure


+6


Related documents
The projected gains over the years 2000 to 2040 in life and active life expectancies, and expected years of dependency at age 65for males and females, for alternatives I, II, and
This conclusion is further supported by the following observations: (i) constitutive expression of stdE and stdF in a Dam + background represses SPI-1 expression (Figure 5); (ii)
As noted in the Literature Review, above, scholarship on the determinants of foreign direct investment (FDI) variously argue the influence of GDP growth, the openness of a
There are infinitely many principles of justice (conclusion). 24 “These, Socrates, said Parmenides, are a few, and only a few of the difficulties in which we are involved if
19% serve a county. Fourteen per cent of the centers provide service for adjoining states in addition to the states in which they are located; usually these adjoining states have
Schematic overview of the experimental setup for the PL-V method, used to obtain lifetime images while modulating the surface band bending by applying voltage over the
National Conference on Technical Vocational Education, Training and Skills Development: A Roadmap for Empowerment (Dec. 2008): Ministry of Human Resource Development, Department
Re- cently, the Commission on Sustainable Agriculture and Climate Change synthesized a vast array of literature on agriculture, food systems, food and nutritional se- curity,
