Interaction of Nucleoside Reverse Transcriptase Inhibitor Pharmacology and Aging in the Multicenter AIDS Cohort Study
By Emily Wings
Honors Thesis
UNC Eshelman School of Pharmacy University of North Carolina at Chapel Hill
March 4, 2020
Approved:
Interaction of Nucleoside Reverse Transcriptase Inhibitor Pharmacology and Aging in the 1
Multicenter AIDS Cohort Study 2
3
Emily Wings1, Yen Chang2, Andrew Edmonds2, Brian Van Horne1, Craig Sykes1, Ada 4
Adimora3, Julie B. Dumond1 5
6
1UNC Eshelman School of Pharmacy, University of North Carolina at Chapel Hill, Chapel Hill, 7
NC, USA 8
2Gillings School of Global Public Health, University of North Carolina at Chapel Hill, Chapel 9
Hill, NC, USA 10
3School of Medicine, University of North Carolina at Chapel Hill, Chapel Hill, NC, USA 11
12
Word counts: abstract - 250 words, manuscript - 2514 words, addendum - 303 words 13
Figures: 1 14
Tables: 3 15
References: 24 16
17
ABSTRACT 19
Introduction: The HIV-infected population is aging. Therefore, considerations concerning the 20
effect of aging on the safety and efficacy of antiretroviral (ARV) therapy are needed. Nucleoside 21
reverse transcriptase inhibitors’ (NRTIs) level of inhibition of viral reverse transcriptase is 22
influenced by the ratio of intracellular metabolites (IM) to endogenous deoxynucleotides (EN) 23
within the cell. We sought to examine the effect of aging on NRTI pharmacology in HIV+ men 24
within the Multicenter AIDS Cohort Study (MACS). 25
Methods: Stored peripheral blood mononuclear cell (PBMC) samples were analyzed from 152 26
men (83 aged ≤45 years and 69 aged ≥60 years) enrolled in the MACS, receiving tenofovir 27
disoproxil fumarate (TDF) and emtricitabine (FTC) with undetectable viral loads. Median values 28
were based upon the Turnbull estimator, and a log-rank test was used to conduct the cross-29
sectional analysis of IM:EN ratios between age groups. 30
Results: The reported preliminary results suggest numerically increased median TFVdp and 31
FTCtp concentrations within men aged ≥60 years. The TFVdp:dATP ratio was statistically 32
significantly higher in men ≥60 years of age, compared to those ≤45 years of age (0.664 vs. 33
0.294, P=0.0002). No statistically significant difference was found in the FTCtp:dCTP ratio 34
between age groups. 35
Conclusions: The elevated TFVdp:dATP ratio observed in men aged ≥60 years is likely a result 36
of increased inflammation within the older population. The lack of a statistically significant 37
difference in the FTCtp:dCTP ratio between groups may be explained by confounding increased 38
cellular senescence within older men and/or the exclusion of ratios with measured dCTP below 39
the limit of quantification. 40
INTRODUCTION 42
As of 2015, the number of individuals within the United States living with diagnosed 43
HIV infection was nearly 1 million. Among these individuals, the largest percentage was made 44
up of those aged 50-54 years, and the greatest percentage increase in prevalence occurred in 45
those greater than 65 years.(1) As the population infected with HIV continues to age, 46
considerations must be made regarding the effect of aging on the safety and efficacy of 47
antiretroviral (ARV) therapy. Physiologic changes, as a result of aging, that affect the 48
pharmacokinetics of ARV therapy include decreased total body water, decreased albumin, 49
increased adiposity, and reduced hepatic and renal function, together influencing the distribution 50
and clearance of medications.(2) With increasing age also comes an increasing burden of 51
comorbidities, which have been shown to develop up to 10 years sooner in HIV+ individuals 52
than in those without HIV.(3) Further, it has been suggested that the prevalence of frailty is 53
higher in HIV+ men, with increasing age.(4) HIV infection and aging result in similar changes in 54
the immune system, including increased resting activation of T cells and low naïve CD4 cell 55
levels.(5) Together, this suggests that aging plays a major role in the pharmacology of ARV 56
therapy, however little research into this relationship has been conducted. 57
Nucleoside reverse transcriptase inhibitors (NRTIs), used in combination, are often 58
deemed the “backbone” of ARV therapy for the treatment of HIV infection.(6) Upon entry into 59
target cells, NRTIs undergo phosphorylation to the active di- or tri-phosphate form. These 60
intracellular metabolites (IM) inhibit viral replication through competitive binding to the viral 61
reverse transcriptase molecule. IM compete with the corresponding endogenous 62
2’deoxynucleotides (EN) within the cell, terminating the growing DNA chain when 63
tenofovir disoproxil fumarate (TDF) and emtricitabine (FTC). Tenofovir is metabolized to 65
tenofovir diphosphate (TFVdp), which competes with 2’deoxyadenosine triphosphate (dATP).(7) 66
Emtricitabine is metabolized to emtricitabine triphosphate (FTCtp), and competes with 67
2’deoxycytidine triphosphate (dCTP) in the target cells.(8, 9) 68
Given that IM compete with EN for binding of the viral reverse transcriptase molecule, 69
the IM:EN ratio influences the level inhibition of viral reverse transcriptase. When IM:EN ratios 70
are too low within the target cell, the result is reduced efficacy.(10) Too high an IM:EN ratio 71
increases the risk of toxicity in patients, due to a potential for inhibition of host-cell DNA 72
synthesis. Older NRTIs including zalcitabine, didanosine, and stavudine are associated with 73
mitochondrial toxicity as a result of high affinity for and competitive inhibition of mitochondrial 74
DNA polymerase gamma.(11) Depletion of the EN pool with agents such as hydroxyurea as a 75
method to increase NRTI efficacy by increasing the IM:EN ratio was demonstrated to result in 76
dose-limiting toxicities, mainly pancreatitis.(12) 77
Recent work has examined the relationship between age, inflammatory markers, and 78
NRTI pharmacology in The Women’s Interagency HIV Study (WIHS).(13) In that analysis, 79
interleukin-6 (IL-6) and soluble CD163 (sCD163) were included as they have been linked to an 80
increased risk of mortality in HIV+ individuals.(14–17)The current study seeks to further 81
expand upon this previous work by exploring the effect of aging on NRTI pharmacology in 82
HIV+ men within the unique, all-male population of the Multicenter AIDS Cohort Study 83
(MACS). The objectives of the study are to examine the relationship between age and 84
differences in IM:EN ratios and IM concentrations in HIV-infected men treated with TDF/FTC. 85
MATERIALS AND METHODS 87
Study Population: Menenrolled in the MACS with viral load measurements <50 88
copies/mL, who were receiving TDF/FTC as part of their ARV regimen at the time the viral load 89
was recorded and had available stored PBMC pellets (non-viable), were included in the study. 90
Acceptable stored PBMCs were no older than 10 years, with preference given to those 91
corresponding to the last 3 visits. The cross-sectional study was conducted using specimens from 92
men aged ≤45 years or ≥60 years at the time of sample collection. Exclusion criteria included the 93
following: aged 46 to 59 years; reported nonadherence (defined several ways based upon MACS 94
variables on Drug Form 1: MDPRE reported as <75%, MPILI reported as yes, or if ≥2 doses 95
missed in the last 5 days); concomitant treatment with a NRTI other than TDF/FTC; receiving 96
TDF/FTC as part of a research study; and concomitant use of corticosteroids, 97
immunosuppressants, or drugs that alter the EN pool (hydroxyurea, mycophenolate, 98
hydrochlorothiazide, ribavirin, anti-metabolites) during the 30 days prior to sample collection. 99
Due to the potential for drug degradation, stored PBMCs that were not frozen within 24 hours of 100
collection were excluded. When samples from multiple visits were available for a given patient, 101
those corresponding to the earliest visit were used if the individual was ≤45 years and 102
corresponding to the latest visit if the individual was ≥60 years. 103
Measurement of IM and EN in PBMCs: The quantification of TFVdp, FTCtp, dATP, and
104
dCTP within peripheral blood mononuclear cells (PBMCs), at each timepoint, was conducted by 105
the UNC Center for AIDS Research (CFAR) Clinical Pharmacology and Analytical Chemistry 106
(CPAC) Core, using a validated assay.(18) First, a protein precipitation extraction was 107
performed. The samples were then analyzed by LC-MS/MS using anion exchange 108
lower limit of quantification was 0.2 ng/mL for all analytes; concentrations were normalized to 110
the PBMC count in each sample and converted to molar units, allowing calculation of a sample-111
specific limit of quantification when analyte concentrations were below the limits of 112
quantification. 113
Statistical Analysis: Sample size calculations were based on the distributions of 114
TFVdp:dATP and FTCtp:dCTP reported in the study by Dumond et al. entitled, p16INK4a, a 115
Senescence Marker, Influences Tenofovir/Emtricitabine Metabolite Disposition in HIV-Infected 116
Subjects.(19) A sample size of 140 men, with 70 men ≤45 years and 70 men ≥60 years, would be 117
required to provide approximately 83% power for TFVdp:dATP and 90% power for 118
FTCtp:dCTP to detect a geometric mean ratio of ≥1.30 between the age groups. The POWER 119
procedure in SAS 9.3 was used for power calculations. Median values corresponding to the 120
measured dATP, dCTP, FTCtp, and TFVdp concentrations were determined utilizing the 121
Turnbull estimation method. The cross-sectional analysis of IM:EN ratios between age groups 122
was conducted using a log-rank test, in order to account for IM measurements below the limit of 123
quantification. IM:EN ratios in which the EN assay was below the limit of quantification were 124
excluded from the analysis. When the IM concentration was below the limit of quantification, the 125
sample-specific lower limit of quantification was imputed. Medians were based upon the 126
Turnbull estimator, as suggested by Gillespie, et al.(20) Data was analyzed in SAS 9.4 (SAS 127
Institute Inc., Cary, NC). 128
Study Approval: Demographic data and specimens were obtained under the approved 129
MACS concept R18028 and analyzed in accordance with the data use agreement between the 130
MACS Data Coordinating Center at Johns Hopkins University Bloomberg School of Public 131
deemed exempt from human subjects research oversight by the UNC Biomedical Institutional 133
Review Board. 134
135
RESULTS 136
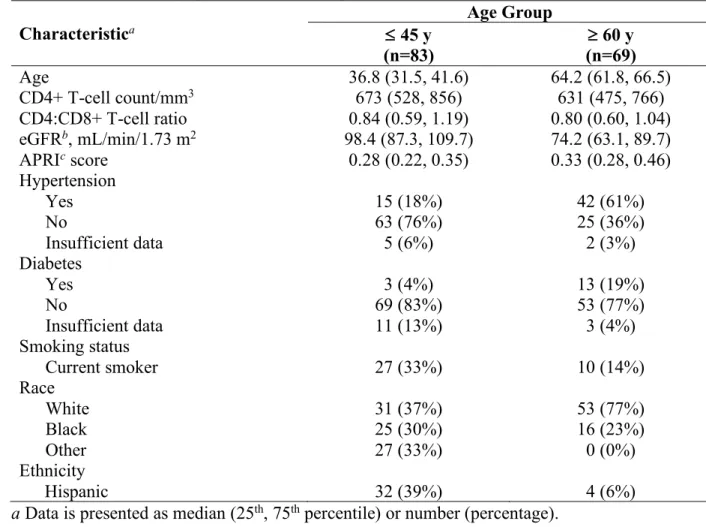
Baseline Characteristics. Samples from 152 unique individuals were obtained for 137
analysis, with 83 samples corresponding to men aged ≤45 years and 69 samples corresponding to 138
men aged ≥60 years (Table 1). Forty-eight men had available PBMC pellets from multiple 139
patient visits; however, only PBMC concentration observations from the earliest visit within the 140
younger group (≤45 years) or latest visit within the older group (≥60 years) were utilized in the 141
analysis. The median age was 36.8 years in the younger group and 64.2 years in the older group. 142
The majority of participants in the older group were white (77%), whereas the younger group 143
included an increased proportion of black (30%) and Hispanic (39%) individuals. Quantitatively, 144
more men within the older group had hypertension (61% vs. 18%) and diabetes (19% vs. 4%). 145
Additionally, the older group included a numerically smaller percentage of current smokers 146
(14% vs. 33%). PBMC concentration observations corresponding to 5 patients (6.0%) in the 147
younger group and 16 patients (23.2%) in the older group were excluded from the TFVdp:dATP 148
analysis due to dATP concentrations below the limit of quantification. Additionally, PBMC 149
concentration observations from 8 patients (9.6%) in the younger group and 16 patients (23.2%) 150
in the older group were excluded from the FTCtp:dCTP analysis, given dCTP measurements 151
below the limit of quantification. 152
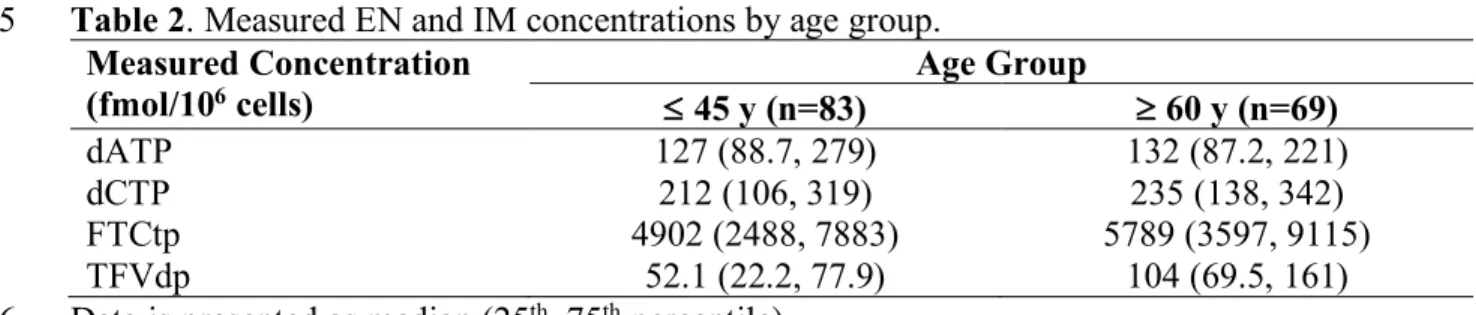
Cross-Sectional Analysis. The measured concentrations of the endogenous nucleotides 153
and the NRTI intracellular metabolites for each age group are displayed in Table 2. Preliminary 154
numerically higher within men ≥60 years of age. The median TFVdp concentration was 52.1 156
fmol/106 cells within the younger group versus 104 fmol/106 cells in the older group. Similarly, 157
the median FTCtp concentration was 4902 fmol/106 cells in men aged ≤45 years, compared to 158
5789 fmol/106 cells in men aged ≥60 years. Differences in endogenous nucleotide concentrations 159
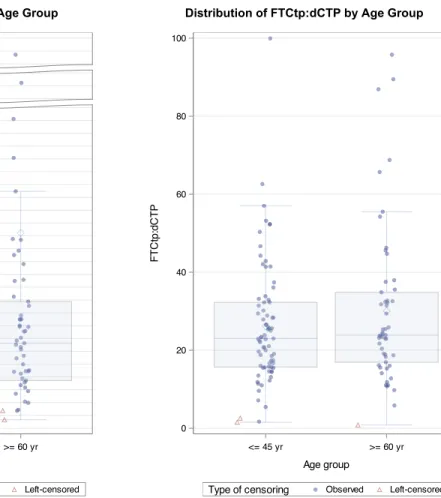
were less pronounced. Table 3 shows the TFVdp:dATP and FTCtp:dCTP ratios between age 160
groups. The TFVdp:dATP ratio was statistically significantly higher in men aged ≥60 years, 161
compared to those aged ≤45 years (0.664 vs. 0.294, P=0.0002). However, there was no 162
statistically significant difference in the FTCtp:dCTP ratio between age groups (23.862 in men 163
≥60 years vs. 23.008 in men ≤45 years, P=0.5179). Distributions of the TFVdp:dATP and 164
FTCtp:dCTP ratios are further displayed in Figure 1. 165
166
DISCUSSION 167
Previous work has examined the relationship between age and TDF and FTC 168
pharmacology in the Women’s Interagency HIV Study (WIHS).(13) Compared to the WIHS 169
cohort, observed baseline CD4+ T-cell counts, CD4+:CD8+ T-cell ratios, eGFR values, and 170
APRI scores were similar within the MACS. Key differences between the cohorts, however, are 171
seen in their racial makeup. The majority of men in both the younger and older groups within the 172
MACS were white (37% and 77%, respectively). Conversely, within the WIHS cohort, the 173
majority of women were black (85% of women ≤45 years of age; 55% of women ≥60years of 174
age). Additionally, while the percentage of younger individuals identified as current smokers was 175
similar between cohorts (33% in the MACS vs. 30% in the WIHS), a greater proportion of older 176
women in the WIHS cohort were reported as current smokers (37% in the WIHS vs. 14% in the 177
Within the WIHS cohort, HIV+ women ≥60years of age were found to have increased 179
TFVdp:dATP and FTCtp:dCTP ratios compared to those ≤45 years of age. Although statistical 180
significance was not maintained within the multivariable regression model that adjusted for 181
various demographic and clinical factors, the directionality of these results were further 182
maintained.(13) Within the MACS cohort of HIV+ men, we similarly found that the 183
TFVdp:dATP ratio was elevated in those men aged ≥60 years, compared to those aged ≤45 184
years. Additionally, a similar trend was seen towards higher TFVdp and FTCtp concentrations 185
within the older group. This may be a result of increased inflammation within the older 186
population, which has been suggested to contribute to an upregulation of the kinases involved in 187
NRTI metabolism.(21)In contrast to the results seen in the WHIS cohort, no statistically 188
significant difference was found between the FTCtp:dCTP ratio corresponding to men ≤45 years 189
of age and those ≥60 years of age.(13) The lack of an observed difference between age groups 190
may, in part, be due to the confounding factor of increased cellular senescence within older men. 191
The tumor suppressor gene, p16INK4a, has been used as a biomarker of T-cell senescence and 192
aging in individuals with HIV.(22) Recent work by Dumond et al. demonstrated that higher 193
p16INK4a expression was associated with lower intracellular exposures of dATP, dCTP, and 194
FTCtp.(23) Expression of p16INK4a was also a significant covariate in the clearance of TFVdp 195
and FTCtp from PBMCs.(19) Therefore, increased cellular senescence within the older group 196
may have mitigated the expected effects of increased inflammation on FTCtp concentrations, 197
subsequently decreasing the FTCtp:dCTP ratio. 198
A limitation of the current analysis is that the sample size of older individuals was 199
slightly lower than the planned sample size of 70 men, based upon power analysis. In addition, 200
high, with a greater proportion within the older group. Measured dATP concentrations were 202
below the limit of quantification in 5 men aged ≤45 years (6%), in contrast to 16 men ≥60 years 203
of age (23.2%). Similarly, measured dCTP concentrations fell below the limit of quantification in 204
8 men ≤45 years of age (9.6%), compared to 16 men aged ≥60 years (23.2%). By excluding the 205
IM:EN ratios that contained an EN concentration below the limit of quantification, the sample 206
sizes of both the older group and younger group were further decreased. Given the 207
disproportionately higher percentage of EN concentrations below the limit of quantification in 208
the older group, it is thought that there may have been a potential systematic issue in how the 209
PBMC pellets were collected or stored. Although excluding TFVdp:dATP ratios with a 210
measured dATP below the limit of quantification limited the sample size of both age groups, 211
there was no observed change in the statistical significance of our findings compared to our 212
analysis including those values. Conversely, excluding from the analysis FTCtp:dCTP ratios 213
with dCTP measurements below the limit of quantification resulted in the loss of a statistically 214
significant difference between age groups. Therefore, more confidence is placed in our 215
TFVdp:dATP ratio results, as they were not sensitive to data exclusion. 216
Of note, the results within this manuscript are preliminary. Given the systematically high 217
number of samples with dATP or dCTP concentrations below the limit of quantification, 218
particularly within the population of men aged ≥60 years, we plan to request a second aliquot to 219
repeat the quantification of TFVdp, FTCtp, dATP, and dCTP. Additionally, a challenge that 220
arose related to the project was that we were unable to obtain samples from the MACS until 221
October of 2019, as a result of delays with the Data Use Agreement. Therefore, results related to 222
the quantification of the inflammation markers, IL-6 and sCD163, within the all-male cohort of 223
also available and will be assessed. These results will be included in the final manuscript to be 225
submitted for publication once available. Importantly, gaining further insight into the 226
inflammatory status of these patients will provide greater insight into potential explanations for 227
our observed IM:EN ratios. Additionally, they will allow for a more robust comparison of our 228
results to those observed within the all-female cohort of the WIHS. It has been suggested that, 229
following ARV initiation, women maintain higher levels of inflammatory biomarkers compared 230
to men.(24) Interestingly, in the WIHS, younger women were not found to have substantially 231
lower cytokine concentrations, in contrast to what was initially hypothesized. Further, TFVdp 232
was found to be negatively associated with sCD163 and IL-6 concentrations in younger 233
women.(13) Whether these results are replicated within the all-male cohort of the MACS is left 234
to be determined. By furthering our knowledge of the effect of aging on NRTI pharmacology 235
within HIV+ patients, we can gain insight into how ARV therapy may be adjusted with 236
increasing age to ultimately increase efficacy and decrease toxicity. 237
REFERENCES 239
1. Hess K, Johnson AS, Hu X, Li J, Wu B, Yu C, Zhu H, Jin C, Chen M, Gerstle J, Morgan 240
M, Friend M, Siddiqi A, Hernandez A. 2016. Diagnoses of HIV Infection in the United 241
States and Dependent Areas, 2016. HIV Surveill Rep 2. 242
2. Schoen JC, Erlandson KM, Anderson PL. 2013. Clinical pharmacokinetics of 243
antiretroviral drugs in older persons. Expert Opin Drug Metab Toxicol 9:573–588. 244
3. Guaraldi G, Orlando G, Zona S, Menozzi M, Carli F, Garlassi E, Berti A, Rossi E, 245
Roverato A, Palella F. 2011. Premature age-related comorbidities among HIV-infected 246
persons compared with the general population. Clin Infect Dis 53:1120–1126. 247
4. Althoff KN, Jacobson LP, Cranston RD, Detels R, Phair JP, Li X, Margolick JB, 248
Multicenter AIDS Cohort Study (MACS) for the MACS. 2014. Age, comorbidities, and 249
AIDS predict a frailty phenotype in men who have sex with men. J Gerontol A Biol Sci 250
Med Sci 69:189–98. 251
5. Effros RB, Fletcher C V, Gebo K, Halter JB, Hazzard WR, Horne FM, Huebner RE, 252
Janoff EN, Justice AC, Kuritzkes D, Nayfield SG, Plaeger SF, Schmader KE, Ashworth 253
JR, Campanelli C, Clayton CP, Rada B, Woolard NF, High KP. 2008. Aging and 254
infectious diseases: workshop on HIV infection and aging: what is known and future 255
research directions. Clin Infect Dis 47:542–53. 256
6. Günthard HF, Saag MS, Benson CA, del Rio C, Eron JJ, Gallant JE, Hoy JF, Mugavero 257
MJ, Sax PE, Thompson MA, Gandhi RT, Landovitz RJ, Smith DM, Jacobsen DM, 258
Volberding PA. 2016. Antiretroviral Drugs for Treatment and Prevention of HIV Infection 259
in Adults. Jama 316:191. 260
Pharmacokinet 43:595–612. 262
8. Anderson PL, Kiser JJ, Gardner EM, Rower JE, Meditz A, Grant RM. 2011. 263
Pharmacological considerations for tenofovir and emtricitabine to prevent HIV infection. J 264
Antimicrob Chemother 66:240–250. 265
9. Anderson PL, Kakuda TN, Lichtenstein KA. 2004. The Cellular Pharmacology of 266
Nucleoside- and Nucleotide-Analogue Reverse-Transcriptase Inhibitors and Its 267
Relationship to Clinical Toxicities. Clin Infect Dis 38:743–753. 268
10. Garcia-Lerma JG, Aung W, Cong M -e., Zheng Q, Youngpairoj AS, Mitchell J, Holder A, 269
Martin A, Kuklenyik S, Luo W, Lin CY-C, Hanson DL, Kersh E, Pau C-P, Ray AS, 270
Rooney JF, Lee WA, Heneine W. 2011. Natural Substrate Concentrations Can Modulate 271
the Prophylactic Efficacy of Nucleotide HIV Reverse Transcriptase Inhibitors. J Virol 272
85:6610–6617. 273
11. Moyle G. 2005. Mechanisms of HIV and nucleoside reverse transcriptase inhibitor injury 274
to mitochondria. Antivir Ther 10 Suppl 2:M47-52. 275
12. Havlir D V, Gilbert PB, Bennett K, Collier AC, Hirsch MS, Tebas P, Adams EM, Wheat 276
LJ, Goodwin D, Schnittman S, Holohan MK, Richman DD, ACTG 5025 Study Group. 277
2001. Effects of treatment intensification with hydroxyurea in HIV-infected patients with 278
virologic suppression. AIDS 15:1379–88. 279
13. Dumond JB, Bay C, Nelson JA, Sykes C, Anastos K, Sharma R, Kassaye S, Villacres M, 280
Greenblatt R, French A, Gange SJ, Ofotokun I, Fischl M, Vance D, Adimora A. Higher 281
NRTI metabolite:endogenous nucleotide ratios in older HIV+ women on 282
TDF/FTCConference on Retroviruses and Opportunistic Infections. Boston, MA. 283
PY. 2016. Plasma IL-6 levels are independently associated with atherosclerosis and 285
mortality in HIV-infected individuals on suppressive antiretroviral therapy. AIDS 286
30:2065–2074. 287
15. French MA, Cozzi-Lepri A, Arduino RC, Johnson M, Achhra AC, Landay A. 2015. 288
Plasma levels of cytokines and chemokines and the risk of mortality in HIV-infected 289
individuals: A case-control analysis nested in a large clinical trial. Aids 29:847–851. 290
16. McDonald B, Moyo S, Gabaitiri L, Gaseitsiwe S, Bussmann H, Koethe JR, Musonda R, 291
Makhema J, Novitsky V, Marlink RG, Wester CW, Essex M. 2013. Persistently Elevated 292
Serum Interleukin-6 Predicts Mortality Among Adults Receiving Combination 293
Antiretroviral Therapy in Botswana: Results from a Clinical Trial. AIDS Res Hum 294
Retroviruses 29:993–999. 295
17. Knudsen TB, Ertner G, Petersen J, Møller HJ, Moestrup SK, Eugen-Olsen J, Kronborg G, 296
Benfield T. 2016. Plasma Soluble CD163 Level Independently Predicts All-Cause 297
Mortality in HIV-1-Infected Individuals. J Infect Dis 214:1198–204. 298
18. Dumond J, Adams J, Prince H, Kendrick R, Wang R, Jennings S, Malone S, White N, 299
Sykes C, Corbett A, Patterson K, Forrest A, Kashuba A. 2013. Pharmacokinetics of two 300
common antiretroviral regimens in older HIV-infected patients: a pilot study. HIV Med 301
14:401–409. 302
19. Dumond J, Collins J, Cottrell M, Trezza C, Prince H, Sykes C, Torrice C, White N, 303
Malone S, Wang R, Patterson K, Sharpless N, Forrest A. 2017. p16 INK4a , a Senescence 304
Marker, Influences Tenofovir/ Emtricitabine Metabolite Disposition in HIV-Infected 305
Subjects. CPT Pharmacometrics Syst Pharmacol 6:120–127. 306
Demond A, Luksemburg W, Garabrant DH. 2010. Estimating population distributions 308
when some data are below a limit of detection by using a reverse kaplan-meier estimator. 309
Epidemiology 21. 310
21. Hoggard PG, Lloyd J, Khoo SH, Barry MG, Dann L, Gibbons SE, Wilkins EG, Loveday 311
C, Back DJ. 2001. Zidovudine Phosphorylation Determined Sequentially over 12 Months 312
in Human Immunodeficiency Virus-Infected Patients with or without Previous Exposure 313
to Antiretroviral Agents. Antimicrob Agents Chemother 45:976–980. 314
22. Nelson JAE, Krishnamurthy J, Menezes P, Liu Y, Hudgens MG, Sharpless NE, Eron JJ. 315
2012. Expression of p16(INK4a) as a biomarker of T-cell aging in HIV-infected patients 316
prior to and during antiretroviral therapy. Aging Cell 11:916–8. 317
23. Dumond JB, Francis O, Cottrell M, Trezza C, Prince HMA, Mollan K, Sykes C, Torrice 318
C, White N, Malone S, Wang R, Dam C Van, Patterson KB, Hudgens MG, Sharpless NE, 319
Forrest A. Tenofovir/Emtricitabine Metabolites and Endogenous Nucleotide Exposures 320
are Associated with p16 INK4a Expression in Subjects on Combination Therapy HHS 321
Public Access. AIDS Poster Antivir Ther 34:441–445. 322
24. Mathad JS, Gupte N, Balagopal A, Asmuth D, Hakim J, Santos B, Riviere C, 323
Hosseinipour M, Sugandhavesa P, Infante R, Pillay S, Cardoso SW, Mwelase N, Pawar J, 324
Berendes S, Kumarasamy N, Andrade BB, Campbell TB, Currier JS, Cohn SE, Gupta A. 325
2016. Sex-Related Differences in Inflammatory and Immune Activation Markers Before 326
and After Combined Antiretroviral Therapy Initiation. JAIDS J Acquir Immune Defic 327
Syndr 73:123–129. 328
Table 1. Patient demographics at time of sample collection. 330
Characteristica
Age Group £ 45 y
(n=83) (n=69) ³ 60 y
Age 36.8 (31.5, 41.6) 64.2 (61.8, 66.5)
CD4+ T-cell count/mm3 673 (528, 856) 631 (475, 766)
CD4:CD8+ T-cell ratio 0.84 (0.59, 1.19) 0.80 (0.60, 1.04) eGFRb, mL/min/1.73 m2 98.4 (87.3, 109.7) 74.2 (63.1, 89.7)
APRIc score 0.28 (0.22, 0.35) 0.33 (0.28, 0.46)
Hypertension
Yes 15 (18%) 42 (61%)
No 63 (76%) 25 (36%)
Insufficient data 5 (6%) 2 (3%)
Diabetes
Yes 3 (4%) 13 (19%)
No 69 (83%) 53 (77%)
Insufficient data 11 (13%) 3 (4%)
Smoking status
Current smoker 27 (33%) 10 (14%)
Race
White 31 (37%) 53 (77%)
Black 25 (30%) 16 (23%)
Other 27 (33%) 0 (0%)
Ethnicity
Hispanic 32 (39%) 4 (6%)
a Data is presented as median (25th, 75th percentile) or number (percentage). 331
b eGFR: estimated glomerular filtration rate, as calculated by the CKD-EPI equation. 332
c APRI: AST-to-platelet ratio index. 333
Table 2. Measured EN and IM concentrations by age group. 335
Measured Concentration
(fmol/106 cells) £ 45 y (n=83) Age Group ³ 60 y (n=69)
dATP 127 (88.7, 279) 132 (87.2, 221)
dCTP 212 (106, 319) 235 (138, 342)
FTCtp 4902 (2488, 7883) 5789 (3597, 9115)
TFVdp 52.1 (22.2, 77.9) 104 (69.5, 161)
Data is presented as median (25th, 75th percentile). 336
Table 3. IM:EN ratios by age group. 338
IM:EN Ratioa Age Group P-value
≤ 45 y ≥ 60 y
TFVdp:dATP ratio 0.294 (0.150, 0.631)b 0.664 (0.373, 1.148)c 0.0002
FTCtp:dCTP ratio 23.008 (15.787, 32.911)d 23.862 (18.702, 46.270)c 0.5179 a Data is presented as median (25th, 75th percentile).
339
b Data is from 78 patients. 340
c Data is from 53 patients. 341
d Data is from 75 patients. 342
344
Figure 1. Distributions of IM:EN ratios by age group. Observed (non-censored) and left-345
censored IM:EN ratios are displayed, corresponding to men ≤45 years and men ³60 years. Left-346
censored values represent those ratios in which the measured TFVdp or FTCtp concentration was 347
below the limit of quantification. 348 0.0 0.2 0.4 0.6 0.8 1.0 1.2 1.4 1.6 1.8 2.0 2.2 2.4 6.2 6.4 37.1 T F V d p :d A T P
<= 45 yr >= 60 yr Age group
Left-censored Observed
Type of censoring
Distribution of TFVdp:dATP in two age groups (no right-censoring)
Created by: macs_aim1_con.sas run on 28FEB20 at 14:06 Distribution of TFVdp:dATP by Age Group
0 20 40 60 80 100 F T C tp :d C T P
<= 45 yr >= 60 yr
Age group
Left-censored Observed
Type of censoring
Distribution of FTCtp:dCTP in two age groups (no right-censoring)
Created by: macs_aim1_con.sas run on 28FEB20 at 14:06
ADDENDUM 349
Acknowledgements. The authors wish to thank Dr. Angela Kashuba, who provided oversight of 350
the drug concentration analysis within the UNC CFAR CPAC Laboratory. We wish to thank Dr. 351
Craig Lee for his continued support and valuable feedback throughout the RASP program. We 352
wish to thank Ms. Catalina Ramirez and Dr. Andrew Edmonds at the UNC WIHS for their 353
assistance interfacing with the MACS. Data in this manuscript were collected by the Multicenter 354
AIDS Cohort Study (MACS). MACS (Principal Investigators): Johns Hopkins University 355
Bloomberg School of Public Health (Joseph Margolick, Todd Brown), U01-AI35042; 356
Northwestern University (Steven Wolinsky), U01-AI35039; University of California, Los 357
Angeles (Roger Detels, Otoniel Martinez-Maza, Otto Yang), U01-AI35040; University of 358
Pittsburgh (Charles Rinaldo, Lawrence Kingsley, Jeremy Martinson), U01-AI35041; the Center 359
for Analysis and Management of MACS, Johns Hopkins University Bloomberg School of Public 360
Health (Lisa Jacobson, Gypsyamber D'Souza), UM1-AI35043. The MACS is funded primarily 361
by the National Institute of Allergy and Infectious Diseases (NIAID), with additional co-funding 362
from the National Cancer Institute (NCI), the National Institute on Drug Abuse (NIDA), and the 363
National Institute of Mental Health (NIMH). Targeted supplemental funding for specific projects 364
was also provided by the National Heart, Lung, and Blood Institute (NHLBI), and the National 365
Institute on Deafness and Communication Disorders (NIDCD). MACS data collection is also 366
supported by UL1-TR001079 (JHU ICTR) from the National Center for Advancing 367
Translational Sciences (NCATS) a component of the National Institutes of Health (NIH), and 368
NIH Roadmap for Medical Research. The contents of this publication are solely the 369
Health (NIH), Johns Hopkins ICTR, or NCATS. The MACS website is located 371
at http://aidscohortstudy.org/. 372
Funding Support. The current study was supported by 1R21AG063660-01A1 to JB Dumond. 373