Setting the Scale:
Photometric and Dynamical
Properties of High-Redshift
Setting the Scale:
Photometric and Dynamical
Properties of High-Redshift
Early-Type Galaxies
Proefschrift
ter verkrijging van
de graad van Doctor aan de Universiteit Leiden, op gezag van de Rector Magnificus Dr. D. D. Breimer,
hoogleraar in de faculteit der Wiskunde en Natuurwetenschappen en die der Geneeskunde,
volgens besluit van het College voor Promoties te verdedigen op donderdag 29 september 2005
te klokke 16.15 uur
door
Arjen van der Wel
Promotores: Prof. dr. M. Franx
Prof. dr. P. G. van Dokkum (Yale University)
Referent: Dr. S. Trager (Rijksuniversiteit Groningen)
Inti Pelupessy
NASA,ESA, S. Beckwith (STScI) and theHUDFTeam
Contents
1 Introduction 1
1.1 Early-Type Galaxies . . . 1
1.2 Galaxy Formation in a Cosmological Framework . . . 2
1.3 Masses of High-Redshift Galaxies . . . 3
1.4 This Thesis . . . 5
2 The cluster FP atz= 1.25 11 2.1 Introduction . . . 12
2.2 RDCS 1252.9-2927 Fundamental Plane Data . . . 12
2.3 The Fundamental Plane atz¯= 1.25 . . . 15
2.4 Implications for the Evolution of Early-type Cluster Galaxies . . . 17
3 The FP of Field Early Type Galaxies atz= 1 21 3.1 Introduction . . . 22
3.2 Spectroscopy . . . 22
3.3 Photometry . . . 24
3.4 Mass-to-Light Ratios from the FP . . . 26
3.5 Discussion . . . 26
4 M/Lof Field Early-Type Galaxies atz∼1 29 4.1 Introduction . . . 31
4.2 Spectroscopy . . . 32
4.3 Photometry . . . 43
4.4 Masses, Mass-to-Light Ratios and Stellar Populations . . . 47
4.5 Comparison with previous results . . . 58
4.6 Conclusions . . . 61
5 The Evolution of the CMR of Field Galaxies 65 5.1 Introduction . . . 66
5.2 Constructing the Early-Type Galaxy Sample . . . 67
5.3 The High-Redshift Color-Magnitude Relation . . . 69
5.4 Implications for the Evolution of the FP . . . 70
6 K-band evolution of early-type galaxies 75
6.1 Introduction . . . 76
6.2 IRAC photometry of early-type galaxies atz∼1 . . . 77
6.3 Evolution ofM/LK . . . 78
6.4 Discussion . . . 80
7 Uncertainties in Photometric Galaxy Masses 85 7.1 Introduction . . . 87
7.2 Dynamical Masses of Early-Type Galaxies . . . 89
7.3 Derivation of Stellar Masses from Photometry . . . 89
7.4 Systematic and Random Uncertainties . . . 95
7.5 Summary and Discussion . . . 102
Samenvatting 107
Curriculum Vitae 115
Chapter 1
Introduction
1.1
Early-Type Galaxies
Galaxies are referred to as the building blocks of the universe. They are broadly divided into two different types. Late-type galaxies, a class to which also the Milky Way belongs. are visually dominated by an exponential disk of stars and gas with spiral arms. Spiral arms appear in different degrees of prominence. The bulge at the center, a roundish and smooth distribution of stars that are on average older than the stars in the disk, is a minor component compared to the disk. Early-type galaxies are dominated by a smooth and ellipsoidal distribution of stars with little gas and dust. In complete absence of a disk, such galaxies are called ellipticals. If a faint disk is present, they are qualified as lenticulars. Late-type galaxies greatly outnumber early-type galaxies, but the latter are on average brighter and more massive than the former: 50%−75%of all the stars are thought to reside in early-type galaxies (e.g., Bell et al., 2003). Other sub-classes are irregular and peculiar galaxies. The former are generally small galaxies; the latter are mostly mergers. These contribute less to the stellar mass in the universe.
Between the 1920s and the 1940s, astronomers realized that the Milky Way con-sists of different stellar components, distinguished, for example, by their metal-content and spatial distribution. These results and their interpretation culminated in a paper by Eggen, Lynden-Bell & Sandage (1962). They suggest that one component (the metal-poor stars that are found in the bulge and the halo) has formed long ago (∼10 billion years) in a quickly radially collapsing gas cloud. The second component (the metal-rich stars that are found in the disk) would be formed later, and on longer time scales, by accretion of gas onto a disk. This idea is still alive, Eggen’s paper being cited on average more than four times per week over the past decade.
Between the 1960s and 1980s it was discovered that there are strong relations with small scatter between a broad range of photometric and spectroscopic parame-ters of early-type galaxies. This started with Minkowski (1962) who found a relation between velocity dispersion and luminosity. This work was extended by Faber & Jack-son (1976), which turned out to be the basis of the discovery of the fundamental plane (FP, Djorgovski & Davis, 1987; Dressler et al., 1987) wherein the three parameters of size, surface brightness and central velocity dispersion are narrowly correlated.
The relation between the strength of the Mg2-line and velocity dispersion (Burstein
et al., 1987) and the color-magnitude-relation (Sandage & Visvanathan, 1978; Bower, Lucy & Ellis, 1992) suggest that the physical parameters of early-type galaxies, such as their mass, are related to their stellar populations.
One would think that taking together the ideas of Eggen et al. and scaling relations like the FP can provide a relatively simple and physical theory for the formation of galaxies. However, nothing is ever as easy as it seems.
1.2
Galaxy Formation in a Cosmological Framework
The description of galaxy formation becomes far more complicated if one realizes that a galaxy is not an isolated island universe. Galaxies are parts of groups, clusters, and super-clusters, and their properties correlate with the environment they live in. Late-type galaxies prefer regions where the galaxy density is low, whereas early-type galaxies prefer denser areas, i.e., the centers of clusters (see also Dressler, 1980). The existence of peculiar galaxies, and the lack of spiral galaxies in dense environments, led to the idea that spirals merge into ellipticals (Toomre & Toomre, 1972). In terms of assembly time, early-type galaxies are younger than late-type galaxies, not older as their stellar populations suggest.
The answer to the question how galaxies were formed and how the environment affects this process is thus clearly linked to the question how large-scale structure, i.e., clusters and super-clusters, was formed. The cosmological models that are used to describe the emergence of large-scale structure (pioneered by Press & Schechter, 1974) are used as a framework to describe the formation of stars and galaxies out of collapsing gas clouds (first implemented by White & Rees, 1978). Smaller building blocks are formed first, which subsequently merge into progressively larger galaxies and clusters. Merging is therefore a self-evident feature of these models.
The main reason for the popularity of this model for galaxy formation is that it successfully explains large-scale structure in the universe. The prediction of the levels and scales of clustering only depends on the cosmological model and gravity. Given the predictive power of a wide range of observational properties of large-scale structure, and the small number of parameters, this model is believable.
1.3. MASSES OF HIGH-REDSHIFT GALAXIES 3
Using the currently available telescopes and instruments it is possible to constrain the evolution of galaxies. Studying relatively nearby galaxies alone is not sufficient, because this only provides a snapshot of the universe at its current age of∼13.7 bil-lion years. In order to construct a picture that describes the temporal evolution of the galaxy population throughout the history of the universe, galaxies over a wide range of cosmological distances, i.e., redshifts, should be studied, making use of billions of years of look-back time. The direct measurement of the evolution of the galaxy population provides strong constraints on the formation models.
1.3
Masses of High-Redshift Galaxies
The question to be answered in order to obtain an observationally driven picture of the formation and evolution of galaxies may be summarized as follows:
How do the numbers of different types of galaxies and their stellar populations change with redshift?
The trick is to interpret the light of distant galaxies and infer their physical prop-erties. Only then can local galaxies be quantitatively compared with distant galaxies. The most basic properties of a galaxy are its mass, size, luminosity, and morphology. The latter three are relatively easy to infer from imaging; mass requires a little more work.
In principle, if one knows of each of the∼100billion stars in a galaxy where it is and how fast it moves in what direction, one can precisely infer the gravitational potential, and thus the mass of the galaxy. In practice, one can study with integral field spectroscopy how the dynamical structure varies over the projected surface of the galaxy and then infer a model of the potential (e.g., de Zeeuw et al., 2002).
Such methods, requiring high signal-to-noise observations at high spatial resolu-tion, can generally only be used for relatively nearby galaxies. For distant galaxies, which are mostly too small and faint, this cannot be done, and one can only infer the overall velocity dispersion,σ. It can be obtained by measuring the width of absorp-tion lines originating in the atmospheres of stars. The second basic parameter that carries information about the mass of a galaxy is its size. The virial theorem implies that the mass of a galaxy,M, is proportional torσ2.
By comparing the masses, color, and luminosities of local and distant galaxies, an evolutionary picture can be constructed. Specifically for early-type galaxies, a quan-titative measurement of their luminosity evolution and the ages of their stellar pop-ulations can be done. This tool is provided by the FP. Jørgensen, Franx & Kjærgaard (1996) found that for cluster early-type galaxies the FP is described by
reff,B∝σc1.2Ieff0.83,B,
wherereff,B is the effective radius measured in theB-band,σcis the central velocity
dispersion, andIeff,B is theB-band surface brightness at the effective radius. The FP
is very narrow, i.e., the scatter is very small (less than10%inreff,B).
Since the luminosity, L, of a galaxy is proportional toIr2, re-ordering the above
early-type galaxies:
M/LB∝M0.28.
The mass-to-light ratio, M/L, is the holy grail for observing high-redshift galaxies, because it tells you how to convert the detected light into mass.
The FP can be used as a powerful tool to directly measure the evolution ofM/L with redshift. Because early-type galaxies consist of very old stellar populations, it is reasonable to assume that their stellar populations have been evolving passively over many billions of years. This implies fading of galaxies with time. By measuring the three FP quantities of high-redshift galaxies, the offset from the local FP is inferred which is purely due to luminosity evolution: the mass of the galaxy does not change. Hence, the evolution ofM/Lwith redshift is directly measured with good accuracy because of the small scatter in the FP. Since the rate ofM/L-evolution is linked to the age of a stellar population, the formation epoch can be constrained.
This method was proposed by Franx (1993) and has been applied successfully over the past decade. The spectroscopic observations needed to measureσ are very hard to obtain: they demand the use of the largest telescopes in the world, and then still many hours of integration are needed to obtain spectra with the necessary signal-to-noise ratios.
The maximum redshift for galaxies in clusters with dynamically measured masses has been increasing steadily fromz = 0.6(van Dokkum & Franx, 1996) toz = 1.27 (van Dokkum & Stanford, 2003). These results have shown that massive cluster early-type galaxies have become fainter by about 1 magnitude in theB-band betweenz= 1 and the present, which implies that their stars must have formed at redshifts well beyondz = 2. This is consistent with the old stellar populations of large local early-types.
One caveat, however, is that the early-type galaxy population at z ∼1might be only a sub-component of the local early-type galaxy population, due to morphological evolution and/or the formation of new galaxies. This causes us to overestimate the formation redshift of the local early-type galaxy population. This concept called ’pro-genitor bias’, inspired by the observation that even today spiral galaxies merge into elliptical galaxies, was modeled by van Dokkum & Franx (2001). They show that, even taking a maximum bias into account, the formation redshift of early-type cluster galaxies is stillz∼2.
One important prediction made by galaxy formation models is that early-type galaxies in low-density environments (referred to as field galaxies) have younger stel-lar populations than early-type galaxies in high-density environments (e.g., Diaferio et al., 2001). Several groups have measured the M/L-evolution of field early-type galaxies, which, if the model prediction is correct, should be faster than the M/L-evolution of cluster galaxies.
1.4. THIS THESIS 5
The question remained unanswered so far because the required observations are so hard to obtain. The first of the two main questions addressed in this thesis is: Are field early-type galaxies younger than cluster early-type galaxies? The mystery of the field galaxies is the topic of Chapters 2 through 5, where we describe the acquisition of uniquely deep spectra, solving the controversy.
The second main question relates to the first through theM/L. Measuringσ can only be done up toz = 1.3with the current instruments, and for a limited number of objects. To construct a picture of the high-redshift galaxy population as a whole, and to determine galaxy masses at redshifts higher than z = 1.3, alternative mass estimators have to be used.
Evolutionary models for stellar populations, predicting their luminosities, colors, andM/L(e.g., Vazdekis et al., 1996; Bruzual & Charlot, 2003) are used to convert galaxy colors intoM/L. However, the relation between color andM/Ldepends on many parameters, such as the shape of the stellar mass-function, metal- and dust-content, and star-formation history.
Furthermore, models differ in their predictions, even for the same set of parame-ters. Hence, the conversion of color intoM/Lsuffers from systematic uncertainties, and needs to be calibrated by dynamical measurements at high redshift, which are provided in Chapter 4.
The advance of theSpitzer Space Telescope (SST) allows to easily measure near-infrared luminosities of distant galaxies. The near-infrared is less attenuated by dust than the UV and optical. Furtermore, it is generally assumed that the infrared luminosity of a galaxy is more representative of its stellar mass than its UV or optical luminosity. Therefore, SST imaging of high-redshift galaxies is anticipated to play an important role in estimating their stellar masses. The robustness of mass estimates based on near-infrared properties of galaxies are addressed in Chapters 6 and 7.
Thus, the second main question addressed in this thesis is: How accurately can stellar masses of high-redshift galaxies be inferred from their colors?
1.4
This Thesis
Chapter 2
In this Chapter we describe the measurement of M/L of 4 early-type galaxies in the RDCS 1252.9-2927 cluster at z = 1.24. We use deep Hubble Space Telescope (HST) imaging to measure reff, and Ieff and spectra from the Very Large Telescope
(VLT) to determineσ. The spectra have integration times of 24 hours, which yields unprecedentedly deep spectra. In Figure 1.1 I show a beautiful example.
All four galaxies are massive: M >1011M
. We combine this sample with 3 galax-ies in the RDCS 0848+4453 cluster atz = 1.27with measuredM/L(van Dokkum & Stanford, 2003) The offset of the local FP shows that the luminosity evolution in the rest-frameB-band is∼1 magfor galaxies withM >3×10¹¹M
Figure 1.1:Example of a VLT spectrum of a cluster early-type galaxy atz= 1.24. The integra-tion time is∼24hours, resulting in an unprecedented data quality, revealing many absorption features characteristic of an evolved stellar population.
Chapters 3 and 4
In these chapters we describe and analyze the FP of high-redshift field galaxies. Chap-ter 3 contains pilot-results, based on a sub-sample of 6 galaxies that were observed earliest, in 2002. In Chapter 4 we describe the entire sample of 27 field early-type galaxies, observed in 2002 and 2003. Here we address the question whether or not field galaxies are younger than cluster galaxies.
We have obtained very deep spectra from the VLT (with integration times of typi-cally∼12hours) for 27 field early-types that were selected by color and morphology. HST imaging is used to measure effective radii and surface brightnesses. This sample removes the difference in data quality between the older field and cluster samples.
The offset of this field sample from the local FP implies fading in theB-band by almost 2 magnitudes betweenz = 1 and the present. This is much more than for cluster galaxies (see Chapter 2). There is a large spread in M/L. This spread is proved to be real and due to differences among the stellar populations of the galaxies by a strong correlation betweenM/Land color.
Furthermore, the amount of evolution in M/L correlates with galaxy mass. If we only consider galaxies more massive than M >2×10¹¹M
, we find slow evo-lution (1.3 magnitudes), which is similar to what is found for cluster galaxies in the same mass range (1.2 magnitudes). Answering the first question posed in this thesis, we conclude that massive field and cluster galaxies do not have very different ages. The similarity of massive field and cluster galaxies is at odds with the model predictions.
We demonstrate that the observed mass-dependent evolution ofM/LBis partially
1.4. THIS THESIS 7
more so than large-scale environment.
We demonstrate that the controversy in the literature so far is largely caused by the differences between the methods used to calculate the evolution, but are also due to the small samples, low redshifts, and poor data quality.
Finally, five of the early-type galaxies in our sample have AGN. There is tenta-tive evidence that the stellar populations in these galaxies are younger than those of galaxies without AGN.
Chapter 5
In this chapter we measure the evolution of the color-magnitude relation (CMR) of field galaxies. Together with the relation betweenM/Land color, discovered in Chap-ter 4, this puts a constraint the intrinsic mass-dependence of the evolution ofM/L, also discovered in Chapter 4.
We compile from the literature 270 redshifts of galaxies in the range 0.55< z < 1.15. Quantitative morphological classifications are derived from HST imaging. This allows us to compare the zero-point, slope, and scatter of the high-z CMR with the local CMR. We find no significant evolution of the slope and the scatter, whereas the zero-point inB−I becomes bluer by0.44magnitudes fromz = 0toz = 1. These results are very similar to the results of cluster galaxies.
Because of the empirical relation between dynamically determinedM/Land color of early-type galaxies atz∼1, the absent or slow evolution of the slope of the CMR suggests that the tilt of the FP also evolves at most slowly. The observed steep relation betweenM andM/Latz ∼1, found by FP studies, is therefore most likely mainly caused by selection effects, and not intrinsic.
Furthermore, due to this bias, the true evolution of M/LB may be 30−40%
slower than observed. The scatter in the relation between color and M/L is the main source of uncertainty in this analysis. Dynamical mass measurements of low-luminosity early-type galaxies are required to quantitatively measure the tilt of the FP atz= 1.
Chapter 6
In this chapter we measure the evolution of the rest-frameK-band FP fromz= 1to the present. SST imaging is used to measureM/LKfor our sample ofz∼1early-type
galaxies.
We find that M/LK evolves by 1.3 magnitudes between z = 1 and the present,
and a similar dependence on galaxy mass asM/LB. This is somewhat slower than the
evolution in theB-band of the same sample (1.6 magnitudes), agreeing qualitatively with stellar population models. Various models, however, differ significantly in their prediction of the evolution ofM/LK compared toM/LB. Contrary to the Maraston
(2004) stellar population model, the Bruzual & Charlot (2003) model does not fit well to our results unless the IMF is assumed to be top-heavy.
Chapter 7
We compare dynamical masses of samples of distant (z ∼ 1) and local early-type galaxies with stellar masses inferred from their broadband spectral energy distribu-tions (SEDs), ranging from the rest-frame UV to the rest-frame near-infrared.
We find that the relation between dynamical mass and inferred stellar mass has significant scatter and a zero-point which is highly model-dependent. Furthermore, if including the rest-frame infrared in the fits, the zero-point of the relation is generally different for galaxies at different redshifts.
In particular, “standard” Bruzual & Charlot (2003) models imply larger stellar masses for the distant galaxies relative to the stellar masses of the local galaxies. The discrepancy is as large as a factor of∼ 2−3for models with Solar metallicity and a Salpeter IMF. If using the Maraston (2004) stellar population model with the same parameters, we find no such discrepancy.
If the rest-frame near-infrared is excluded from the fits, the systematic difference between the zero-points of high- and low-redshift galaxy masses is close to zero for all models. This implies that the bias and systematic uncertainties originate in the near-infrared. We also show that including the rest-frame UV and allowing the star-formation history and dust content to vary as free parameters do not change the photometric mass estimates significantly.
Our results have far-reaching implications: determinations of the evolution of the stellar mass-density based on the Bruzual-Charlot model and rest-frame near-infrared photometry will underestimate the real evolution, and the systematic uncertainty is of the same order (a factor of&2) as the evolution of the mass-density fromz= 1to the present.
Answering the second main question posed in this thesis,we conclude that mass estimates based on near-infrared are systematically uncertain at the level of a factor of 3; optical colors provide a more accurate estimate.
References
Bell, E. F., McIntosh, D. H., Katz, N., & Weinberg, M. D. 2003, ApJS149, 289 Bower, R. G., Lucey, J. R., & Ellis, R. S. 1992, MNRAS254, 601
Bruzual, G. & Charlot, S. 2003, MNRAS344, 1000
Burstein, D., Davies, R. L., Dressler, A., Faber, S. M., Stone, R. P. S., Lynden-Bell, D., Terlevich, R. J., & Wegner, G. 1987, ApJS64, 601
de Zeeuw, P. T. et al. 2002, MNRAS329, 513
Diaferio, A., Kauffmann, G., Balogh, M. L., White, S. D. M., Schade, D., & Ellingson, E. 2001, MNRAS323, 999
Djorgovski, S. & Davis, M. 1987, ApJ313, 59 Dressler, A. 1980, ApJ236, 351
Dressler, A., Lynden-Bell, D., Burstein, D., Davies, R. L., Faber, S. M., Terlevich, R., & Wegner, G. 1987, ApJ313, 42
REFERENCES 9
Franx, M. 1993, PASP105, 1058 Gebhardt, K. et al. 2003, ApJ597, 239 Hubble, E. P. 1930,ApJ71, 231
Jørgensen, I., Franx, M., & Kjærgaard, P. 1996, MNRAS280, 167 Kochanek, C. S. et al. 2000,ApJ543, 131
Maraston, C. 2004, MNRASsubmitted, astro-ph/0410207
Minkowski, R. 1962, inIAU Symp. 15: Problems of Extra-Galactic Research, p.112 Perlmutter, S. et al. 1999, ApJ517, 565
Press, W. H. & Schechter, P. 1974, ApJ187, 425 Riess, A. G. et al. 1998, AJ116, 1009
Rosati, P. et al. 2004, AJ127, 230 Rusin, D. et al. 2003, ApJ587, 143
Sandage, A. & Visvanathan, N. 1978, ApJ223, 707 Spergel, D. N. et al. 2003, ApJS148, 175
Toomre, A. & Toomre, J. 1972, ApJ178, 623
Treu, T., Stiavelli, M., Bertin, G., Casertano, S., & Møller, P. 2001, MNRAS326, 237 Treu, T., Stiavelli, M., Casertano, S., Møller, P., & Bertin, G. 2002, ApJ564, L13 van de Ven, G., van Dokkum, P. G., & Franx, M. 2003, MNRAS344, 924
van Dokkum, P. G. & Ellis, R. S. 2003, ApJ592, L53 van Dokkum, P. G. & Franx, M. 1996, MNRAS281, 985 van Dokkum, P. G. & Franx, M. 2001, ApJ553, 90 van Dokkum, P. G. & Stanford, S. A. 2003, ApJ585, 78
Vazdekis, A., Casuso, E., Peletier, R. F., & Beckman, J. E. 1996, ApJS106, 307 White, S. D. M. & Rees, M. J. 1978, MNRAS183, 341
Chapter 2
The Fundamental Plane of
Cluster Ellipticals at
z
= 1
.
25
Abstract
Using deep Hubble Space Telescope Advanced Camera for Survey imaging and Very Large Telescope FOcal Reducer/low dispersion Spectrograph 2 spectra, we deter-mined the velocity dispersions, effective radii, and surface brightnesses for four early-type galaxies in thez = 1.237cluster RDCS 1252.9-2927. All four galaxies are mas-sive, greater than1011M
. These four galaxies, combined with three from
RDCS 0848+4453 atz = 1.276, establish the fundamental plane of massive early-type cluster galaxies at z¯ = 1.25. The offset of the fundamental plane shows that the luminosity evolution in rest-frameBis∆ lnM/LB= (−0.98±0.06)zfor galaxies
withM >1011.5M
. To reproduce the observed mass-to-light ratio (M/L) evolution, we determine the characteristic age of the stars in theseM > 1011.5M
galaxies to be3.0+0−0..33Gyr; i.e.,z∗= 3.4+0−0..54. Including selection effects caused by morphological
bias (the “progenitor bias”), we estimate an age of2.1+0−0..22 Gyr, orz∗ = 2.3+0−0..22 for
the elliptical galaxy population. Massive cluster early-type galaxies appear to have a large fraction of stars that formed early in the history of the universe. However, there is a large scatter in the derivedM/Lvalues, which is confirmed by the spread in the galaxies’ colors. Two lower mass galaxies in ourz¯= 1.25sample have much lower M/L values, implying significant star formation close to the epoch of observation. Thus, even in the centers of massive clusters, there appears to have been significant star formation in some massive,M'1011M
, galaxies atz'1.5.
Holden, B.P., van der Wel, A., Franx, M., Illingworth, G.D., Blakeslee, J.P., van Dokkum, P.G., Ford, H., Magee, D., Postman, M., Rix, H.-W. & Rosati, P.
2.1
Introduction
The fundamental plane (FP) allows one to directly measure the mass and the mass-to-light ratio,M/L, of early-type galaxies. The FP combines three variables: the effective radius (re), the average surface brightness within the effective radius (Ie), and the
velocity dispersion (σ). These data are combined into the relationσ1.20∝r
eIe0.83for
the rest-frameBband (Jørgensen, Franx & Kjærgaard, 1996). With such quantities, we can measureM/L∝σ2/(r
eIe)and how it depends on mass, proportional toreσ2.
Massive galaxies out toz ' 1appear to evolve as ∆ lnM/LB 'z for both clusters
(Kelson et al., 2000b; van Dokkum & Franx, 2001; Wuyts et al., 2004) and in some field samples, although there is a larger scatter for the latter (van Dokkum et al., 2001; Gebhardt et al., 2003; van Dokkum & Ellis, 2003; van de Ven, van Dokkum & Franx, 2003; van der Wel et al., 2004). This slow rate of evolution implies an early epoch of formation,zf ' 3, for the stars in early-type galaxies assuming passively
evolving simple stellar populations. However, atz'1.25, only∼50% of stellar mass we observe today has been formed (e.g., Madau, Pozzetti & Dickinson, 1998; Steidel et al., 1999; Rudnick et al., 2003). This implies that the majority of stars in cluster early-type galaxies formed long before the average star in the universe. Observations determining the luminosity-weighted age of galaxies close toz = 1.25will test this, and there are only three galaxies with FP measurements to date at these redshifts (van Dokkum & Stanford, 2003).
We observed four luminous early-type galaxies in the z = 1.237rich, massive, and X-ray luminous cluster of galaxies RDCS 1252.9-2927 (Rosati et al., 2004) us-ing a combination of the Very Large Telescope (VLT) Focal Reducer/low dispersion Spectrograph 2 (FORS2) and the Advanced Camera for Surveys (ACS) on theHubble Space Telescope(HST). RDCS 1252.9-2927 is the most massive cluster found to date atz > 1, thus it contains a number of luminous and, likely, massive galaxies. We use the FP to constrain theM/Levolution and set the mass scale for four galaxies in RDCS 1252.9-2927. These results, combined with van Dokkum & Stanford (2003), measure the ages of the stellar populations in early-type galaxies atz¯= 1.25. We as-sume aΩm= 0.3,ΩΛ= 0.7andHo= 70 km s−1Mpc−1. All observed magnitudes are
in the AB system. However, for comparison with previous work, we convert observed magnitudes into rest-frame JohnsonBusing the Vega zeropoint.
2.2
RDCS 1252.9-2927 Fundamental Plane Data
Four galaxies in RDCS 1252.9-2927 were selected from among the nine known cluster members (Demarco et al., 2005; Lidman et al., 2004) withz850 <22.5 magthat fit
into a single multislit mask. These are the first, second, third and fifth brightest cluster members. An image of each is shown in Figure 2.1 along with the spectra, in descending order of brightness. Below we discuss the measurement ofreandIefrom
2.2. RDCS 1252.9-2927 FUNDAMENTAL PLANE DATA 13
Figure 2.1: Mosaic showing, from left to right, the observed spectra near4000A˚ in the rest frame of the cluster, galaxy images and images of the residuals. Each image is 2”0 on a side with 0”05 pixels from thez850ACS data, corresponding to roughly rest-frame JohnsonB. The
fit results are listed in Table 2.1. The absolute value of flux in the residuals is≤10% of the flux in the original data. For galaxies 4419 and 4420, the residuals have an “S” shape which is interpreted as a sign of interaction (Blakeslee et al., 2003). The residuals for galaxy 6106 show an over subtraction in the center; it is likely that ther1/4law is too steep; in this case, the best
fitting profile is proportional tor1/3.
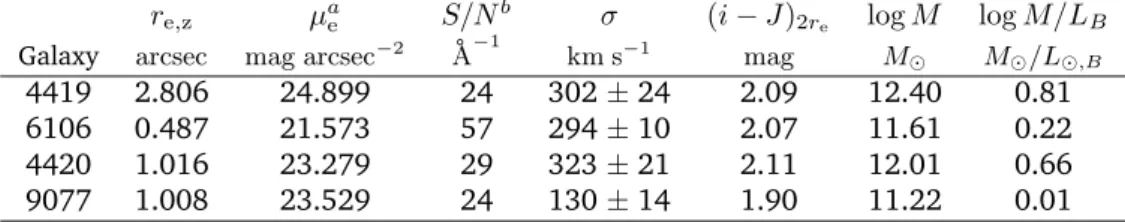
Table 2.1:de Vaucouleurs Model Parameters and Velocity Dispersion
re,z µae S/Nb σ (i−J)2re logM logM/LB
Galaxy arcsec mag arcsec−2 A˚−1 km s−1 mag M
M/L,B
4419 2.806 24.899 24 302±24 2.09 12.40 0.81 6106 0.487 21.573 57 294±10 2.07 11.61 0.22 4420 1.016 23.279 29 323±21 2.11 12.01 0.66 9077 1.008 23.529 24 130±14 1.90 11.22 0.01
aAll magnitudes are AB
2.2.1
HST ACS Imaging
As described in Blakeslee et al. (2003), the ACS imaged RDCS 1252.9-2927 with four overlapping pointings. Each pointing has three orbits in the F775W filter, ori775, and
five orbits in the F850LP filter, orz850. A de Vaucouleurs, orr1/4 model, was fit to
each of the individualz850images using the method of van Dokkum & Franx (1996).
Each galaxy in each image had a unique point spread function generated using the
TinyTIM v6.2package (Krist, 1995). The two galaxies at the middle of the cluster,
referred to as 4419 and 4420 in Table 2.1, were fit simultaneously. Table 2.1 contains the average of the best-fitting parameters for each image with the galaxies listed in order of decreasingz850flux. We plot in Figure 2.1 a mean image, corrected for the
ACS distortion, of all thez850images for each galaxy along with the average residuals
from the fits.
The product reIe0.83 is used to measure the evolution in M/L. Because of the
strong anti-correlation between the error forµeand the error forre(Jørgensen, Franx
& Kjærgaard, 1993), the uncertainties on this product for all four galaxies is small at '5%.
2.2.2
VLT FORS2 Spectra
The four galaxies in Table 2.1 were observed using FORS2, on the VLT, through slit masks with the 600z grism in conjunction with the OG590 order separation filter. The observations were done in service mode with a series of exposures, dithered over four positions, for a total integration time of 24 hours. The resulting signal-to-noise (S/N) ratios at4100A˚ rest-frame are listed in Table 2.1. Details concerning the data reduction are described in van der Wel et al. (2005).
The high spectral resolution, 80 km s−1 per pixel, resulted in accurate internal
velocity dispersions for the four cluster members (see Table 2.1). The spectra were fit, by the method of van Dokkum & Franx (1996), with stellar spectra (Valdes et al., 2004) with a wide range in spectral type and metallicity. For more details concerning the usage of the templates and the derivation of velocity dispersions, see van der Wel et al. (2005).
The velocity dispersions were aperture corrected to a 1.7 kpc circular aperture at the distance of Coma, as described in Jørgensen et al. (1996). The listed errors include a statistical error derived from theχ2 value of the fit and a systematic error
estimated to be at most 5% for the spectra with the lowestS/Nratio.
2.2.3
Rest-frame Magnitudes
In order to compare with other FP results in the literature, the observedz850
mag-nitudes must be converted intoBrest, the equivalent of observing the galaxies with
a rest-frame Johnson B filter (Bessell, 1990) in the Vega system. The z850 filter is
centered at 4058A˚ in the rest-frame of the galaxies in RDCS 1252.9-2927. This fil-ter is close to the central wavelength of Johnson B at4350A, but even the modest˚ wavelength difference means that the conversion betweenz850 atz= 1.237and the
2.3. THE FUNDAMENTAL PLANE ATZ¯= 1.25 15
Figure 2.2:Projection of the FP for our sample and Coma. The results for RDCS 1252.9-2927 (z=1.237) are plotted as filled circles, the crosses are from RDCS 0848+4453 (van Dokkum & Stanford, 2003, z = 1.276), and the open stars are from Coma (Jørgensen et al., 1996, z= 0.023). The y-axis isxfp= 0.83 logre+0.69 logIe, one of the projections of the FP. The solid
line is the FP for Coma while the dotted line has the same slope but is shifted∆M/LB =−0.98 for the five massive galaxies atz¯= 1.25.
and calculated theBrest magnitude as a function the observedz850andi775−J color,
yieldingBrest =z850−0.45(i775−J) + 1.68. This approach is slightly different than
that used in Kelson et al. (2000a) or van Dokkum & Stanford (2003), but yields re-sults that differ in the mean by≤0.02magnitudes, with an error of only≤5% (see Holden et al., 2004). TheJ, along withKs, photometry comes from the VLT ISAAC
and New Technology Telescope SOFI observations discussed in Lidman et al. (2004). We will also use this data to examine the rest-frame opticalB−I colors below. All colors were measured within an aperture of two effective radii. The ACS imaging was smoothed to match the seeing in the ISAAC data to measure this color.
The statistical errors on the FP are dominated by the error on the velocity disper-sions, which are around 10% including an estimate of the systematic error. Because this error dominates the error budget, we will take the error onσ to be the FP error for the rest of the Letter.
2.3
The Fundamental Plane at
z
¯
= 1
.
25
The most straightforward way to measure the evolution inM/LB is to compute the
Figure 2.3: Change in M/LB for early types as a function of redshift. We use the same symbols as Figure 2.2 with the addition of open squares for MS 1358+62 (Kelson et al., 2000b, z = 0.328), open plus signs from MS 2053-04 (z = 0.583) and the filled triangles are from MS 1054-03 (z = 0.832), both from Wuyts et al. (2004). The resulting evolution, with respect to the Coma FP, is shown as a line with the form∆ lnM/LB ∝(−0.98±0.06)z.
for galaxies at the same part of the FP or roughly the same mass. The offset∆M/L and rate ofM/LB evolution is readily apparent in Figure 2.3. We find∆M/LB =
−1.23±0.08for fivez¯= 1.25early-type galaxies, three from RDCS 1252.9-2927 and two from RDCS 0848+4453 with masses M > 1011.5M
. This corresponds to an evolution in∆ lnM/LB∝(−0.98±0.06)z, a small deviation from the∆ lnM/LB∝
(−1.06±0.09)z of van Dokkum & Stanford (2003) and the∆ lnM/LB ∝ −1.08zof
Wuyts et al. (2004).
There is a large scatter seen in Figure 2.3 in∆ lnM/LB,σ[ln(M/LB)] = 0.32for
the sevenz¯= 1.25, early-type galaxies. This scatter is twice the size of the scatter in Coma or MS 1358+62, regardless of whether the scatter is computed for all galaxies, or only the seven most luminous galaxies in either MS 1358+62or the Coma Cluster sample. A large part of this scatter comes from the two lower mass galaxies in the sample. The five galaxies withM > 1011.5M
showσ[ln(M/LB)] = 0.22, which is
not statistically different from the Coma or MS 1358+62 value. There is an obvious selection effect towards lowM/Lgalaxies in a luminosity-selected sample. This may both increase the scatter and bias the mean change in the M/L ratio; hence, we remove the two low mass galaxies from our sample.
TheM/LB values for theM >1011.5M galaxies atz¯= 1.25correlate with the rest-frameB−I colors, as seen in Figure 2.4. Both the colors and theM/LB track
a rapidly declining star-formation rate model from Bruzual & Charlot (2003). As this relatively simple stellar population reproduces most of the observations, the observed scatter inM/LB is then likely the result of a spread in the luminosity-weighted ages.
2.4. IMPLICATIONS FOR THE EVOLUTION OF EARLY-TYPE CLUSTER GALAXIES 17
Figure 2.4:Values ofM/LBas a function of the rest-frame VegaB−Icolor for galaxies with M >1011.5M
. The average Coma values are represented as a star symbol, while the three
galaxies from RDCS 1252.9-2927 are filled circles and the two galaxyes from RDCS 0848+4453 are crosses. The line shows the trajectory of a solar metallicity model with an exponentially declining,τ= 200 Myr, star formation rate Bruzual & Charlot (2003) model normalized to the average Coma Cluster observations. The highestM/LB is galaxy 4419, the brightest cluster galaxy. The colors of galaxy 4419 are significantly bluer than predicted for its observedM/LB, ruling out the offset being a result of dust or metallicity effects. The lowest mass galaxy in RDCS 0848+4453 is excluded (see text).
lower M/LB and, therefore, bluer colors (see Figure 2.4.) The slope of the
mass-M/Lrelation appears to steepen at higher redshifts. This is expected for a population where the spread in theM/Lcomes from the spread in age. As a stellar population becomes younger, theM/L changes more quickly, so the spread inM/L will grow as observations probe closer to the epoch of formation. However, this trend will be exaggerated by the selection of galaxies at a fixed luminosity, as the sample selection will prefer lowerM/Lgalaxies. Lower mass galaxies with larger values forM/LBwill
not appear in this sample because of our magnitude limit, effectivelyLB'1011L.
2.4
Implications for the Evolution of Early-type
Clus-ter Galaxies
The rate of theM/Levolution can be used to constrain the luminosity-weighted age for early-type galaxies. The most straightforward estimate is to assume all galaxies formed at one epoch and find the age of the galaxies that will produce the observed change inM/Lfromz = 0.023toz¯= 1.25using population synthesis models. For our sample of fiveM >1011.5M
galaxies, the mean age isτ∗ = 3.0+0−0..33Gyrbefore
the time of the observations, or a formation redshift ofz∗ = 3.4+0−0..54 using the same
Figure 2.5:Values ofM/LB as a function of mass, using the same symbols as Figure 2.3 but not including the results for MS 2053-04. The lower redshift trend of higherM/LB at higher masses appears to be preserved at ¯z = 1.25, even when we ignore the lowest mass galaxy in RDCS 0848+4453. The dotted lines representLB = 1011and1010L
. Ourz850 = 22.5
selection limit corresponds toLB '1010.9L
for a galaxy with the colors of a Coma elliptical
galaxy.
with the results from the high-mass sample of Wuyts et al. (2004), who foundz∗ = 2.95+0−0..8146for galaxies regardless of morphology.
When computing the age for the early-type galaxy population, there is an over-estimate of the age of a population caused by young galaxies not being counted as part of the early-type population, even if those young galaxies will evolve into early types after the epoch of observation. This “progenitor bias” depresses the rate of ob-served evolution inM/Lby up to 20% (van Dokkum & Franx, 2001). Using this same assumption, namely, that the true evolution is∆ lnM/LB ∝(−1.18±0.06)z, we
in-stead findτ∗ = 2.1+0−0..22Gyrbeforez¯= 1.25, or a formation redshift ofz∗ = 2.3+0−0..22.
Blakeslee et al. (2003) and Lidman et al. (2004) both find a mean age of≥2.6 Gyr using the colors of the galaxies in RDCS 1252.9-2927. Blakeslee et al. (2003) re-moved the “progenitor bias” with simulations, whereas Lidman et al. (2004) uses all galaxies, regardless of morphology, to similar effect.
The above results imply that the stars that formed these massive galaxies were created at redshifts of z∗ ' 2−3, at which time less than 1/3of today’s observed stellar mass was formed (e.g., Bell, 2005). However, there is a large spread in the M/LB for all of the early-type galaxies atz ' 1.25, larger than at lower redshifts.
2.4. IMPLICATIONS FOR THE EVOLUTION OF EARLY-TYPE CLUSTER GALAXIES 19
some early-typegalaxies show much lower M/Lvalues and corresponding younger ages. In fact, the lowestM/Lgalaxy in Figure 2.3 was tentatively classified by van Dokkum & Stanford (2003) as having a recent starburst based on the spectrum. Such younger appearing galaxies have lower masses than the high M/L galaxies in our sample, but are still massive galaxies withlogM/M ' 11. The implication of all these results is that a significant fraction of the stars in the most massive galaxies appear to have formed very early in the history of the universe, before the majority of stars present today. The massive cluster galaxies appear to follow the same low-redshift trend of the higher mass systems having higherM/LB. However, the larger
spread at z¯ = 1.25 in the M/LB indicates that we have identified some massive,
M '1011M
, galaxies whose last burst of star formation occurred in the relatively recent past,z'1.5.
References
Bell, E. 2005, in Planets to Cosmology: Essential Science in Hubble’s Final Years, ed. M Livio (Cambridge: Cambridge University Press)in press, astro-ph/0408023 Bessell, M. S. 1990,PASP102, 1181
Blakeslee, J. P. et al. 2003,ApJ596, L143
Bruzual, G. & Charlot, S. 2003, MNRAS344, 1000
Coleman, G. D., Wu, C.-C., & Weedman, D. W. 1980,ApJS43, 393 Demarco, R. et al. 2005, A&A432, 381
Gebhardt, K. et al. 2003, ApJ597, 239
Holden, B. P., Stanford, S. A., Eisenhardt, P., & Dickinson, M. 2004, AJ127, 2484 Jørgensen, I., Franx, M., & Kjærgaard, P. 1993, ApJ411, 34
Jørgensen, I., Franx, M., & Kjærgaard, P. 1996, MNRAS280, 167 Kelson, D. D., Illingworth, G. D., van Dokkum, P. G., & Franx, M. 2000a,
ApJ531, 137
Kelson, D. D., Illingworth, G. D., van Dokkum, P. G., & Franx, M. 2000b, ApJ531, 184
Krist, J. 1995, inASP Conf. Ser. 77:
Astronomical Data Analysis Software and Systems IV, p.349
Lidman, C., Rosati, P., Demarco, R., Nonino, M., Mainieri, V., Stanford, S. A., & Toft, S. 2004, A&A416, 829
Madau, P., Pozzetti, L., & Dickinson, M. 1998, ApJ498, 106 Rosati, P. et al.2004, AJ127, 230
Rudnick, G. et al. 2003, ApJ599, 847
Steidel, C. C., Adelberger, K. L., Giavalisco, M., Dickinson, M., & Pettini, M. 1999, ApJ519, 1
Valdes, F., Gupta, R., Rose, J. A., Singh, H. P., & Bell, D. J. 2004, ApJS152, 251 van de Ven, G., van Dokkum, P. G., & Franx, M. 2003, MNRAS344, 924
van der Wel, A., Franx, M., van Dokkum, P. G., & Rix, H.-W. 2004, ApJ 601, L5 (Chapter 3)
van der Wel, A., Franx, M., van Dokkum, P. G., Rix, H.-W., Illingworth, G., & Rosati, P. 2005, ApJin press, astro-ph/0502228 (Chapter 4)
van Dokkum, P. G. & Ellis, R. S. 2003, ApJ592, L53 van Dokkum, P. G. & Franx, M. 1996, MNRAS281, 985 van Dokkum, P. G. & Franx, M. 2001, ApJ553, 90
van Dokkum, P. G., Franx, M., Kelson, D. D., & Illingworth, G. D. 2001, ApJ553, L39 van Dokkum, P. G. & Stanford, S. A. 2003, ApJ585, 78
Worthey, G. 1994, ApJS95, 107
Chapter 3
The Fundamental Plane of Field
Early Type Galaxies at
z
= 1
Abstract
We present deep VLT spectra of early-type galaxies at z ≈ 1in the Chandra Deep Field South, from which we derive velocity dispersions. Together with structural parameters from Hubble Space Telescope imaging, we can study the Fundamental Plane for field early type galaxies at that epoch. We determine accurate mass-to-light ratios (M/L) and colors for four field early type galaxies in the redshift range 0.96< z <1.14, and two with0.65< z <0.70. The galaxies were selected by color and morphology, and have generally red colors. Their velocity dispersions show, how-ever, that they have a considerable spread inM/L(a factor of 3). We find that the colors and directly measuredM/Lcorrelate well, demonstrating that the spread in M/Lis real and reflects variations in stellar populations. The most massive galaxies haveM/Lcomparable to massive cluster galaxies at similar redshift, and therefore have stellar populations which formed at high redshift (z >2). The lower mass galax-ies atz≈1have a lower averageM/L, and one is a genuine ’E+A’ galaxy. TheM/L indicate that their luminosity-weighted ages are a factor of 3 younger at the epoch of observation, because of either a late formation redshift or late bursts of star formation contributing 20 - 30% of the mass.
van der Wel, A., Franx, M., van Dokkum, P.G. & Rix, H.-W.
3.1
Introduction
Good understanding of the formation and evolution of early-type galaxies is one of the major challenges for current structure-formation models. Models of hierarchi-cal structure generally predict that field early type galaxies form relatively late (e.g., Diaferio et al., 2001). One of the prime diagnostics of the formation history of early-type galaxies is the evolution of theM/Las measured from the fundamental plane (FP Franx, 1993). Studies of the evolution of the luminosity function together with the evolution ofM/L, quantify the evolution of the mass function. Previous studies of the evolution of theM/Lhave produced consistent results for the evolution of mas-sive cluster early-type galaxies: the evolution is slow, consistent with star formation redshiftsz≈2(e.g., van Dokkum & Stanford, 2003).
On the other hand, studies of the evolution of field galaxies have yielded more contradictory results: whereas early studies found slow evolution (e.g., van Dokkum et al., 2001; Treu et al., 2001; Kochanek et al., 2000), more recently, evidence for much faster evolution was found by Treu et al. (2002) and Gebhardt et al. (2003); and yet other authors found that the majority of field early-types evolve slowly, with a relatively small fraction of fast-evolving galaxies (e.g., Rusin et al., 2003; van Dokkum & Ellis, 2003; van de Ven, van Dokkum & Franx, 2003; Bell et al., 2004).
These previous measurements suffered from several uncertainties: The signal-to-noise ratios (S/N) of the spectra were generally quite low, much lower than usual for nearby studies of the FP (e.g., Faber et al., 1989; Jørgensen, Franx & Kjærgaard, 1996). Those studies based on lensing galaxies used stellar velocity dispersions de-rived from image separations.
In this Letter, we present high-S/N spectra and accurate measurements of the M/Lof four field elliptical galaxiesz=∼1−1.14and two atz∼0.7in the Chandra Deep Field-South (CDF-S). The S/N are comparable to those obtained for nearby galaxies. Together with accurate multiband photometry available for the CDF-S, we have measured the accurateM/Land rest frame optical colors atz∼1.
Throughout this Letter we use Vega magnitudes, and assume aΛ-dominated cos-mology ([ΩM,ΩΛ] = [0.3,0.7]), with a Hubble constant ofH0= 70 km s−1Mpc−1.
3.2
Spectroscopy
3.2.1
Sample selection and Observations
The galaxies were selected from the COMBO17 catalog (see Wolf et al., 2003), and imaging obtained by the Great Observatories Origin Deep Survey (GOODS1, data release v0.5) from the Advanced Camera for Surveys (ACS) on theHubble Space Tele-scope. We selected compact, regularly shaped galaxies with photometric redshifts higher than 0.8 andI−z ≥(I −z)Sbc, z <22. (I −z)Sbcdenotes the color of the
Sbc template of Coleman, Wu & Weedman (1980) at the photometric redshift. This template has (U −V)z=0 = 0.95. The typical uncertainty in the color is 0.1 mag.
Lower priority galaxies were included with either lower redshifts or later types.
3.2. SPECTROSCOPY 23
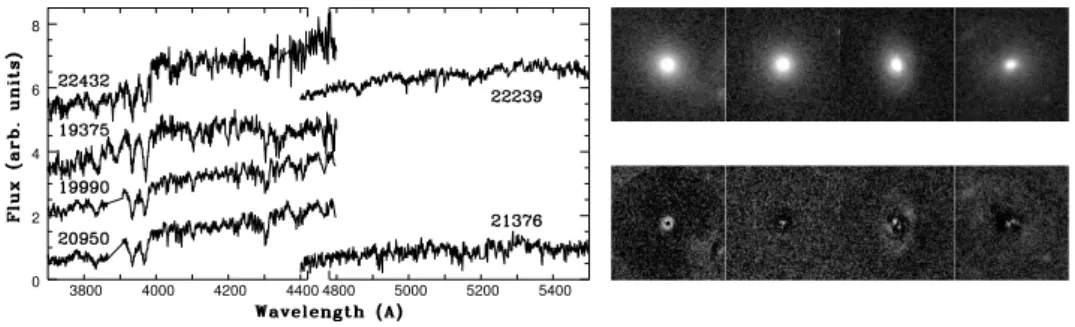
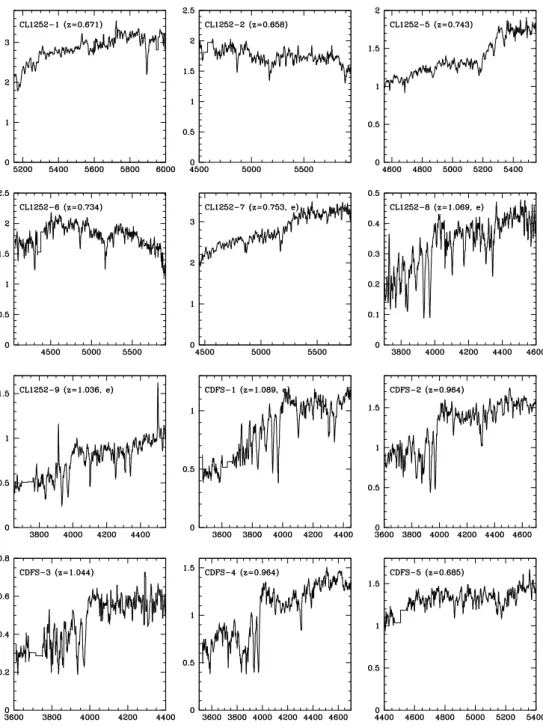
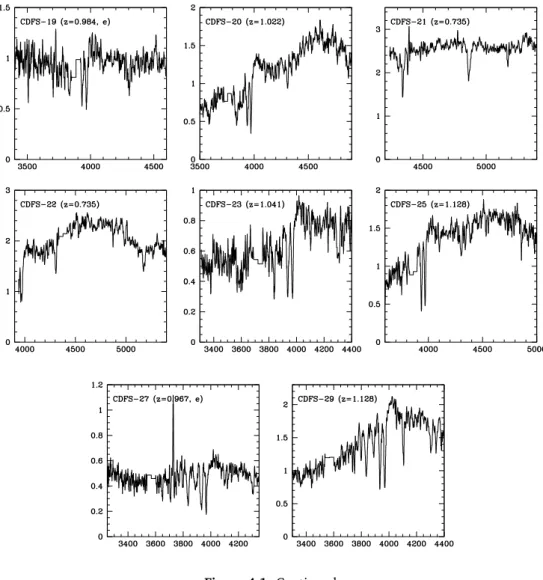
0 2 4 6 8
3800 4000 4200 4400 4800 5000 5200 5400
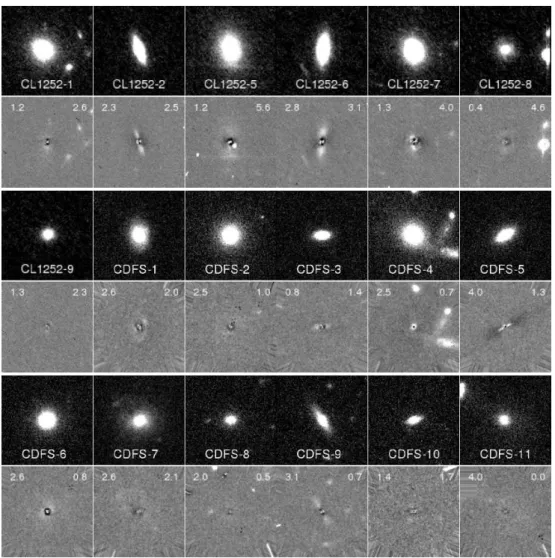
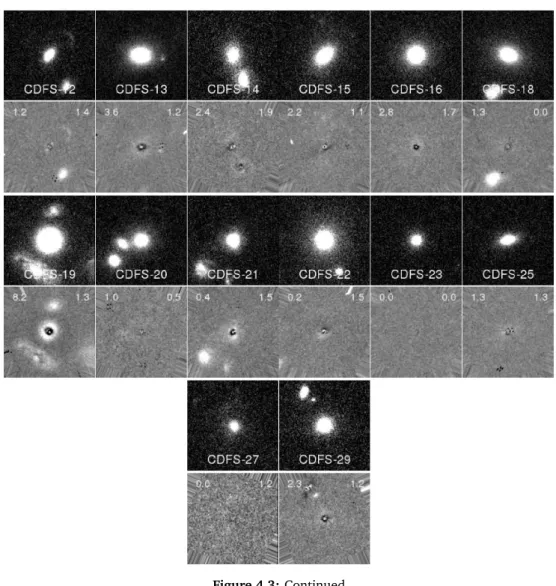
Figure 3.1: Left: Unsmoothed rest-frame spectra of the six objects with velocity dispersions. Regions with bright sky lines are interpolated. The wavelength scale is interrupted atλ = 4500A.˚ Right: ACS images (F850LP) of the four galaxies atz ∼ 1, and the residual images from ther1/4fit.From left to right: 20950, 19990, 19375, 22432.
The CDF-S was observed in MXU mode with FORS2 on VLT-UT4 during three runs from 2002 September through 2003 February, for a total of 14 hours. The 600zgrism (central wavelength9010A, resolution˚ 5.1A˚ orσinstr= 72 km s−1) was used. During
the observations toward the CDF-S the seeing varied between 0”7 and 1”5, with a median seeing of about100. The sky was clear all the time.
3.2.2
Velocity Dispersions
It turned out that 10 out of the 11 high-priority objects atzphot∼1have the spectrum
of a quiescent galaxy; the other one has a bright OII emission line. The brightest four (z.21.0, independent of the color) had sufficientS/Nto perform reliable dispersion measurements. The rest-frame spectra of these four galaxies are shown in Figure 3.1. They all show a strong4000A˚ break and Ca lines. Balmer lines (especially the Hδ line) are also present, though varying in strength from object to object (see Table 3.2). Object 19375 is an “E+A” galaxy, according to the criteria used by Fisher et al. (1998). For two ellipticals with 0.65 < z < 0.70we also have sufficient signal to determine a velocity dispersion.
Dispersions were measured by convolving a template star spectrum to fit the galaxy spectrum as outlined by van Dokkum & Franx (1996). We tested this proce-dure extensively, using different template stars and masking various spectral regions. The final values (see Table 3.2) for the velocity dispersions were obtained by masking the Ca H and K and Balmer lines and using the best-fitting template spectrum, which was a high-resolution solar model spectrum2 smoothed and rebinned to match the resolution of the galaxy spectra. The Ca lines were not included in the fit because this greatly reduced the dependence of the measured velocity dispersions on tem-plate type. The tests using different temtem-plates and different masking of the Ca lines indicate that the systematic uncertainty is∼5%.
In order for the results to be comparable to previous studies, an aperture
Table 3.1:Photometric and Spectroscopic Properties
α δ log(reff)
ID arcsec arcsec zspec i v−i i−z kpc µeff
19375 0 -50 1.089 21.72 1.71 1.04 -0.410±0.012 21.75±0.05 19990 -32 -35 0.964 21.32 1.89 1.00 -0.388±0.007 21.45±0.03 20950 -73 -6 0.964 21.18 2.07 1.07 0.0085±0.026 22.95±0.08 22432 83 41 1.135 22.38 2.00 1.42 -0.109±0.040 23.35±0.13 21376 129 10 0.685 21.46 1.77 0.58 -0.447±0.001 22.16±0.04 22239 236 35 0.660 20.67 1.67 0.50 -0.842±0.002 19.83±0.03
S/N σ (Hγ+Hδ)/2 [OII]
ID A˚−1 km s−1 A˚ A˚
19375 26 198±25 4.1 -4.6 19990 49 159±14 2.5 >-1 20950 39 261±23 <1 >-1 22432 21 217±20 <1 -4.4
21376 27 156±24 – –
22239 40 177±19 – –
Table 3.2: Coordinates are in in arcseconds east and north of R.A.= 03h32m25s, decl.= −27◦
540
0000. Errors in the magnitudes and colors are, respectively,
0.03and0.05 mag. Effec-tive radii and surface brightnesses (mag/arcsec2atr
e) are measured in thez-band for objects
19375, 19990, 20950 and 22432, and in thei-band for objects 21376 and 22239. The listed errors in the velocity dispersions are fitting errors, and do not include a 5% systematic error.
rection as described by Jorgensen, Franx & Kjærgaard (1995) was applied to obtain velocity dispersions within a circular aperture with a radius of 1”7 at the distance of the Coma cluster. This correction is∼7%.
This is the first extensive sample of such objects atz >0.9with highS/N. (see van Dokkum & Ellis, 2003; Treu et al., 2002; Gebhardt et al., 2003, for other spectroscopic studies).
3.3
Photometry
Photometry and structural parameters were determined from the GOODS ACS im-ages (data release v1.0). Imim-ages are available in four filters (F435W, F606W, F775W, F850LP), which we refer to asb,v,i, andz, respectively.
For each object, the effective radius (re) and the surface brightness at the effective
radius (µe) were obtained by fitting an r1/4 profile, convolved by the point-spread
function (PSF van Dokkum & Franx, 1996);z-band images were used for thez ∼1 objects, and i-band images for the z ∼ 0.7 objects. Stars were used as the PSF. The resulting values for re and µe vary by≈ 10% when using different stars, but
3.3. PHOTOMETRY 25
19375 19990
20950
22432
21376
22239
19375 19990 20950
22432 21376
22239
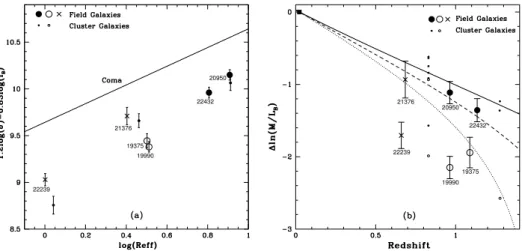
Figure 3.2: (a) FP points of the field galaxies presented in this paper (errors include a 5% systematic effect in the velocity dispersions), the FP points of cluster galaxies atz = 1.27(van Dokkum & Standford 2003), and the FP of the Coma Cluster (Jørgensen et al. 1996). (b) Off-sets inM/LBfrom the Coma Cluster FP (square; derived from Jørgensen et al. 1996). Besides thez = 1.27cluster, this figure also contains the data from van Dokkum et al. (1998) on the MS 1054 cluster atz= 0.83. The full, dashed and dotted curves are the model predictions for a single burst of starformation with a Salpeter (1955) initial mass function for redshifts 3, 2, and 1.5, respectively. Filled symbols indicate galaxies with massesM >3×10¹¹M
; other symbols
indicate galaxies less massive than that. Crosses and squares distinguish between galaxies at z <0.8andz >0.8, respectively. All galaxies occupying the region below thez = 1.5model curve are “E+A” galaxies, except 19990, and have masses less than3×1011M
. The more
massive galaxies have significantly older stellar populations.
1996). Therefore, the errors in our results are dominated by the errors in the velocity dispersions. The results are listed in Table 3.2. The images of thez∼1objects and the residuals of the fits are shown in Figure 3.1.
To determine thei−zandv−icolors, fluxes were calculated from ther1/4model
within the measured effective radius. To this model flux we added the flux within the same radius in the residual images. We corrected for Galactic extinction based on the extinction maps from Schlegel, Finkbeiner & Davis (1998). The correction is extremely small:E(B−V) = 0.007.
3.4
Mass-to-Light Ratios from the FP
Figure 3.2a shows the Fundamental Plane for the six field galaxies described above, and the FP for Coma derived by Jørgensen et al. (1996). Additionally, we show the results from van Dokkum & Stanford (2003) on three cluster galaxies atz= 1.27. The offsets of the high-redshift galaxies from the Coma FP are a measure of the evolution ofM/L. We show the evolution ofM/Lin Figure 3.2b as a function of redshift.
Obviously, the field galaxies atz >0.6span a wide range in offsets, by a factor of approximately 3 inM/L. The error bars on the individual points are much smaller than the offsets. A model with a single formation redshift can be ruled out at the 99% confidence level, as measured from theχ2-method. The restframe colors of the
galaxies confirm the reality of the variations in theM/L. As shown in Figure 3.3, a very strong correlation exists between the colors and the M/L, in the direction predicted by population sysnthesis models. The good correlation demonstrates that colors can be used to estimate theM/L, as applied, for example, by Bell et al. (2004) to a large sample of field early-type galaxies.
We note that galaxies in our study lie fairly close to the red sequence, and were characterised by Bell et al. (2004) to have red colors. The overall spread in colors of field galaxies is much larger (1.5 mag) compared to the spread found here (0.3 mag).
3.5
Discussion
On the basis of our high-S/N spectra we have found a rather wide range inM/Lfor early-type galaxies atz= 1, indicating a range in star formation histories. TheM/L and colors are well correlated, as expected from stellar population models. Hence the scatter inM/Lis real.
The results agree surprisingly well with earlier results based on lensing galax-ies. Rusin et al. (2003) and van de Ven et al. (2003) found a range in M/L, and van de Ven et al. (2003) found a similar correlation between restframe colors and M/L. Other authors found either lowM/L(e.g., Treu et al., 2002; Gebhardt et al., 2003), or highM/L(e.g., van Dokkum & Ellis, 2003), and this is most likely due to (still unexplained) sample selection effects. The last authors found that galaxies with residuals from ther1/4profile had young ages. However, we find no such relation in
our sample.
Stellar population models indicate that the low M/L of the blue z ≈ 1 galax-ies may be due to an age difference of a factor of 3. Alternatively, bursts involving 20−30%of the mass can produce similar offsets. The current sample is too small to determine the fraction of young early-type galaxies atz≈1reliably. Large, mass se-lected samples are needed for this, as current samples are generally optically sese-lected and therefore biased towards galaxies with lowerM/L.
It is striking that the most massive galaxies have modest evolution inM/L, similar to what van Dokkum & Stanford (2003) found for massive cluster galaxies. The evolution of the galaxies withM = 6.07reσ2≥3×10¹¹M(Jørgensen et al., 1996) in our sample is∆ lnM/LB =−1.17±0.14z. The implied formation redshift is above
early-3.5. DISCUSSION 27
19375
19990
20950
22432 21376
22239
Figure 3.3:RestframeU −V color vs. M/LB in solar units. Filled symbols are objects more massive thanM > 3×10¹¹M
; open symbols represent the less massive ones. The cluster
galaxies are thez= 1.27galaxies from Figure 3.2. The redshift zero datapoint is the average for galaxies withσ > 150 km s−1 in the clusters Abell 194 and DC2345-28 (Jørgensen et al.
1995). The lines are solar metallicity Bruzual & Charlot (2003) models with constant star formation during the first200 Myr(dotted line) and exponentially decaying star formation on the same time scale (dashed line).
type galaxies derived by Kochanek (1994) of 225 km s−1, we derive a typical mass
ofM∗ = 3.1×10¹¹M based on the sample measured by Faber et al. (1989). The sample as a whole evolves as∆ lnM/LB =−1.64±0.45z, whereas the sample with
masses smaller than3×1011M
evolves as∆ lnM/LB=−1.95±0.29z.
The results are therefore consistent with little or no (recent) star formation in massive early-type galaxies out toz = 1, and younger populations in less massive galaxies, possibly caused by bursts involving up to 30% of the stellar mass. Since these less massive galaxies have much more regular stellar populations atz <0.5without signs of recent star formation, these results are consistent with the downsizing seen in the field population (Cowie et al., 1996): at progressively higher redshifts, more and more massive galaxies are undergoing strong star formation.
It remains to be seen how this trend continues out to even higher redshifts. The biases inherent in studies of galaxies atz = 2and higher make it very hard to per-form similar studies: the optical light has shifted to the near-IR, and spectroscopy is extremely hard at those wavelengths.
More studies at redshift z ≈ 1 are needed to determine the distribution of col-ors and M/L of the progenitors of field early-types. Such a determination should be based on mass-selected samples. Further studies of spectral energy distributions extending to the rest-frame infrared will be very useful to better constrain the star formation histories of the bluer galaxies.
References
Bell, E. F. et al. 2004, ApJ608, 752
Coleman, G. D., Wu, C.-C., & Weedman, D. W. 1980,ApJS43, 393 Cowie, L. L., Songaila, A., Hu, E. M., & Cohen, J. G. 1996, AJ112, 839 Diaferio, A., Kauffmann, G., Balogh, M. L., White, S. D. M., Schade, D.,
& Ellingson, E. 2001, MNRAS323, 999
Faber, S. M., Wegner, G., Burstein, D., Davies, R. L., Dressler, A., Lynden-Bell, D., & Terlevich, R. J. 1989, ApJS69, 763
Fisher, D., Fabricant, D., Franx, M., & van Dokkum, P. 1998, ApJ498, 195 Franx, M. 1993, PASP105, 1058
Gebhardt, K. et al. 2003, ApJ597, 239
Jørgensen, I., Franx, M., & Kjærgaard, P. 1996, MNRAS280, 167 Jorgensen, I., Franx, M., & Kjærgaard, P. 1995, MNRAS276, 1341 Kochanek, C. S. 1994, ApJ436, 56
Kochanek, C. S. et al. 2000,ApJ543, 131 Rusin, D. et al. 2003, ApJ587, 143
Schlegel, D. J., Finkbeiner, D. P., & Davis, M. 1998, ApJ500, 525
Treu, T., Stiavelli, M., Bertin, G., Casertano, S., & Møller, P. 2001, MNRAS326, 237 Treu, T., Stiavelli, M., Casertano, S., Møller, P., & Bertin, G. 2002, ApJ564, L13 van de Ven, G., van Dokkum, P. G., & Franx, M. 2003, MNRAS344, 924
van Dokkum, P. G. & Ellis, R. S. 2003, ApJ592, L53 van Dokkum, P. G. & Franx, M. 1996, MNRAS281, 985 van Dokkum, P. G. & Franx, M. 2001, ApJ553, 90
van Dokkum, P. G., Franx, M., Kelson, D. D., & Illingworth, G. D. 2001, ApJ553, L39 van Dokkum, P. G. & Stanford, S. A. 2003, ApJ585, 78
Chapter 4
Mass-to-Light Ratios of Field
Early-Type Galaxies at
z
∼
1
from Ultra-Deep Spectroscopy:
Evidence for
Abstract
We present an analysis of the Fundamental Plane for a sample of 27 field early-type galaxies in the redshift range0.6 < z <1.15in the Chandra Deep Field-South and the field of the background cluster RDCS 1252.9-2927. Sixteen of the galaxies are at z >0.95. The galaxies in this sample have high signal-to-noise spectra obtained at the Very Large Telescope and high resolution imaging from the HST Advanced Camera for Surveys. From comparison with lower redshift data, we find that the mean evolution of the mass-to-light ratio (M/L) of our sample is∆ ln (M/LB) = (−1.74±0.16)z, with
a large galaxy-to-galaxy scatter. The strong correlation betweenM/Land rest-frame color indicates that the observed scatter is not due to measurement errors, but due to intrinsic differences between the stellar populations of the galaxies, such that our re-sults can be used as a calibration for converting luminosities of high redshift galaxies into masses. This pace of evolution is much faster than the evolution of cluster galax-ies. However, we find that the measuredM/Levolution strongly depends on galaxy mass. For galaxies with massesM > 2×10¹¹M
, we find no significant difference between the evolution of field and cluster galaxies: ∆ ln (M/LB) = (−1.20±0.18)z
for field galaxies and∆ ln (M/LB) = (−1.12±0.06)zfor cluster galaxies. The relation
between the measuredM/Levolution and mass is partially due to selection effects, as the galaxies are selected by luminosity, not mass. We calculate the magnitude of this effect for the sub-sample of galaxies with masses higher thanM = 6×10¹⁰M
: the uncorrected value of the evolution is∆ ln (M/LB) = (−1.54±0.16)z, whereas
the corrected value is(−1.43±0.16)z. However, even when taking selection effects into account, we still find a relation betweenM/Levolution and mass, which is most likely caused by a lower mean age and a larger intrinsic scatter for low mass galax-ies. Results from lensing early-type galaxies, which are mass-selected, show a very similar trend with mass. This, combined with our findings, provides evidence for down-sizing, i.e., for the proposition that low mass galaxies are younger than high mass galaxies. Previous studies of the rate of evolution of field early-type galaxies found a large range of mutually exclusive values. We show that these differences are largely caused by the differences between fitting methods: most literature studies are consistent with our result and with one another when using the same method. Finally, five of the early-type galaxies in our sample have AGN. There is tentative evidence that the stellar populations in these galaxies are younger than those of galaxies with-out AGN.
van der Wel, A., Franx, M., van Dokkum, P.G., Rix, H.-W., Illingworth, G.D. & Rosati, P.
4.1. INTRODUCTION 31
4.1
Introduction
Understanding the formation and evolution of early-type galaxies is a key issue when addressing the mass assembly and star formation history of the galaxy population as a whole and the formation of structure in the universe, as 50% or more of all stars in the present day universe are in early-type galaxies and bulges (see, e.g., Bell et al., 2003).
In hierarchical galaxy formation theories (e.g., Cole et al., 2000), massive galaxies assemble late, such that strong evolution of the mass density fromz= 1to the present day is expected (see, e.g., Kauffmann & Charlot, 1998). Measuring the mass density requires a measurement of the luminosity density, and an accurate determination of theM/L. M/Lcan be estimated from models (see, e.g., Bell et al., 2004), but these estimates are uncertain due to the age/metallicity degeneracy and the unknown IMF of the stellar populations of the galaxies (Bruzual & Charlot, 2003).
The Fundamental Plane (Djorgovski & Davis, 1987; Dressler et al., 1987) provides a tool to measure the evolution ofM/Lwithout model uncertainties. TheM/Loffset of high redshift galaxies from the local FP can be used to calibrate high redshift galaxy masses and to estimate the age of their stellar populations (Franx, 1993). This tech-nique has been used successfully to measure the luminosity weighted ages of massive cluster galaxies, which have formed most of their stars at redshiftsz ≥2(see, e.g., van Dokkum & Franx, 1996; van Dokkum & Stanford, 2003; Holden et al., 2005). However, it is not clear whether galaxies in the general field evolve in the same way. In fact, in the hierarchical picture the formation redshift of galaxies with a given mass depends on environment (Diaferio et al., 2001). This would lead to substan-tial age differences between field and cluster galaxies at any redshift (van Dokkum et al., 2001). Since this is a generic property of all hierarchical formation models, measuring this difference is a critical test for those theories.
Various authors have measured the M/L evolution of field early- type galaxies through deep spectroscopy of magnitude limited samples. The results are much less conclusive than the results from cluster studies and the comparison between field and cluster has proved to be very hard. Some authors claim much faster evolution for field galaxies than for cluster galaxies (Treu et al., 2001; Gebhardt et al., 2003), but others find that field and cluster galaxies evolve at comparable rates (van Dokkum et al., 2001; van Dokkum & Ellis, 2003; van der Wel et al., 2004). Studies involving lensing galaxies (Kochanek et al., 2000; Rusin et al., 2003; van de Ven, van Dokkum & Franx, 2003), indicate the presence of a mix of fast and slowly evolving galaxies. It is unclear whether the differences between the various results are caused by selection effects, measurement errors due to low signal-to-noise spectra, low number statistics, or contamination by late-type galaxies.