Introduction
Obesity is a health care crisis of global pandemic status, with an estimated 34% of adults and 17% of children in the United States classified as obese as defined by a BMI greater than or equal to 30 kg/m2 (1). The detrimental effects of obesity are due to the fact that it induces a state of chronic “metabolic inflammation” whereby the control of energy and metabolites in adipose, liver, and muscle tis-sue is directed largely by innate immune cells (e.g., macrophages) and soluble effector molecules (e.g., cytokines) (2–7). Metabolic inflammation predisposes individuals to metabolic syndrome and associated comorbidities, including cardiovascular disease, type 2 diabetes (T2D), nonalcoholic fatty liver disease (NAFLD), osteo-arthritis, and various cancers that are the most frequent causes of death in the United States and most Westernized countries (1, 8).
Obesity is also characterized as a hypercoagulable state. Asso-ciation studies have documented elevated circulating levels of von Willebrand factor, fibrinogen, factor VII, and biomarkers of
coag-ulation activity (e.g., thrombin-antithrombin [TAT] complexes, thrombin f1+2, D-dimer) in obese individuals (9–11). Activated protein C (APC) resistance increases with BMI, in part because of elevated factor VIII levels (12). A Mendelian randomization study determined that the risk of deep vein thrombosis increased 3.4-fold for severely obese patients compared with normal-weight individuals (13). More notably, both initial risk and severe mor-bidity and mortality outcomes for vaso-occlusive diseases (e.g., coronary artery disease and stroke) positively correlate with the degree of obesity in patients (9, 10, 14, 15). Collectively, these observations support the notion that obesity increases the risk of thromboembolic disease.
Emergent observations in obese patients have suggested a reciprocal relationship between the thrombin/fibrin(ogen) axis and obesity/metabolic inflammation. A genetic association analysis to evaluate the correlation of thrombophilia mutations with superficial vein thrombosis determined that factor VLeiden is independently associated with a BMI greater than or equal to 28 kg/m2 (16). Levels of procoagulant factors (e.g., fibrinogen, factor VII, factor VIII) are higher in obese patients with T2D than in those without T2D (17). Multiple thrombotic risk factors (e.g., APC resistance, protein S/protein C deficiency, prothrom-bin G20210A) are not only frequently present in patients with Obesity promotes a chronic inflammatory and hypercoagulable state that drives cardiovascular disease, type 2 diabetes,
fatty liver disease, and several cancers. Elevated thrombin activity underlies obesity-linked thromboembolic events, but the mechanistic links between the thrombin/fibrin(ogen) axis and obesity-associated pathologies are incompletely understood. In this work, immunohistochemical studies identified extravascular fibrin deposits within white adipose tissue and liver as distinct features of mice fed a high-fat diet (HFD) as well as obese patients. Fibγ390–396A mice carrying a mutant form of fibrinogen incapable of binding leukocyte αMβ2-integrin were protected from HFD-induced weight gain and elevated adiposity. Fibγ390–396A mice had markedly diminished systemic, adipose, and hepatic inflammation with reduced macrophage counts within white adipose tissue, as well as near-complete protection from development of fatty liver disease and glucose dysmetabolism. Homozygous thrombomodulin-mutant ThbdPro mice, which have elevated thrombin procoagulant function, gained more weight and developed exacerbated fatty liver disease when fed a HFD compared with WT mice. In contrast, treatment with dabigatran, a direct thrombin inhibitor, limited HFD-induced obesity development and suppressed progression of sequelae in mice with established obesity. Collectively, these data provide proof of concept that targeting thrombin or fibrin(ogen) may limit pathologies in obese patients.
Thrombin promotes diet-induced obesity through
fibrin-driven inflammation
Anna K. Kopec,1 Sara R. Abrahams,2 Sherry Thornton,3 Joseph S. Palumbo,4 Eric S. Mullins,4 Senad Divanovic,5 Hartmut Weiler,6
A. Phillip Owens III,7 Nigel Mackman,8 Ashley Goss,9 Joanne van Ryn,10 James P. Luyendyk,1 and Matthew J. Flick2
1Department of Pathobiology and Diagnostic Investigation, Institute for Integrative Toxicology, Michigan State University, East Lansing, Michigan, USA. 2Division of Experimental Hematology and Cancer
Biology, 3Division of Rheumatology, 4Division of Hematology, and 5Division of Immunobiology, Cincinnati Children’s Hospital Research Foundation, Cincinnati, Ohio, USA. 6Department of Physiology, Blood Center of Wisconsin, Milwaukee, Wisconsin, USA. 7Division of Cardiovascular Health and Disease, Department of Internal Medicine, University of Cincinnati College of Medicine, Cincinnati, Ohio, USA. 8Thrombosis and Hemostasis Program, Division of Hematology and Oncology, Department of Medicine, UNC McAllister Heart Institute, University of North Carolina at Chapel Hill, Chapel Hill, North Carolina,
USA. 9Department of Cardiometabolic Disease Research, Boehringer Ingelheim Pharmaceuticals Inc., Ridgefield, Connecticut, USA. 10Department of Cardiometabolic Disease Research, Boehringer Ingelheim Pharma GmbH, Biberach, Germany.
Conflict of interest: A. Goss and J. van Ryn are employees of Boehringer Ingelheim Pharmaceuticals Inc.
The Journal of Clinical Investigation
R E S E A R C H A R T I C L EResults
Fibrinogen drives high-fat diet–induced obesity through the γ390–396
αMβ2-binding motif. To investigate whether fibrin(ogen) could con-tribute to diet-induced obesity, fibrin(ogen) immunohistochemis-try was performed on epididymal white adipose tissue and liver sections from WT mice fed either a control diet (CD) or a high-fat diet (HFD) for 16 weeks. Little to no fibrin(ogen) deposits were detected in either adipose (Figure 1A) or liver (Figure 1B) from mice fed a CD. However, robust fibrin(ogen) deposits were found throughout the extravascular spaces between hypertrophic adipo-cytes in HFD-fed mice (Figure 1A). The most intense fibrin(ogen) staining appeared to be in areas between adipocytes in regions with macrophage accumulation in what have been termed “crown” structures (19). Fibrin(ogen) staining was present throughout the liver sinusoids of HFD-fed mice that showed evidence of steato-sis (Figure 1B). Importantly, sections of visceral adipose tissue from obese patients revealed an identical pattern with extravas-cular fibrin(ogen) deposits present in the adipose tissue and most intense in macrophage-rich “crown” structures (Figure 1A). Extra-vascular fibrin(ogen) deposits were absent in visceral adipose from nonobese individuals. Similarly, liver sections from obese patients with NASH displayed robust fibrin(ogen) deposits in the sinusoids, whereas liver sections with a normal histological pre-sentation were fibrin(ogen)-free (Figure 1B). Collectively, these findings support the concept that fibrin(ogen) could contribute to obesity pathogenesis in both humans and mice.
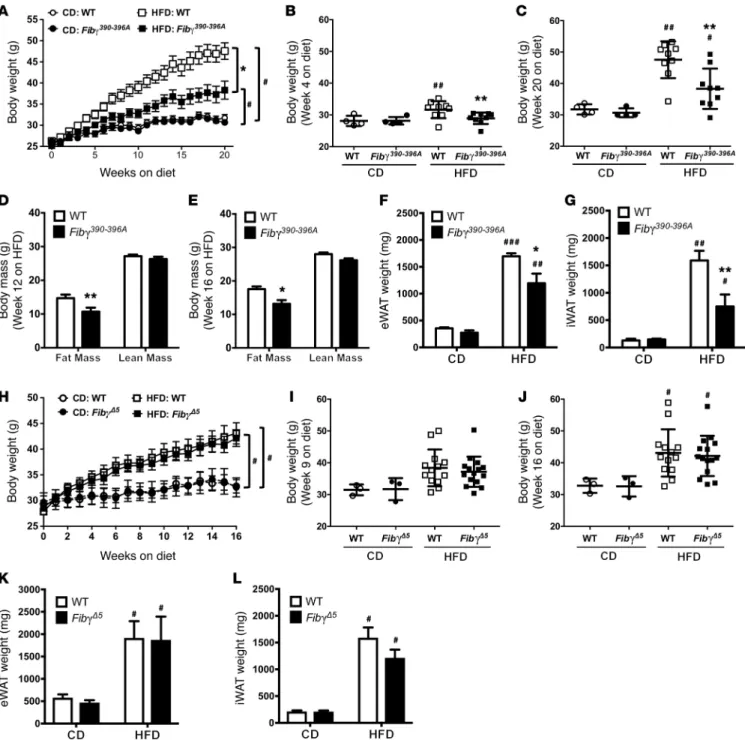
To gain mechanistic insight into the role of fibrinogen in HFD-induced obesity, we used 2 complementary mouse strains expressing function-selective variants of fibrin(ogen): (a) Fgg
390-396A (hereafter termed Fibγ390–396A) mice (20), which express a mutant form of fibrinogen that has normal clotting function but lacks the binding motif for the leukocyte integrin receptor αMβ2,and (b) Fgg Δ5 (hereafter termed FibγΔ5) mice (21), carrying a homozy-gous deletion in fibrinogen for the final 5 amino acids of the γ chain that encode the platelet integrin αIIbβ3–binding motif. Cohorts of WT and Fibγ390–396A mice were fed a CD and HFD (60% of kcal from fat) for 20 weeks. A marked and statistically significant protection from body weight gain was observed in Fibγ390–396A mice fed the HFD compared with HFD-fed WT mice (Figure 2A), with no effect of genotype on body weight gain in mice fed CD. The difference in body weight between HFD-fed Fibγ390–396A and WT mice was signif-icant as early as 4 weeks after starting on the HFD, and the differ-ential increased throughout the 20-week HFD period (Figure 2, B and C, respectively). Body mass composition analysis revealed that the difference in body weight was secondary to reduced fat mass in Fibγ390–396A mice compared with WT mice, as analyzed at 12 and 16 weeks on HFD (Figure 2, D and E, respectively). Further, the epididymal and inguinal white adipose tissue (eWAT and iWAT, respectively) depots isolated from HFD-fed Fibγ390–396A mice at the end of the challenge period were significantly smaller than eWAT and iWAT from HFD-fed WT mice (Figure 2, F and G).
In contrast, FibγΔ5 mice fed an identical 60% HFD gained the same amount of weight as WT mice over the course of the chal-lenge period (Figure 2H). Total body weights of CD-fed or HFD-fed mice were not different between WT and FibγΔ5 mice at any time point during the challenge period (see Figure 2, I and J, for representative time points of 9 weeks and 16 weeks, respective-NAFLD, but are associated with the severe form of this disease,
nonalcoholic steatohepatitis (NASH), and advanced liver fibro-sis (18). Although these association studies are highly intrigu-ing and have serious potential clinical implications, significant knowledge gaps remain, including whether elevated thrombin activity and adipose fibrin deposits are causative factors in obesity and the identification of potential mechanisms linking thrombin and fibrin to obesity sequelae.
Here, we directly explored the hypothesis that fibrin-(ogen) and thrombin activity exacerbate diet-induced obesity, metabolic inflammation, and associated sequelae. To test this hypothesis, mice carrying genetically imposed deficiencies or functional mutations in fibrinogen, factor XIII, thrombomod-ulin, or protease-activated receptor-1 (PAR1) were analyzed for changes in body weight gain and altered inflammatory and metabolic parameters in both adipose tissue and liver. Our find-ings provide a mechanistic link between elevated procoagulant function and fibrin(ogen)-driven inflammation in adipose and liver to exacerbation of obesity and obesity-associated sequelae. Further, in proof-of-concept studies using the direct thrombin inhibitor dabigatran etexilate, we demonstrate that inhibiting thrombin activity ameliorates the development of obesity and severity of associated sequelae.
To determine whether the protection from HFD-induced weight gain observed in Fibγ390–396A mice was limited to the spe-cific diet tested, we evaluated weight gain in mice using a sep-arate set of diets. Here, a HFD formulated to 45% of kcal from fat was used with a corresponding CD with 10% of kcal from fat. Similar to analyses using the 60% HFD, Fibγ390–396A mice fed the ly). No genotype-dependent differences in the weight of eWAT
(Figure 2K), iWAT (Figure 2L), or liver (not shown) were observed in tissues harvested at the end of the challenge period for either CD-fed or HFD-fed WT and FibγΔ5 mice. Collectively, these find-ings indicate that the γ390–396 motif of fibrin(ogen) specifically pro-motes HFD-induced obesity.
Figure 2. Fibγ390–396A, but not FibγΔ5, mice are protected from the development of HFD-driven obesity. (A–G) WT and Fibγ390–396A mice were fed either a CD (n = 4
mice per genotype) or a 60% HFD (n = 9 mice per genotype). (A) Mean body weights of WT and fibrinogen γ390396A (Fibγ390-396A) mice over a 20week feeding
period. (B and C) Distribution of body weights for WT and Fibγ390–396A mice fed the CD or 60% HFD at week 4 (B) and week 20 (C) on diet. (D and E) Analysis of
body mass composition of 60% HFD–fed WT and Fibγ390–396A mice performed at week 12 (D) and week 16 (E). (F and G) Total fat pad weights of eWAT (F) and
iWAT (G) for WT and Fibγ390–396A mice at week 20. (H) Mean body weights of WT and fibrinogen γΔ5 (FibγΔ5) mice fed a CD (n = 3 mice per genotype) or 60% HFD
(n = 14–15 mice per genotype) over a 16week feeding period. (I and J) Analysis of individual body weights for WT and FibγΔ5 mice at week 9 (I) and week 16 (J) on
diet. (K and L) Total fat pad weights of eWAT (K) and iWAT (L) for WT and FibγΔ5 mice at week 16. Data are expressed as the mean ± SEM. Data were analyzed by
The Journal of Clinical Investigation
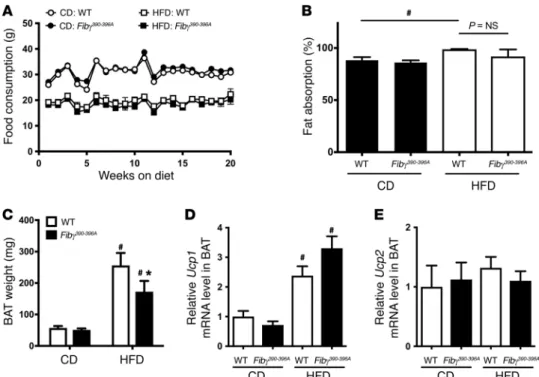
R E S E A R C H A R T I C L EHowever, similarly to WAT, the BAT weights of Fibγ390–396A mice fed a HFD were significantly lower than those in HFD-fed WT mice (Figure 3C). Additionally, no genotype-dependent differ-ences in gene expression of key mediators of thermogenesis (i.e.,
Ucp1 and Ucp2) were observed in HFD-fed WT and Fibγ390–396A mice (Figure 3, D and E, respectively).
The fibrinogen γ390–396 motif supports binding to the coag-ulation transglutaminase factor XIII in addition to binding the leukocyte integrin receptor αMβ2 (23). To determine whether the decrease in body weight following HFD feeding observed in
Fibγ390–396A mice relative to WT mice involved factor XIII, mice deficient in the catalytic A subunit of factor XIII (F13a1–/–) and WT mice were fed the 60% HFD and CD for 20 weeks. In contrast to results with Fibγ390–396A mice, weight gain of F13a1–/– mice was vir-tually identical to that of WT mice (Supplemental Figure 2, A–C). Similarly, there were no genotype-dependent differences in the weight of eWAT or liver for either CD-fed or HFD-fed WT and
F13a1–/– mice (Supplemental Figure 2, D and E, respectively).
Fibγ390–396A mice are protected from the development of HFD-
induced systemic and local inflammation. To determine
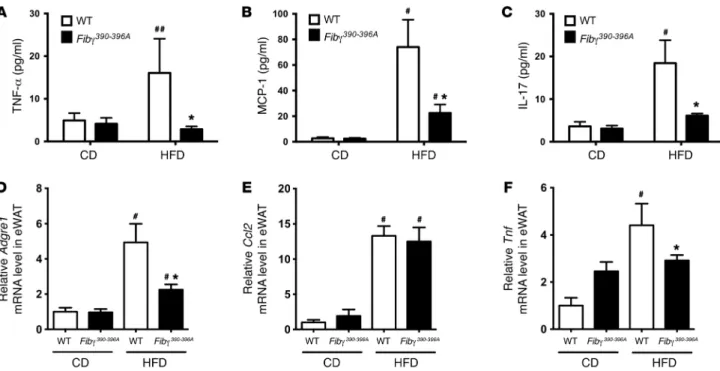
wheth-er the lowwheth-er body weight gain and fatty livwheth-er disease obswheth-erved in HFD-fed Fibγ390–396A mice were indeed linked to a reduction in systemic and local inflammation, we first measured circulat-ing proinflammatory cytokines/chemokines in plasma. TNF-α, MCP-1, and IL-17A have each been linked to exacerbation of obesity-associated sequelae (24–28), and each was significantly 45% HFD gained more weight than those on CD, but,
impor-tantly, gained significantly less weight compared with WT mice fed the 45% HFD (Supplemental Figure 1A; supplemental mate-rial available online with this article; https://doi.org/10.1172/ JCI92744DS1). The significant difference in weight gain was first apparent at 7 weeks on HFD, and the differential increased to the end of the challenge period at 20 weeks (Supplemental Figure 1, B and C, respectively). Analysis of eWAT and iWAT revealed that these tissues had a significantly greater mass in WT mice fed the 45% HFD compared with Fibγ390–396A mice (Sup-plemental Figure 1, D and E, respectively).
The difference in weight gain displayed by the Fibγ390–396A mice on either the 60% or the 45% HFD could not be explained by differences in food consumption (Figure 3A and data not shown, respectively). In addition, the weight gain difference did not appear to be linked to differences in intestinal fat absorp-tion, as no genotype-dependent difference in fat absorption was detected in mice fed a CD or HFD for 16 weeks (Figure 3B). How-ever, HFD-fed WT mice overall displayed significantly higher fat absorption than CD-fed mice (Figure 3B), as previously described (22). Similarly, the difference in HFD-induced weight gain did not appear to be linked to differential compensatory changes in brown adipose tissue (BAT). As expected, the BAT weight in WT mice was significantly higher in HFD-fed animals than in CD-fed animals (Figure 3C). A significant increase was also observed for Fibγ390–396A mice when comparing CD- and HFD-fed animals.
Figure 3. Fibγ390–396A mice consume the same amount of food, have similar intestinal fat absorption, and have reduced brown adipose tissue weight fol-lowing HFD challenge compared with WT mice. (A) Food consumption based on weight of food consumed per mouse per week for WT and Fibγ390–396A mice
fed a CD (n = 4 per genotype) and a 60% HFD (n = 9 per genotype). (B) Intestinal fat absorption using the behenic acid assay (see Methods) for WT and
Fibγ390–396A mice fed either a CD or a 60% HFD for 16 weeks (n = 4 mice per genotype per diet). (C) Brown adipose tissue (BAT) weights of WT and Fibγ390–396A
micefed either a CD (n = 4 mice per genotype) or a 60% HFD (n = 9 mice per genotype). (D and E) Quantitative reverse transcriptase PCR (RTPCR) analysis of BAT from WT and Fibγ390–396A micefed a CD or a HFD for Ucp1 (D) or Ucp2 (E). Data are expressed as the mean ± SEM. Data were analyzed by 2way ANO
similar pattern, with adipocyte area being small in CD-fed mice, significantly elevated in HFD-fed WT mice, but comparatively sig-nificantly lower in HFD-fed Fibγ390–396A mice (Figure 5C). An analy-sis was performed for neutrophils in eWAT, but few if any positive cells were identified in any of the eWAT tissue samples (data not shown). Collectively, these results suggest that Fibγ390–396A mice are protected from the development of inflammation associated with obesity as well as obesity itself.
Fibγ390–396A mice are protected from the development of HFD-
induced fatty liver disease and glucose dysmetabolism. To determine
whether reduced weight gain in HFD-fed Fibγ390–396A mice was linked to protection from the development of obesity sequelae, we first evaluated fatty liver disease. Histological analysis of liv-er sections revealed significant steatosis in HFD-fed WT mice but not in HFD-fed Fibγ390–396A mice (Figure 6A). This tracked with liver weights of HFD-fed Fibγ390–396A mice that were significant-ly lower compared with those of HFD-fed WT mice (Figure 6B). Fibrin(ogen) deposits were absent in livers from CD-fed mice but were readily detected in the liver sinusoids of HFD-fed WT mice around hepatocytes displaying histological evidence of steatosis (Figure 6A). Fibrin(ogen) deposits were detected in the liver sinu-soids of HFD-fed Fibγ390–396A mice (Figure 6A), but like the dimin-ished steatosis, these fibrin(ogen) deposits were also significantly reduced (Figure 6C). Matching the changes in liver histology, liv-er triglycliv-eride levels wliv-ere significantly elevated in HFD-fed WT mice compared with Fibγ390–396A mice (Figure 6D). Notably, the fat-ty liver disease in HFD-fed WT mice was associated with signif-icant hepatocellular damage as indicated by elevated serum ala-nine aminotransferase (ALT; Figure 6E). HFD-fed Fibγ390–396A mice elevated in HFD-fed WT mice compared with CD-fed WT mice
(Figure 4, A–C, respectively). However, circulating levels of these proinflammatory mediators were significantly lower in HFD-fed
Fibγ390–396A mice compared with WT mice (Figure 4, A–C). Proin-flammatory macrophages and effector molecules have been linked to exacerbation of adiposity in diet-driven obesity (29–31). Thus, we examined expression of genes encoding inflammatory markers in eWAT. Here, eWAT mRNA levels of F4/80 (Adgre1) and TNF-α (Tnf) were significantly elevated in HFD-fed WT mice compared with CD-fed WT mice but significantly lower in HFD-fed Fibγ390–396A mice (Figure 4, D and F). MCP-1 mRNA lev-els (Ccl2) in eWAT were not different between HFD-fed WT and
Fibγ390–396A mice, although each was elevated in comparison with corresponding CD-fed animals (Figure 4E).
To further evaluate the effect of the fibrinogen γ390–396A muta-tion on adipose inflammamuta-tion, eWAT tissue secmuta-tions from CD- and HFD-fed mice were stained for adipose tissue macrophages (ATMs) using the macrophage marker F4/80. In CD-fed animals, F4/80+ cells were sparse in both genotypes (Figure 5A). In con-trast, F4/80+ cells were readily detected in eWAT from HFD-fed WT mice and appeared clustered in “crown” structures (Figure 5A). F4/80+ cells were also observed in HFD-fed Fibγ390–396A mice, but appeared fewer in number. Quantification of F4/80+ cells indi-cated a significant increase in cell number for HFD-fed mice over CD-fed mice for both genotypes, although the number of F4/80+ cells was significantly reduced in HFD-fed Fibγ390–396A mice com-pared with HFD-fed WT mice (Figure 5B). Consistent with the notion that fibrin(ogen)-driven macrophage function was promot-ing adiposity, quantification of adipocyte size revealed a strikpromot-ingly
Figure 4. Fibγ390–396A mice develop significantly diminished HFD-induced systemic and adipose inflammation. WT and Fibγ390–396A mice were fed a CD
The Journal of Clinical Investigation
R E S E A R C H A R T I C L Ewere protected from hepatocellular injury as indicated by serum ALT activity equivalent to that of CD-fed mice (Figure 6E). Hepat-ic inflammatory markers were also examined. Levels of Adgre1 mRNA were elevated in HFD-fed mice compared with CD-fed animals, but no genotype-dependent difference was observed (Figure 6F). Significantly reduced hepatic mRNA levels of Ccl2 and Tnf were observed in HFD-fed Fibγ390–396A mice compared WT mice (Figure 6, G and H, respectively). The potential molecular basis of significantly diminished steatosis in Fibγ390–396A mice was revealed through analysis of gene products associated with lipid accumulation/lipogenesis. Hepatic mRNA levels of the nuclear receptor PPARγ (Pparg), the fatty acid sensor CIDEA (Cidea), and the fatty acid transporter CD36 (Cd36) were each significantly lower in HFD-fed Fibγ390–396A mice compared with WT mice (Fig-ure 6, I–K, respectively).
HFD-mediated changes in glucose metabolism were also determined. Analysis of fasting blood glucose levels showed that HFD-fed mice of both genotypes had significantly higher blood glucose levels compared with CD-fed mice (Figure 7A). Impor-tantly, glucose clearance was impaired by HFD challenge, but clearance was significantly more efficient in HFD-fed Fibγ390–396A mice compared with HFD-fed WT mice as analyzed by 2-hour glucose tolerance tests (Figure 7B). Similarly, HFD-fed WT mice displayed a profound loss of insulin sensitivity as shown by insulin tolerance tests compared with CD-fed mice. Insulin sensitivity in HFD-challenged Fibγ390–396A mice was significantly improved com-pared with that in HFD-fed WT mice (Figure 7C). Accordingly, we observed significantly elevated fasting insulin levels in HFD-fed mice compared with CD mice, but insulin levels were significant-ly lower in HFD-fed Fibγ390–396A mice compared with HFD-fed WT mice (Figure 8A). Consistent with differential body weights, the adipokines leptin and resistin were significantly higher in HFD-fed WT mice compared with HFD-HFD-fed Fibγ390–396A mice at 20 weeks
(Figure 8, B and C, respectively). Interestingly, leptin, resistin, and adiponectin were each significantly lower in Fibγ390–396A mice com-pared with WT mice fed a CD (Figure 8, B–D, respectively).
Mice with a genetically imposed procoagulant state exhibit exacerbated obesity following a HFD challenge. The effect of diet and fibrinogen
genotype on coagulation parameters was assessed by measurement of TAT, D-dimer, and platelet factor 4 (PF4) in the plasma of CD-fed and HFD-fed WT and Fibγ390–396A mice. HFD challenge resulted in significantly higher TAT and D-dimer levels in WT mice compared with CD-fed mice (Table 1). Notably, plasma levels of both of these coagulation markers were also elevated in Fibγ390–396A mice fed a HFD compared with a CD (Table 1). Plasma levels of the platelet activation marker PF4 were similar across diet and genotype (Table 1), suggest-ing that differential platelet activation was not the basis of fibrinogen genotype–dependent differences in HFD-induced obesity.
To investigate whether enhanced procoagulant function itself could alter the development of diet-induced obesity and obesity-associated disease sequelae, we evaluated HFD- induced obesity in mice homozygous for a Glu404Pro mutation in the thrombomodulin receptor (ThbdPro). ThbdPro mice exhibit a hypercoagulable state due to significantly reduced thrombin binding and disrupted thrombomodulin-dependent protein C activation by the mutant receptor. Both ThbdPro and WT ani-mals gained significantly more weight on the HFD than cohorts of mice fed a CD (Supplemental Figure 3A). However, ThbdPro mice fed a HFD gained significantly more weight than WT mice fed a HFD (Supplemental Figure 3A). The significant geno-type-dependent difference in body weight was first apparent at approximately 11 weeks on the HFD (Supplemental Figure 3B) and persisted through 16 weeks (Supplemental Figure 3C). MRI-based body mass composition revealed a significant increase in fat mass, but not lean mass, in HFD-fed ThbdPro mice at 12 and 16 weeks (Supplemental Figure 3, D and E, respectively). The Figure 5. Fibγ390–396A mice fed a HFD for 20 weeks have significantly fewer F4/80+ macrophages and reduced adipocyte size relative to HFD-fed WT mice. (A)Tissue sections of eWAT from WT and Fibγ390–396A mice fed either a CD or a 60% HFD for 20 weeks were stained by immunohistochemistry for the mac
rophage marker F4/80. Note that F4/80+ cells (arrows) accumulated in “crownlike” structures similar to the fibrin(ogen) deposits shown in Figure 1. Scale bars: 50 μm. (B) Quantification of the number of F4/80+ cells per ×5 highpowered field in eWAT of WT and Fibγ390–396A mice fed CD (n = 3 per genotype) and
HFD (n = 5 per genotype). Note that 10 fields were evaluated per sample. (C) Quantification of adipocyte area in the eWAT of WT and Fibγ390–396A mice fed CD
Figure 6. Fibγ390–396A mice are protected from the development of HFD-driven fatty liver disease and hepatocellular injury. WT and Fibγ390–396A mice were fed either a CD
(n = 4 per genotype) or a 60% HFD (n = 12 per genotype) for 20 weeks. (A) Representative H&Estained and fibrin(ogen) (red) immu nohistochemistry–stained sections of liver tissue. Note that liver tissue from HFDfed WT mice revealed evidence of hepatic ste atosis and sinusoidal fibrin(ogen) deposits. Scale bars: 100 μm. (B) Total liver weights of mice following the 20week diet challenge. (C) Quantification of fibrin deposits in CDfed (n = 4 per genotype) and HFDfed (n = 8 per genotype) WT and Fibγ390–396A mice. Data
are presented as the mean ± SEM of the percent area of staining per highpowered field. (D) Analysis of liver triglyceride content confirmed significantly diminished hepatic steatosis in HFDfed Fibγ390–396A mice relative
to WT animals. (E) Analysis of circulating alanine aminotransferase (ALT) in CD and HFDfed WT and Fibγ390–396A mice indicated
significantly reduced hepatocellular damage in HFDfed Fibγ390–396A mice. (F–K) Hepatic
levels of mRNA in liver tissue encoding the genes Adgre1 (F), Ccl2 (G), Tnf (H), Pparg (I),
The Journal of Clinical Investigation
R E S E A R C H A R T I C L E(Supplemental Figure 4B). HFD-fed ThbdPro mice had significantly higher liver triglyceride levels than WT mice fed a HFD (Supple-mental Figure 4C). Similarly, HFD-fed ThbdPro mice had signifi-cantly higher ALT levels relative to HFD-fed WT mice and mice fed a CD (Supplemental Figure 4D). Inflammatory genes in the liver were not significantly elevated in HFD-fed ThbdPro mice compared with HFD-fed WT mice (Supplemental Figure 4, E–G). However, hepatic mRNA levels of the lipogenic genes Pparg, Cidea, and Cd36 (Supplemental Figure 4, H–J) were significantly higher in HFD-fed
ThbdPro mice compared with HFD-fed WT mice. Taken together, these data indicate that defective thrombomodulin function exac-erbates obesity-induced fatty liver disease.
HFD studies in ThbdPro and Fibγ390–396A mice suggested that (a) dysregulated thrombin activity promotes obesity and (b) the mechanism of thrombin-driven obesity is linked to fibrinogen. To determine whether the mechanisms of thrombin-driven HFD-induced obesity could also be mediated through the thrombin substrate protease-activated receptor-1 (PAR1), we analyzed HFD-induced obesity using PAR1-deficient mice (F2r–/–). Cohorts of F2r–/– mice and WT mice were fed the same eWAT weights of HFD-fed ThbdPro mice were significantly
ele-vated compared with those of HFD-fed WT mice (Supplemental Figure 3F), and the iWAT weights trended higher (Supplemental Figure 3G). The increase in adiposity for ThbdPro mice was asso-ciated with increased adipose inflammation. Levels of mRNA for F4/80 (Adgre1), MCP-1 (Ccl2), and TNF-α (Tnf) were each significantly elevated in eWAT of HFD-fed ThbdPro mice com-pared with HFD-fed WT mice (Supplemental Figure 3, H–J).
The liver weight of HFD-fed ThbdPro mice was significantly ele-vated compared with that of HFD-fed WT mice (Supplemental Fig-ure 4A). Microscopic analysis of livers from CD-fed WT and ThbdPro mice indicated a normal liver histology (Supplemental Figure 4B), whereas livers from HFD-fed WT mice revealed robust steatosis that was exacerbated in HFD-fed ThbdPro mice (Supplemental Fig-ure 4B). Notably, immunohistochemical analysis of liver sections revealed significant fibrin(ogen) deposits lining the hepatic sinu-soids of HFD-fed WT mice, which appeared elevated in liver sec-tions of HFD-fed ThbdPro mice in terms of both the area and intensity of staining (Supplemental Figure 4B). Liver sections from CD-fed mice revealed little fibrin(ogen) staining regardless of genotype
Figure 7. Fibγ390–396A mice are protected from HFD-induced glucose dysmetabolism and insulin resistance. WT and Fibγ390–396A mice were fed a CD (n = 5
more weight and fat mass compared with mice fed CD (Figure 9F). Importantly, the extent of weight gain in weeks 12–20 was markedly reduced in HFD-fed mice receiving DE compared with mice receiving HFD without DE, a change attributable to reduced accumulation of fat mass, not lean mass (Table 3). Dif-ferences in body weight could not be accounted for by difDif-ferences in food consumption (not shown). Serum ALT activity increased dramatically in mice fed HFD from weeks 12 to 20, denoting the onset of hepatocellular injury and more severe NAFLD (Table 3). Serum ALT failed to increase in HFD-fed DE-treated mice (Table 3), indicating that in addition to limiting HFD-induced adiposity, DE treatment in established obesity suppresses the progression of existing NAFLD. Histological assessment of liver tissue from mice at the end of the 20-week evaluation period indicated lower extent of microvesicular steatosis, the form of lipid accumulation spe-HFD and CD used in Fibγ390–396A and ThbdPro studies (i.e., 60%
of kcal from fat). Consistent with previous studies (32), no gen-otype-dependent difference in weight gain was observed in WT and F2r–/– mice on either diet (Supplemental Figure 5A). Indeed, the weights of individual HFD-fed WT and F2r–/– mice were comparable at multiple weeks on the diet (Supplemental Figure 5, B and C). Further, the weights of eWAT and livers iso-lated from WT and F2r–/– mice at the end of the challenge period were not different between CD-fed or HFD-fed animals (Sup-plemental Figure 5, D and E, respectively).
The direct thrombin inhibitor dabigatran etexilate protects mice from HFD-induced obesity development and successfully treats estab-lished obesity sequelae. In agreement with an earlier report (33), we
found that prophylactic administration of dabigatran etexilate (DE) (7.5 mg/g diet) over the course of 20 weeks attenuated body weight gain (and fat mass) in mice fed a HFD (60% of kcal from fat) (Figure 9, A–C), indicating protection from obesity in 2 distinct HFD-induced obesity models. Our working hypothesis was that the beneficial effect of DE was through prevention of thrombin-mediated fibrin deposi-tion in WAT of HFD-fed mice. DE treatment significantly reduced levels of high–molecular weight fibrin species (defined as >350 kDa) in extracts of eWAT from HFD-fed mice, as determined by capil-lary-based Western blotting (Figure 9D). The absence of these fibrin species in plasma clots formed using F13a1–/– plasma confirmed the identity of these species as prototypical cross-linked fibrin.
To address whether DE could rescue established obesity, mice were fed CD or HFD without the drug for 12 weeks to induce obe-sity (Table 2). The mice then continued to receive the same diet for an additional 8 weeks, but were randomized to receive diet with or without DE during this rescue arm of the study (Figure 9E). As expected, HFD-fed mice without DE continued to gain
Figure 8. Fibγ390–396A mice have significantly diminished HFD-induced levels of circulating adipokines. WT and Fibγ390–396A mice were fed a CD (n = 5
mice per genotype) or a 60% HFD (n = 11–12 mice per genotype) for 20 weeks. Mice were fasted 6 hours before collection of plasma and determination of insulin (A), leptin (B), resistin (C), and adiponectin (D) levels. Data are expressed as the mean ± SEM. Data were analyzed by 2way ANOVA with Student NewmanKeuls post hoc test. *P < 0.05 for analyses comparing differences between genotypes on the same diet. #P < 0.05, ##P < 0.01, ###P < 0.001 for analyses comparing differences between diets with mice of the same genotype.
Table 1. Analysis of TAT, D-dimer, and PF4 in plasma from WT and Fibγ390–396A fed a CD or HFD for 20 weeks
CD HFD
Plasma marker WT Fibγ390–396A WT Fibγ390–396A
TAT (μg/ml) 9.1 ± 1.1 9.7 ± 1.6 17.6 ± 3.5A 18.8 ± 3.8A
D-dimer (ng/ml) 647.7 ± 79.1 469.8 ± 61.2 950.5 ± 52.5B 873.2 ± 130.0A
The Journal of Clinical Investigation
R E S E A R C H A R T I C L E(ogen) is a potent proinflammatory disease modifier of inflamma-tory arthritis, neuroinflammainflamma-tory disease, muscular dystrophy, and colitis (35–38). Here, we show evidence of extensive fibrin-(ogen) deposition in both WAT and liver from obese mice that was absent in nonobese mice. These fibrin(ogen) deposits appeared to serve as foci for the accumulation of macrophages. Importantly, a virtually identical fibrin(ogen) staining pattern was observed in adipose tissue from obese patients, providing direct evidence in support of a role for this provisional matrix protein in human obesity- related disease.
Fibrin(ogen) deposits in tissues may influence the obese phe-notype through several non–mutually exclusive mechanisms. However, our data suggest that a key mechanism of protection from HFD-induced obesity observed in Fibγ390–396A mice is down-cifically associated with the most detrimental manifestations of
NAFLD (data not shown) (34). In addition, DE treatment of HFD-fed mice provided a significant protection from HFD-induced increase in blood glucose levels (Table 3). Collectively, these stud-ies are the first, to our knowledge, to demonstrate that interven-tion with a direct thrombin inhibitor attenuates the progression of HFD- induced obesity and its associated pathologies.
Discussion
A key objective of our studies presented here was to determine whether fibrinogen promotes exacerbation of HFD-induced obe-sity, adipose tissue inflammation, and the downstream develop-ment of metabolic sequelae. Supporting a functional role for fibrin deposits are previous findings indicating extravascular
fibrin-Figure 9. Treatment of mice with DE protects against the development of HFD-driven obesity and limits progression of established obesity. (A–C) Mice were fed a CD, a CD formulated with the direct thrombin inhibitor dabigatran etexilate (DE, 7.5 mg/g), a 60% HFD, or a 60% HFD with DE (7.5 mg/g) (n = 9–10 mice per group). (A) Mean body weights of mice over a 20week feeding period. (B) Body mass composition analysis for fat mass at week 12 on diet. (C) Distribution of body weights at week 20 on diet. (D) Fibrin(ogen) species were detected in clots formed in vitro with plasma from WT and F13a1–/– mice using a capillary
macrophages were observed in the eWAT of HFD-fed Fibγ390–396A mice, which was likely a product of overall reduced inflammation in these animals. In regard to adipocyte function, it is notable that when adipose tissue expands as a consequence of HFD feeding, preadipocytes are programmed to differentiate, permitting a hyperplastic expansion of functional adipocytes that preserves insulin sensitivity. Adipose infiltration by ATMs has been shown to promote an adipogenic deficit by suppressing preadipocyte dif-ferentiation (41, 42). It is possible that WAT fibrin(ogen) deposits promote both production of key proinflammatory soluble media-tors that drive obesity sequelae and ATM-mediated suppression of preadipocyte differentiation.
Our studies directly implicate the γ390–396 motif in fibrin (ogen)-driven HFD-induced obesity. This motif supports binding to the leukocyte integrin receptor αMβ2. A recent study documented significantly diminished adipose tissue inflammation as well as protection from HFD-induced insulin resistance and fatty liver disease in αM-deficient mice, results that are complementary to our data (43). Intriguingly, HFD-fed αM-deficient mice did not show protection from weight gain, suggesting either that various
αM ligands have opposing effects on HFD-induced WAT adipos-ity, or that the γ390–396 motif promotes WAT weight gain through mechanisms separate from αM. In this regard, the β2-integrin fam-ily member αXβ2 (CD11c/CD18) has been shown to bind fibrino-gen through the γ390–396 domain and is expressed by monocytes/ macrophages (44, 45). Inflammatory CD11c+ cells are significantly increased in obese adipose tissue and appear to contribute to the obese phenotype (46–48).
The coagulation transglutaminase factor XIII also binds the fibrinogen γ390–396 motif (23). F13a1 gene expression is significantly upregulated in WAT of both obese patients and mice fed a HFD (49, 50). Further, factor XIII has been suggested to act as a neg-ative regulator of adipogenesis (50). Nevertheless, we show that loss of factor XIII activity does not phenocopy results observed in
Fibγ390–396A mice, as F13a1–/– mice gain the same amount of weight as WT mice following HFD feeding. Collectively these findings suggest that the primary effect of the γ390–396A mutation in obesi-regulation of adipose inflammation and ATM function. This
hypothesis is supported by multiple previous studies. In 2 separate reports, the elimination of macrophages in mice resulted in sig-nificant protection from HFD-induced weight gain and adiposity analogous to the protection from obesity we observed in Fibγ390–396A mice (29, 30). The obesity phenotype is specifically associated with accumulation and activation of M1-polarized proinflammato-ry macrophages, whereas M2-polarized antiinflammatoproinflammato-ry macro-phages are associated with a lean phenotype and protection from obesity (31, 39). It is possible that adipose fibrin(ogen) functions through the γ390–396 motif to drive ATMs to the obese M1 pheno-type. Our gene expression analyses indicating reduced Tnf-α and
Ccl2 mRNA expression in WAT from HFD-challenged Fibγ390–396A mice are consistent with this concept. Fibrin(ogen) γ390–396A may alter obesity by failing to stimulate M1 polarization or by active-ly promoting a protective M2 polarization in adipose. Although additional investigation is required to define the precise impact of fibrin(ogen) on macrophage activation in obesity, it is notable that we did not observe higher levels of M2 markers (e.g., Arg1) in WAT from HFD-challenged Fibγ390–396A mice (data not shown), suggest-ing that fibrin(ogen) γ390–396A expression results in a failure of M1 polarization, rather than an active shift toward an M2 phenotype.
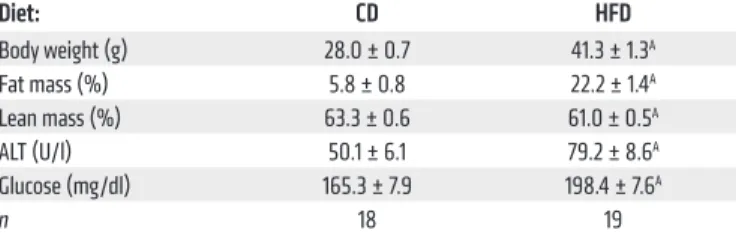
A central question addressed by the current study was how fibrin(ogen) modifies the local expression of soluble mediators that influence the obesity phenotype. Notably, the genetic elimination or pharmacological depletion of either TNF-α or MCP-1 results in significant protection from HFD-induced insulin resistance and NAFLD (24, 26, 40). We observed significantly reduced local expression of Tnf-α mRNA levels in HFD-challenged Fibγ390–396A mice that tracked with protection from the development of glu-cose dysmetabolism and NAFLD. We postulate that the reduction in obesity sequelae is a function of diminished body weight and adiposity in HFD-fed Fibγ390–396A mice. However, the protection from HFD-induced NAFLD may be multifactorial, a product of reduced weight gain and reduced local fibrin-driven inflamma-tion in the liver. Notably, the single loss of either TNF-α or MCP-1 does not confer protection from weight gain and increased adiposity (24, 26, 40). This suggests that fibrin(ogen) alters the function of adipocytes or preadipocytes (a) through a requisite combination of soluble mediators, (b) through ATM-mediated mechanisms beyond the production of proinflammatory media-tors, (c) by directly engaging adipocytes or preadipocytes, or (d) by some combination of these mechanisms. Diminished F4/80+ Table 2. Summary of body weight, body composition, hepatocellular injury (ALT), and glucose for mice fed a CD or HFD for 12 weeks
Diet: CD HFD
Body weight (g) 28.0 ± 0.7 41.3 ± 1.3A
Fat mass (%) 5.8 ± 0.8 22.2 ± 1.4A
Lean mass (%) 63.3 ± 0.6 61.0 ± 0.5A
ALT (U/l) 50.1 ± 6.1 79.2 ± 8.6A
Glucose (mg/dl) 165.3 ± 7.9 198.4 ± 7.6A
n 18 19
Data are presented as the mean ± SEM and analyzed by Student’s t test; AP < 0.05.
Table 3. Summary of body weight, fat and lean mass, hepatocellular injury (ALT), and glucose changes induced by 8-week rescue treatment with DE
Impact of DE treatment (12–20 weeks)
Diet: CD HFD
Rescue: – DE – DE
Δ Body weight (g) 1.5 ± 0.3A 0.8 ± 0.2 7.9 ± 1.0A,B 3.8 ± 1.5A,C
Δ Fat mass (%) 15.1 ± 8.7 8.9 ± 20.9 35.8 ± 11.4A,B 6.9 ± 5.2
Δ Lean mass (%) –0.5 ± 1.0 1.9 ± 1.2 2.9 ± 0.9A,B 3.0 ± 0.8A
Δ ALT (U/l) –38.5 ± 8.5A –9.6 ± 3.1 67.2 ± 28.7A,B 6.6 ± 13.7C
Δ Glucose (mg/dl) 17.3 ± 14.0 –8.4 ± 9.7 36.8 ± 10.4A –11.0 ± 14.2C
N 10 8 9 9
The Journal of Clinical Investigation
R E S E A R C H A R T I C L Eobesity-associated sequelae in mice suggests that targeting throm-bin may be a beneficial therapeutic approach. Previous studies showed that intervention with another thrombin inhibitor, arga-troban, significantly reduced systemic inflammation and plasma cholesterol levels in mice with established hypercholesterolemia and obesity (71). Could the novel oral anticoagulants (NOACs), currently relegated to antithrombotic therapy, be therapeutical-ly beneficial in patients with established obesity? Obesity and its sequelae often coexist with atrial fibrillation, a primary indication for NOAC therapy (72). Notably, weight loss itself has been shown to reduce stroke risk associated with atrial fibrillation (73). Thus, NOAC therapy in patients with an existing indication may confer an additional metabolic benefit. Although the treatment strategy is anchored in strong and reproducible experimental results, the idea of treating patients with metabolic syndrome and obesity with NOACs may be viewed as challenging. However, the overall favorable bleeding risk profile of these agents, together with the emergence of highly specific and efficacious reversal agents for available NOACs, may ultimately tip the risk/benefit balance to favor this possibility.
In this study, we define a novel mechanism of inflammation in experimental obesity mediated by the fibrin(ogen) leukocyte inte-grin αMβ2–binding motif. Through gain- and loss-of-function stud-ies targeting thrombin generation and downstream substrates, these studies are, to our knowledge, the first to ascribe throm-bin-driven obesity to a function of fibrin(ogen) and not PAR1 signaling. Moreover, to our knowledge, these studies are the first to experimentally demonstrate that procoagulant mutations are capable of exacerbating obesity-associated pathologies, authenti-cating association studies in humans (16, 17, 74).
The deciphered mechanism is responsive to modulation with thrombin-targeted FDA-approved therapeutic agents. More spe-cifically, fibrin-driven obesity appears amenable to targeted inhi-bition of the fibrin(ogen) γ390–396 motif. In summary, the thrombin/ fibrin(ogen) axis is not only a critical trigger of HFD-mediated systemic inflammation, but a pharmacologically and genetical-ly adjustable driver of obesity and related pathologies such as NAFLD and glucose dysmetabolism.
Methods
Mice. ThbdPro, Fgg 390–396A (Fibγ390–396A), Fgg Δ5 (FibγΔ5), F13a1–/–, and
F2r–/– mice backcrossed 7 generations to C57BL/6 were all previously
described (20, 21, 75–77). Age-matched littermates of WT and homo-zygous mutant male mice between the ages of 8 and 12 weeks were used. For DE experiments, male C57BL/6J mice at 6 weeks of age were purchased from the Jackson Laboratory and allowed to acclimate in the animal facility for 2 weeks before being enrolled in studies. Mice were housed at an ambient temperature of 22°C with alternat-ing 12-hour light/12-hour dark cycles, and provided water and rodent chow ad libitum before study initiation.
HFD-induced obesity. Mice were fed ad libitum a CD of standard mouse chow that provides about 13% of the kilocalories (kcal) derived from fat (Laboratory Autoclavable Rodent Diet 5010; LabDiet) or a HFD with 60% of the kcal derived from fat (catalog D12492; Research Diets Inc.). In some experiments, mice were fed a CD with 10% of the kcal derived from fat (catalog 56834; Test Diet) or a HFD with 45% of the kcal derived from fat (catalog 55629; Test Diet). In DE studies, mice
ty is not mediated simply by a decrease in factor XIII binding. A recent study by Myneni and colleagues indicated that HFD-fed
F13a1–/– mice gain the same amount of weight as WT mice, aligned with our findings, but that F13a1–/– mice had diminished adipose tissue inflammation and were protected from insulin resistance (51). It was suggested that the mechanism of factor XIII exacer-bation of adipose inflammation and obesity sequelae was linked to fibronectin (51); however, a possible link to fibrin(ogen) was not considered. We postulate that factor XIII may be influencing HFD-induced pathologies through a mechanism whereby cross-linked fibrin drives a greater proinflammatory response and has a greater impact on ATM function than non–cross-linked fibrin, a general hypothesis supported by previous work in our laboratory (52). However, defining the precise interplay of fibrin(ogen) and factor XIII in obesity sequelae, including insulin resistance and NAFLD, remains for future investigation.
The identification of fibrinogen as a potent modifier of obe-sity implicates both upstream coagulation system components and downstream fibrinolytic factors as potential obesity mod-ifiers. In this regard, elevated circulating levels of tissue factor (TF) and factor VII have been documented in obese patients with T2D and in mice fed a HFD (9, 10). High levels of blood-borne TF are considered a biomarker of severe microvascular disease in T2D patients (53, 54). Further, TF mRNA levels and activity are increased in the visceral adipose tissue of obese mice; specifically, TF expression is high in infiltrating ATMs (55, 56). Direct evidence of a causative relationship for TF in obesity was shown in mice lacking the cytoplasmic tail of TF, which con-ferred protection from HFD-induced weight gain and insulin resistance that was linked to TF/factor VIIa–mediated signaling by PAR2 in ATMs (57). Additionally, mice with low TF expres-sion in the bone marrow compartment similarly were protected from HFD-induced weight gain (58). Here, we provide strong evidence that the TF/thrombin/fibrin(ogen) pathway also pro-motes obesity, glucose dysmetabolism, and fatty liver disease. Fibrinolytic/plasminogen activation system components have long been associated with obesity and metabolic syndrome. In particular, plasminogen activator inhibitor-1 (PAI-1) is marked-ly elevated in obese patients and is considered a biomarker of obesity and metabolic syndrome (59–62). Visceral adipose tis-sue is the largest source of PAI-1 in obese patients and is derived from both adipocytes and infiltrating ATMs (62–65). The genet-ic elimination of PAI-1 in mgenet-ice fed a HFD has been shown to result in diminished obesity and insulin resistance in several studies (66–69). In addition, mice deficient in tissue plasmino-gen activator (tPA) were shown to develop exacerbated obesity following HFD challenge (70). Collectively these findings are all consistent with the concept that persistent fibrin deposits drive diet-induced obesity.
after 18 weeks on diet. Human recombinant insulin (Novolin-R; Novo Nordisk) was administered by i.p. injection at a dose of 0.75 U/kg body weight. Blood glucose readings were taken at 15-minute intervals. For both glucose and insulin tolerance tests, AUC was determined for blood glucose profiles from individual mice.
Hepatic triglyceride determination. Hepatic triglyceride content was determined as described previously (78). Briefly, 100 mg of frozen liver tissue was homogenized, mixed with chloroform/methanol (2:1), and incubated overnight at room temperature. Subsequently, H2O was added with collection of the lower lipid phase by centrifugation and vacuum concentration. The lipid pellets were dissolved in a mixture of isopropanol and Triton X-100 and analyzed spectrophotometrical-ly for trigspectrophotometrical-lycerides (600 nm) using commercialspectrophotometrical-ly available reagents (Pointe Scientific).
RNA isolation, cDNA synthesis, and real-time PCR. Total RNA was isolated from 100 mg of tissue using Trizol (Ambion) according to the manufacturer’s protocol. RNA (1 μg) was used for cDNA syn-thesis with a High Capacity cDNA Reverse Transcription kit (Applied Biosystems). Levels of TNF-α (Tnf), MCP-1 (Ccl2), F4/80 (Adgre1), PPARγ (Pparg), CIDEA (Cidea), CD36 (Cd36), UCP1 (Ucp1), UCP2 (Ucp2), and β2-microglobulin (B2m) were determined using TaqMan gene expression assays (Applied Biosystems) on an ABI StepOne Plus sequence detection system (Applied Biosystems). The expression of each gene was normalized relative to B2m expression levels, and rela-tive expression level determined using the Pfaffl method (79).
Detection of fibrin(ogen) by capillary Western blotting. To assess WAT levels of cross-linked high–molecular weight fibrin(ogen), 100 mg of eWAT was homogenized in 8 M urea, 40 mM DTT, 12.5 mM EDTA based on protocols outlined previously (23, 80), rotated end over end in a 60°C incubator for 2 hours, and incubated stationary at 60°C overnight (~15 hours). Samples were collected by centrifu-gation and resolved on Wes 66- to 440-kDa 25-microcapillary gels (Protein Simple). Fibrin(ogen) was detected with polyclonal rabbit anti–human fibrinogen antibody (reference A0080; Dako) per the manufacturer’s protocol (Protein Simple). To identify precise spe-cies, in vitro fibrin polymerization was performed using citrated WT and F13a1–/– mouse plasma, stimulated with human α
-throm-bin (2 U/ml final) (Enzyme Research Laboratories) in a CaCl2 (10 mM final) buffer for 30 minutes at 37°C. Samples were processed in urea/DTT/EDTA buffer, and fibrin(ogen) species were detected using capillary Western blot.
Intestinal fat absorption. Mice were fed with a CD or 60% HFD for 16 weeks, after which a diet containing 5% sucrose polybehenate, a nonabsorbable food additive, was fed to the mice ad libitum for 3 days. Fecal pellets were collected on days 3 and 4. Fat absorption was calcu-lated from the ratios of behenic acid to other fatty acids in the diet and in the feces by gas chromatography of fatty acid methyl esters.
Statistics. In studies in which the weights of mice over time were determined, the data were analyzed by repeated-measures ANOVA. Comparison of 2 groups was performed using a 2-tailed Student’s t test. Comparison of 3 or more groups was performed using 1-way or 2-way ANOVA and Student-Newman-Keuls post hoc test. P values for all comparisons are indicated in the figure legends, but for all analyses the criterion for statistical significance was P less than 0.05.
Study approval. Mice were maintained in Association for Assessment and Accreditation of Laboratory Animal Care International–accredited facilities and approved by the IACUC at Cincinnati Children’s Hospital were fed a 60% HFD (catalog 112252; Dyets Inc.) identical to catalog
D12492 from Research Diets Inc. with or without 7.5 mg/g DE. Control mice were fed modified AIN-93M CD (Dyets Inc., 10% of kcal derived from fat) with or without 7.5 mg/g DE. Both the HFD and the CD with and without DE were formulated to contain 1% peanut flavoring to mask the bitter taste of the drug. Note that terminal circulating DE concentrations were determined for each group and found to be 388.2 and 248.0 ng/ml for the CD and HFD groups, respectively, in the pro-phylactic study and 327.0 and 358.2 ng/ml for the CD and HFD groups, respectively, in the rescue study. The total body weight of mice and weight of food consumed were determined weekly. Whole body com-position analysis was determined as indicated using a 3-in-1 analyzer for fat mass, lean mass, and water (EchoMRI or Bruker NMR). At the end of the observation period, mice were euthanized for collection of citrate plasma, serum, and organ harvest. The weight of eWAT, iWAT, BAT, and liver was determined at harvest.
Histopathology and clinical chemistry. Mouse eWAT and a medi-al or left latermedi-al lobe of the liver were used for histologicmedi-al anmedi-alysis. Biopsy samples of human visceral adipose and liver were obtained from the Cincinnati Children’s Hospital Pediatric Obesity Tissue Repository from obese patients with either normal liver histology or a histologically confirmed diagnosis of NASH. Tissue sections of visceral adipose from nonobese individuals were obtained from Origene. Formalin-fixed tissue sections (5 μm) were stained with
H&E or by immunohistochemistry with either a rabbit
polyclon-al anti–mouse fibrinogen antibody (previously described in ref. 36) or a monoclonal anti–human fibrinogen antibody (reference A0080; Dako). Fibrin(ogen) staining was quantified using ImageJ (NIH). Epididymal adipose sections stained with F4/80 (catalog MCA497G; Bio-Rad Laboratories) were scanned and digitized using a Virtual Slide System VS110 (Olympus). The area of individual adi-pocytes was calculated using Olympus cellSens Dimension Desk-top Software (version 1.15). Specifically, 50 individual adipocytes selected from at least 5 different areas of the digitized sections were analyzed per sample.
For genetically modified mice, blood was collected at the end of the observation period from the inferior vena cava in citrate. For studies where mice were treated with DE-containing chow, blood was collected by retro-orbital bleeding after 12 weeks on CD or HFD and analyzed for serum alanine aminotransferase (ALT) and glu-cose levels. ELISA analysis was used to determine the plasma levels of TAT complexes (Siemens Enzygnost TAT kit), D-dimer (Biomatik Mouse D-dimer kit), and PF4 (RayBio Mouse PF-4 ELISA kit). Serum ALT activity was determined using a commercially available reagent (Thermo Fisher Scientific). Plasma cytokines, chemokines, and adi-pokines were determined using Milliplex Magnetic Bead multiplex or single-plex kits (Millipore) and read using a Bio-Plex (Bio-Rad Labo-ratories). Concentrations were calculated from standard curves using recombinant proteins and expressed in picograms per milliliter or micrograms per milliliter.
The Journal of Clinical Investigation
R E S E A R C H A R T I C L E1. Li C, et al. Surveillance of certain health behav-iors and conditions among states and selected local areas — Behavioral Risk Factor Surveillance System, United States, 2009. MMWR Surveill
Summ. 2011;60(9):1–250.
2. Hotamisligil GS. Inflammation and metabolic disorders. Nature. 2006;444(7121):860–867. 3. Cao H, et al. Regulation of metabolic responses
by adipocyte/macrophage fatty acid-binding proteins in leptin-deficient mice. Diabetes. 2006;55(7):1915–1922.
4. Neels JG, Pandey M, Hotamisligil GS, Samad F. Autoamplification of tumor necrosis factor-α: a potential mechanism for the maintenance of elevat-ed tumor necrosis factor-α in male but not female obese mice. Am J Pathol. 2006;168(2):435–444. 5. Carolan E, et al. The impact of childhood obesity
on inflammation, innate immune cell frequency, and metabolic microRNA expression. J Clin
Endocrinol Metab. 2014;99(3):E474–E478.
6. Cao H. Adipocytokines in obesity and metabolic disease. J Endocrinol. 2014;220(2):T47–T59. 7. Gregor MF, Hotamisligil GS. Inflammatory
mechanisms in obesity. Annu Rev Immunol. 2011;29:415–445.
8. Finucane MM, et al. National, regional, and global trends in body-mass index since 1980: systematic analysis of health examination sur-veys and epidemiological studies with 960 coun-try-years and 9·1 million participants. Lancet. 2011;377(9765):557–567.
9. Morange PE, Alessi MC. Thrombosis in central obesity and metabolic syndrome: mecha-nisms and epidemiology. Thromb Haemost. 2013;110(4):669–680.
10. Kahn SE, Hull RL, Utzschneider KM. Mechanisms linking obesity to insulin resistance and type 2 dia-betes. Nature. 2006;444(7121):840–846. 11. Kopp CW, et al. Weight loss reduces tissue
factor in morbidly obese patients. Obes Res. 2003;11(8):950–956.
12. Christiansen SC, et al. The relationship between body mass index, activated protein C resistance and risk of venous thrombosis. J Thromb
Hae-most. 2012;10(9):1761–1767.
13. Klovaite J, Benn M, Nordestgaard BG. Obesity as a causal risk factor for deep venous thrombosis: a Mendelian randomization study. J Intern Med. 2015;277(5):573–584.
14. Dehlendorff C, Andersen KK, Olsen TS. Body mass index and death by stroke: no obesity para-dox. JAMA Neurol. 2014;71(8):978–984. 15. Stalls CM, Triplette MA, Viera AJ, Pathman DE,
Cohen MG, Rossi JS. The association between body mass index and coronary artery disease severity: a comparison of black and white patients. Am Heart J. 2014;167(4):514–520. 16. de Moerloose P, Wutschert R, Heinzmann M,
Perneger T, Reber G, Bounameaux H. Superficial vein thrombosis of lower limbs: influence of fac-tor V Leiden, facfac-tor II G20210A and overweight.
Thromb Haemost. 1998;80(2):239–241.
17. Avellone G, et al. Effects of heparin treatment on hemostatic abnormalities in obese non-insu-lin-dependent diabetic patients. Metab Clin Exp. 1997;46(8):930–934.
18. Papatheodoridis GV, et al. Thrombotic risk fac-tors and liver histologic lesions in non-alcoholic fatty liver disease. J Hepatol. 2009;51(5):931–938. 19. Murano I, et al. Dead adipocytes, detected as
crown-like structures, are prevalent in visceral fat depots of genetically obese mice. J Lipid Res. 2008;49(7):1562–1568.
20. Flick MJ, et al. Leukocyte engagement of fibrin(o-gen) via the integrin receptor alphaMbeta2/Mac-1 is critical for host inflammatory response in vivo.
J Clin Invest. 2004;113(11):1596–1606.
21. Holmbäck K, Danton MJ, Suh TT, Daugherty CC, Degen JL. Impaired platelet aggregation and sustained bleeding in mice lacking the fibrin-ogen motif bound by integrin αIIbβ3. EMBO J. 1996;15(21):5760–5771.
22. Mao J, et al. Overnutrition stimulates intestinal epi-thelium proliferation through β-catenin signaling in obese mice. Diabetes. 2013;62(11):3736–3746. 23. Aleman MM, et al. Factor XIII activity mediates
red blood cell retention in venous thrombi. J Clin
Invest. 2014;124(8):3590–3600.
24. De Taeye BM, et al. Macrophage TNF-α contrib-utes to insulin resistance and hepatic steatosis in diet-induced obesity. Am J Physiol Endocrinol
Metab. 2007;293(3):E713–E725.
25. Endo M, Masaki T, Seike M, Yoshimatsu H.
TNF-α induces hepatic steatosis in mice by enhancing gene expression of sterol regulatory element binding protein-1c (SREBP-1c). Exp Biol Med
(Maywood). 2007;232(5):614–621.
26. Kanda H, et al. MCP-1 contributes to macrophage
infiltration into adipose tissue, insulin resistance, and hepatic steatosis in obesity. J Clin Invest. 2006;116(6):1494–1505.
27. Takahashi K, et al. Adiposity elevates plas-ma MCP-1 levels leading to the increased CD11b-positive monocytes in mice. J Biol Chem. 2003;278(47):46654–46660.
28. Harley IT, et al. IL-17 signaling accelerates the progression of nonalcoholic fatty liver disease in mice. Hepatology. 2014;59(5):1830–1839. 29. Bu L, Gao M, Qu S, Liu D. Intraperitoneal
injec-tion of clodronate liposomes eliminates visceral adipose macrophages and blocks high-fat diet- induced weight gain and development of insulin resistance. AAPS J. 2013;15(4):1001–1011. 30. Lee B, Qiao L, Kinney B, Feng GS, Shao J. Macrophage depletion disrupts immune balance and energy homeostasis. PLoS One. 2014;9(6):e99575.
31. Kitade H, et al. CCR5 plays a critical role in obesity-induced adipose tissue inflammation and insulin resistance by regulating both macro-phage recruitment and M1/M2 status. Diabetes. 2012;61(7):1680–1690.
32. Kassel KM, et al. Protease-activated receptor 1 and hematopoietic cell tissue factor are required for hepatic steatosis in mice fed a Western diet.
Am J Pathol. 2011;179(5):2278–2289.
33. Kopec AK, et al. Thrombin inhibition with dab-igatran protects against high-fat diet-induced fatty liver disease in mice. J Pharmacol Exp Ther. 2014;351(2):288–297.
34. Tandra S, et al. Presence and significance of microvesicular steatosis in nonalcoholic fatty liver disease. J Hepatol. 2011;55(3):654–659. 35. Adams RA, et al. The fibrin-derived
gamma377-395 peptide inhibits microglia activation and suppresses relapsing paralysis in central ner-vous system autoimmune disease. J Exp Med. 2007;204(3):571–582.
36. Flick MJ, et al. Fibrin(ogen) exacerbates inflam-matory joint disease through a mechanism linked to the integrin alpha(M)beta(2) binding motif.
J Clin Invest. 2007;117(11):3224–3235.
37. Steinbrecher KA, et al. Colitis-associated cancer is dependent on the interplay between the hemo-static and inflammatory systems and supported by integrin alpha(M)beta(2) engagement of fibrinogen. Cancer Res. 2010;70(7):2634–2643.
Acknowledgments
We thank Carolina Cruz, Alice Jone, Cheryl Rewerts, Traci Stankiewicz, and Maureen Shaw for their excellent technical assis-tance. This work was supported by a research contract from Boeh-ringer Ingelheim (to JPL), grants DK099222 (to SD), ES017537 (to JPL), and HL112603 (to MJF) from the NIH, and a Pilot and Feasibility grant (to MJF) through NIH grant P30 DK078392 of the Digestive Diseases Research Core Center at Cincinnati Children’s Hospital Medical Center.
Address correspondence to: Matthew J. Flick, Division of Exper-imental Hematology and Cancer Biology, Cincinnati Children’s Hospital, 3333 Burnet Avenue, Cincinnati, Ohio 45229-3039, USA. Phone: 513.636.6628; Email: [email protected].
Research Foundation or the IACUC at Michigan State University. The Cincinnati Children’s Hospital Medical Center IRB approved studies involving the analysis of human tissue samples. Deidentified samples were obtained through the Pediatric Obesity Tissue Repository at the Cincinnati Children’s Hospital Medical Center.