Confirmatory Factor Analysis of Sizing Me Up:
Validation of an Obesity-Specific Health-Related
Quality of Life Measure in Latino Youth
Gina L. Tripicchio,
1MS, MSED, Kelsey B. Borner,
2MA,
Cathleen Odar Stough,
3P
HD, Katrina Poppert Cordts,
2MA,
Meredith Dreyer Gillette,
4,5P
HD, and Ann M. Davis,
4,6P
HD, MPH, ABPP
1Department of Nutrition, Gillings School of Global Public Health, University of North Carolina at Chapel Hill, 2Clinical Child Psychology Program, University of Kansas, 3Behavioral Medicine and Clinical Psychology,
Cincinnati Children’s Hospital Medical Center, 4Center for Children’s Healthy Lifestlyes & Nutrition, 5Developmental and Behavioral Sciences, Children’s Mercy and6Department of Pediatrics, University of Kansas
Medical Center
All correspondence concerning this article should be addressed to Gina L. Tripicchio, MS, MSED, Department of Nutrition, Gillings School of Global Public Health, 2224 McGavran-Greenberg, Campus Box #7461, University of North Carolina at Chapel Hill, Chapel Hill, NC 27599-7461, USA. E-mail: [email protected]
Received May 19, 2016; revisions received October 21, 2016; accepted October 23, 2016
Abstract
Objectives This study aims to validate an obesity-specific health-related quality of life (HRQOL) measure, Sizing Me Up (SMU), in treatment-seeking Latino youth. Pediatric obesity has been associated with reduced HRQOL; therefore, valid measures are important for use in diverse populations that may be at increased risk for obesity and related comorbidities. Methods Structural equation modeling tested the fit of the 5-subscale, 22-item SMU measure in Latino youth, 5–13 years of age, with obesity (N ¼204). Invariance testing was conducted to examine equivalence between Latino and non-Latino groups (N ¼250).Results SMU achieved accept-able fit in a Latino population [v2 ¼ 428.33, df ¼ 199, p < .001, Root Mean Squared Error of Approximation ¼ 0.072 (0.062–0.082), Comparative Fit Index ¼ 0.915, Tucker–Lewis Index ¼
0.901, Weighted Root Mean Square Residual¼1.2230]. Additionally, factor structure and factor loadings were invariant across Latino and non-Latino groups, but thresholds were not invariant. Conclusions SMU is a valid measure of obesity-specific HRQOL in treatment-seeking Latino youth with obesity.
Key words: assessment; at-risk youth; children; obesity quality of life.
Introduction
Minority children are disproportionately affected by overweight and obesity (Ogden, Carroll, Kit, & Flegal, 2014). According to a report from 2011 to 2014, 17% of youth in the United States have obesity, and prevalence of Latino youth with obesity is signifi-cantly higher; 21.9% of Latino children have obesity compared with 14.7% of non-Latino, White counter-parts (Ogden, Carroll, Fryar, & Flegal, 2015). The
etiology of childhood obesity is complex, and a myr-iad of factors contribute to increased caloric consump-tion and decreased energy expenditure in children (Lytle, 2009). Monitoring and treatment of excess weight are imperative, as obesity and related diseases track into adulthood (Larson & Story, 2008). Physical health comorbidities associated with pediatric obesity can be severe, including hypertension, dyslipidemia, insulin resistance, and type 2 diabetes (Deckelbaum &
VCThe Author 2016. Published by Oxford University Press on behalf of the Society of Pediatric Psychology.
All rights reserved. For permissions, please e-mail: [email protected] 457 Advance Access Publication Date: 21 December 2016
Original Research Article
Williams, 2001;Freedman, Mei, Srinivasan, Berenson, & Dietz, 2007). However, the negative consequences of obesity extend beyond medical outcomes. Undoubtedly, obesity also contributes to poor emo-tional health for youth and is often associated with increased depressive symptoms, poor self-esteem, and increased body dissatisfaction, among other negative psychosocial outcomes (Jelalian, Hart, & Rhee, 2009; Speiser et al., 2005). Therefore, in addition to measur-ing obesity-specific physiological changes, psychoso-cial factors such as health-related quality of life (HRQOL) have received heightened attention as im-portant constructs to monitor during pediatric obesity treatment (Schwimmer, Burwinkle, & Varni, 2003).
HRQOL is the perceived impact of a health condi-tion on a person’s funccondi-tioning and satisfaccondi-tion in mul-tiple domains of life, including physical, social, and emotional (Williams, Wake, Hesketh, Maher, & Waters, 2005). Children with obesity report poorer HRQOL compared with normal weight counterparts (Tsiros et al., 2009). It has been recommended that disease-specific measures be used when assessing HRQOL or as a complement to generic HRQOL measures (Quittner, Davis, & Modi, 2003; Spieth & Harris, 1996). These measures can provide clinically significant information about aspects of functioning impacted by a specific disease and may be more sensi-tive to change over time or treatment (Matza, Swensen, Flood, Secnik, & Leidy, 2004).
To address these needs and characterize children’s overall self-perception in the context of one’s weight, weight-specific measures of HRQOL have been de-veloped. Ahuja and colleagues conducted a compre-hensive review of patient-reported outcomes for children and adolescents with obesity (Ahuja et al., 2014) and identified four instruments that assess obesity-specific HRQOL within a youth population: Sizing Me Up (SMU) and Sizing Them Up (Zeller & Modi, 2009); Impact of Weight on Quality of Life-Kids (Kolotkin et al., 2006); KINDL Quality of Life obesity module (Ravens-Sieberer, Gortler, & Bullinger, 2000); and Youth Quality of Life—Weight module (Morales, Edwards, Flores, Barr, & Patrick, 2011). Measures ask children with obesity to rate their HRQOL in the context of physical size (e.g., “. . . be-cause of my size”) to demonstrate how physical size impacts daily functioning. SMU is a novel, obesity-specific HRQOL measure that can be used in younger children (5–13 years of age), making it particularly useful in treatment studies (Zeller & Modi, 2009.). Generally, replicating the factor structure of health-specific measures in diverse populations is not only important for validating the use of the measure in rep-resentative samples but also for increasing the number of tools available for understanding relationships be-tween factors influencing health.
To our knowledge, none of the current obesity-specific HRQOL measures has been validated in a Latino youth population. Thus, the validation of SMU is critically important, as Latino youth may vary in their self-reported obesity-specific HRQOL because of differences in semantic and cultural interpretation of survey items (Chavez & Oetting, 1995). Previous re-search to culturally adapt a general QOL measure found that modifications in various domains were needed for the measure to be equivalent for Puerto Rican and Mexican American children (Chavez, Matıas-Carrelo, Barrio, & Canino, 2007). It is also important to examine whether constructs of obesity-specific HRQOL are the same in Latino youth, and whether the relationships between HRQOL and weight may be different for this group.
While previous researchers have reported low HRQOL levels among Hispanic youth with over-weight and obesity (Arif & Rohrer, 2006), HRQOL measures have not been adequately validated in this population, limiting the application of previously re-ported results. SMU was originally validated in a sam-ple of 141 treatment-seeking Black and White children with obesity, resulting in a five-factor structure with 22 items. The purpose of the current study was to val-idate SMU in a treatment-seeking population of Latino youth, 5–13 years old, with obesity. Specifically, a confirmatory factor analysis (CFA) in a structural equation modeling (SEM) framework was conducted to examine fit of the current model in this population. Confirmatory factor analysis is a theoret-ically driven technique that tests the degree to which a set of data fit a specified model (Thompson, 2004). Additionally, the factor structure was replicated in a sample of non-Latino youth, and measurement invari-ance testing was conducted to investigate equivalent model fit and specification across groups.
Methods
Participants
Participants included 204 Latino and 250 non-Latino children with obesity, participating in one of two larger family-based behavioral weight management programs: Healthy Hawks (HH) at the University of Kansas Medical Center (Kansas City, KS), or Promoting Health in Teens and Kids (PHIT Kids) at Children’s Mercy Kansas City (Kansas City, MO). While families were eligible to enroll children with a body mass index (BMI) over the 85th percentile, a ma-jority of the sample was classified as obese, and only 5.2% of children (N¼25) were overweight. The lack of representation of youth with BMI in the 85th–95th percentile would prevent conclusions from being gen-eralizable, and the sample was too small for invariance testing or subgroup analyses by weight classification.
Thus, only children with a BMI 95th percentile were included in the current analysis. Moreover, this more closely replicates the sample used in the initial validation study.
Participant characteristics are presented inTable I. Continuous measures are presented as means (M) and standard deviations (SD) and categorical measures are presented as percentages. Latino participants were 62.3% male (Mage¼10.25,SD¼1.94), with an aver-age BMI percentile of 98.52 (SD¼1.03). Participants in the non-Latino sample were 34.4% male (M age¼
11.28, SD ¼ 1.79), with a mean BMI percentile of 98.98 (SD ¼ 0.88) and a racial/ethnic breakdown of 56.0% Black, 40.0% White, and 4.0% other. About 90% of the Latino and 53.4% of the non-Latino sam-ple reported using Medicaid, financial support services, or not having insurance.
Procedures
Participation in HH or PHIT Kids required an eligible child, as well as at least one parent’s agreement to at-tend weekly sessions. Participants were excluded if the parent’s primary language was not English or Spanish, or if the child had a diagnosis that would make partici-pation in a group difficult (e.g., autism spectrum dis-order, bipolar disorder and schizophrenia). The primary reason a child was excluded was not a specific diagnosis, but whether he or she could participate in a group setting without additional staff support. Based on referral tracking from one clinic, for every three families invited to participate, approximately one child was enrolled into a treatment program and
completed baseline measures (32.7% participation rate). The parent portion of each program was offered in both English and Spanish, while children completed program sessions and all measures in English. All baseline measures, including SMU, were administered and collected at the beginning of the first session after parents provided consent and children (if appropriate) provided assent. The institutional review board at the University of Kansas Medical Center and at Children’s Mercy Kansas City approved study procedures. Additional information about the HH and PHIT Kids programs has been published elsewhere (Davis et al., 2013;Hampl et al., 2016).
Measures Demographics
Parents reported race/ethnicity, age, and gender for themselves and their children. It should be noted that for the purposes of this article, the term “Latino” is used to categorize race/ethnicity and includes partici-pants who self-identified as “Hispanic or Latino.”
Anthropometrics
Trained program staff measured height and weight while participants wore light clothing and no shoes. Height was measured in centimeters using a stadiome-ter (Holtain Ltd., Crymych, Dyfed, UK), and weight was measured in kilograms using a digital scale (Temp-StikDigitron 8000 digital scale National Medical Corp., Temp-Stikcorp). BMI z-scores and percentiles were calculated using appropriate age- and sex-specific cutoffs for height and weight (Ogden et al., 2002).
Sizing Me Up
Obesity-specific HRQOL was assessed using SMU, a 22-item self-report questionnaire designed for 5–13-year-old children with obesity (Zeller & Modi, 2009). Items asked the respondent to rate his or her HRQOL in the context of physical size (“. . . because of your size”) according to an ordinal scale with the following response options: 1¼None of the time; 2¼A little; 3
¼A lot; and 4¼All the time. Children were adminis-tered the questionnaire in small groups based on age. Younger children had the questionnaire read aloud and received assistance completing responses. Older children were read the directions aloud and then com-pleted the questionnaire independently. Study staff was available to answer any questions and provided assistance as needed.
The SMU measure consists of five subscales: Emotional Functioning, Physical Functioning, Social Avoidance, Positive Social Attributes, and Teasing/ Marginalization. The scale also provides a total HRQOL score. Items on the Positive Social Attributes scale are reverse coded and an overall lower total
Table I.Descriptive Characteristics for the Latino and
Non-Latino Samples
Demographics
Latino (N¼204)
Non-Latino (N¼250)
Age (years) 10.361.9 11.361.8 Gender
Male 62.3% 34.4%
Female 37.8% 65.6%
Race/ethnicity
Latino/Hispanic 100.0%
Black 56.0%
White 40.0%
Other 4.0%
BMI (%) 98.561.0 99.060.9
Languagea
English 22.6% 99.6%
Spanish 77.4% 0.4%
Insurance status Medicaid/ No Insurance/ Financial Support
90.7% 53.4%
Private/commercial 9.3% 46.6%
Note.BMI¼body mass index;N¼202 for Latino response to Language;N¼249 for non-Latino response to Insurance Status.
aLanguage indicates parent language preference when they
self-selected into groups (Spanish or English) for the program.
HRQOL score reflects poorer obesity-specific HRQOL. The Emotional Functioning scale targets self-perceptions of how children’s size makes them feel (i.e., sad, mad, frustrated, and worried), whereas the Physical Functioning scale captures self-perceptions of how size impacts daily physical activities related to comfort and ability (e.g., getting out of breath, unable to fit in desk at school). The Social Avoidance scale measures self-perception of avoiding age-specific activities because of size (e.g., avoiding gym or recess, not going to school, and feeling uncomfortable sleep-ing at a friend’s house), and the Positive Social Attributes scale focuses on self-perceptions of positive attributes in the context of size (e.g., sense of humor, self-liking, and healthiness). Finally, the Teasing/ Marginalization scale measures self-perceptions of teasing by peers because of size (i.e., were teased by others or felt left out). The five subscales and their corresponding items are described in Table II, with permission from the original authors. SMU demon-strated adequate test–retest reliability (intraclass correlation coefficients¼.53–.78) and internal con-sistency (alpha coefficients ¼ .68–.85) in the initial validation of White and Black children with obesity
(Streiner, 2003). Good convergent validity was also demonstrated with the Pediatric Quality of Life Inventory (correlation coefficients r ¼ .35–.65), a generic HRQOL measure (Zeller & Modi, 2009).
Data Analyses
Children with a BMI 95th percentile between the ages of 5 and 13 years, who completed the SMU meas-ure, were included in the validation sample. A CFA was performed using SEM procedures to assess the goodness of fit of the original factor structure in a Latino sample. Model specifications included corre-lated factors, uncorrecorre-lated error terms, and factor variances set to 1. Items were classified as categorical to account for the ordinal nature of the responses. Weighted least squares with mean and variance ad-justment estimation procedures were used, as this esti-mator tends to be more appropriate for data that are categorical or not normally distributed (Muthe´n & Muthe´n, 1998-2011; Schmitt, 2011). Pairwise dele-tion was used to handle missing data, and only 12.7% of study participants (N ¼ 26) had missing data points.
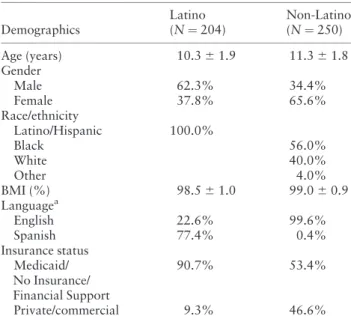
Table II. Sizing Me Up Subscales With Corresponding Internal Consistency Estimated With Cronbach’s Alpha, and
Individual Items With Factor Loadings for the Latino Sample [14]
Subscales with individual items Cronbach’s
alpha (a)
Factor loading (SE)
Emotional functioning .85
Q2 Felt sad because of your size 0.78 (0.04)***
Q4 Felt mad because of your size 0.85 (0.03)***
Q9 Felt frustrated or sad because of your size 0.92 (0.03)***
Q10 Felt worried because of your size 0.81 (0.04)***
Physical functioning .79
Q6 Found it hard to swing, climb, skip, bounce a ball, or jump rope because of your size
0.70 (0.05)***
Q12 Had problems fitting into your desk at school because of your size 0.77 (0.07)*** Q15 Were teased by other kids when physically active (e.g., move your body)
because of your size
0.86 (0.04)***
Q20 Found it hard to keep up with other kids because of your size 0.79 (0.04)*** Q21 Got out of breath and had to slow down because of your size 0.65 (0.05)***
Teasing/marginalization .52
Q1 Were teased by other kids because of your size 0.75 (0.05)***
Q5 Felt left out because of your size (e.g., no one talks or sits with you) 0.71 (0.07)***
Positive social attributes .70
Q3 Were told you are healthy or growing well 0.48 (0.06)***
Q7 Like yourself because of your size 0.89 (0.04)***
Q8 Stood up for or helped other kids because of your size 0.29 (0.07) ***
Q13 Felt happy because of your size 0.86 (0.04)***
Q14 Were picked first for recess or gym because of your size 0.31 (0.08)***
Q16 Felt you had a good sense of humor 0.40 (0.07)***
Social avoidance .60
Q11 Choose not to go to school because of your size 0.73 (0.07)*** Q17 Did not want to go to the swimming pool or park because of your size 0.36 (0.08)*** Q18 Felt uncomfortable sleeping at a friend’s house because of your size 0.62 (0.07)*** Q19 Got upset at mealtimes (e.g., cried, fussed, and argued) 0.74 (0.05)*** Q22 Chose not to participate in gym or recess at school because of your size 0.52 (0.08)***
Note. Q¼question number; SE¼standard error. ***p<.001.
Model fit statistics were used to evaluate the degree to which the hypothesized model fit the observed data. All models were evaluated by examining the (chi-squarev2) test of significance, which provides a precise measure of the difference between the implied model and observed data. Because thev2 statistic may be sensi-tive to large degrees of freedom and sample size, additional measures of model fit were examined, including the Root Mean Squared Error of Approximation (RMSEA), Comparative Fit Index (CFI), Tucker–Lewis Index (TLI), and Weighted Root Mean Square Residual (WRMR) (Little, 2013). Model fit was considered to have acceptable fit if the RMSEA was<.08 (good<.06); CFI and TLI values were deemed acceptable >.90 (good >.95) (Hu & Bentler, 1999;Reeve et al., 2007). WRMR has been identified as an indicator of model fit for categorical data and data that are not normally distributed; WRMR<1.0 are deemed acceptable (Cook, Kallen, & Amtmann, 2009).
Measurement invariance was conducted to deter-mine if the parameters of the model were equivalent between Latino and non-Latino groups. To assess in-variance, configural, metric, and scalar models were analyzed using a multigroup CFA with the delta par-ameterization. The configural model (Model 1), which is the least restrictive, constrains the factor pattern to be equal across groups; the metric model (Model 2) constrains the factor pattern and factor loadings; the scalar model (Model 3), which is the most restrictive, constrains factor patterns, loadings, and thresholds to be equal across groups.
All analyses were conducted using Mplus version 7 (Muthe´n, 1998-2011).
Results
Confirmatory Factor Analysis
The initial 22-item, 5-factor SMU model was tested in the Latino sample. This model achieved “acceptable” fit based on RMSEA (<0.08), CFI (>0.90), and TLI (>0.90) fit criteria:v2¼428.33,df¼199,p<.001,
RMSEA¼0.072 (0.062–0.082), CFI¼0.915, TLI¼
0.901, WRMR¼1.223. Standardized factor loadings ranged from 0.29 to 0.92 and all were significant (p<
.001;Table II). The SMU model was also tested in the non-Latino sample and again achieved “acceptable” fit based on RMSEA, CFI, and TLI fit criteria: v2 ¼
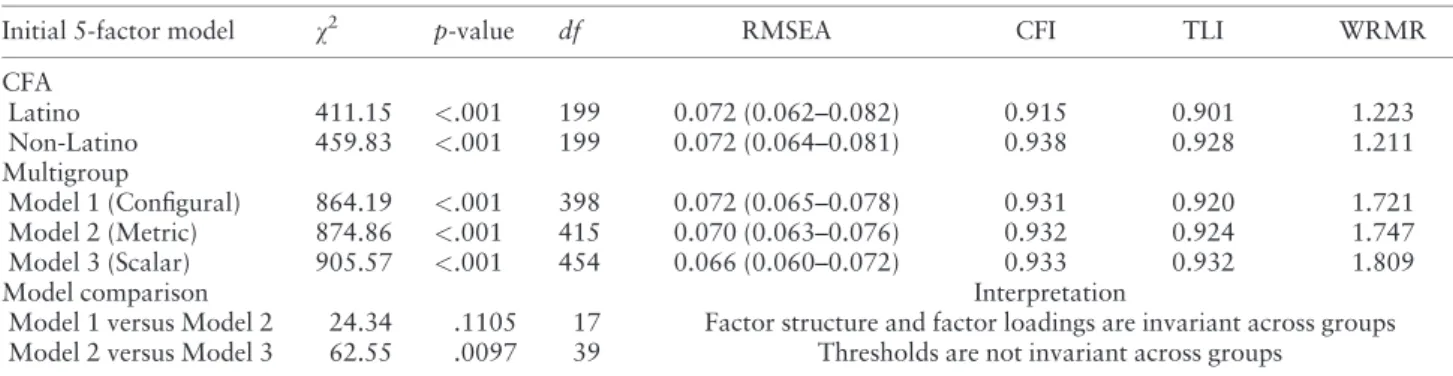
459.83,df¼199,p<.001, RMSEA¼0.072 (0.064– 0.081), CFI¼0.938, TLI¼0.928, WRMR¼1.211. Model fit statistics for the confirmatory factor ana-lyses are presented inTable III.
Measurement Invariance
Measurement invariance testing was conducted in Latino and non-Latino groups to determine if the in-terpretation of the SMU questions and underlying la-tent constructs were similar, or invariant, across groups. To assess invariance, multiple models with varying constraints were tested. Model 1 tested the same factor structure and had acceptable fit as indi-cated by RMSEA, CFI, and TLI: (v2 ¼864.19,df ¼
398, p <.001, RMSEA ¼ 0.072 (0.065–0.078), CFI
¼0.931, TLI ¼ 0.920, WRMR ¼ 1.721). Model 2 tested the same factor structure and factor loadings, and also had acceptable fit as indicated by RMSEA, CFI, and TLI: (v2 ¼ 874.86, df ¼ 415, p < .001, RMSEA ¼0.070 (0.063–0.076), CFI ¼0.932, TLI ¼
0.924, WRMR ¼1.747). Finally, Model 3 tested the same factor pattern, loadings, and thresholds, and again had acceptable fit as indicated by RMSEA, CFI, and TLI: (v2¼905.57,df¼454,p<.001, RMSEA¼
0.066 (0.060–0.072), CFI ¼ 0.933, TLI ¼ 0.932, WRMR ¼ 1.809). A v2 test was used to compare Models 1 and 2, and found the two models to be in-variant, indicating there is no difference in factor structure and factor loadings between groups (p ¼
0.1105). However, when comparing Model 2 with Model 3, the models were significantly different, indi-cating that thresholds did differ by group (p ¼
0.0097). All tests are presented inTable III.
Table III.Model Fit Indices for the Confirmatory Factor Analyses and Measurement Invariance Tests
Initial 5-factor model v2 p-value df RMSEA CFI TLI WRMR
CFA
Latino 411.15 <.001 199 0.072 (0.062–0.082) 0.915 0.901 1.223 Non-Latino 459.83 <.001 199 0.072 (0.064–0.081) 0.938 0.928 1.211 Multigroup
Model 1 (Configural) 864.19 <.001 398 0.072 (0.065–0.078) 0.931 0.920 1.721 Model 2 (Metric) 874.86 <.001 415 0.070 (0.063–0.076) 0.932 0.924 1.747 Model 3 (Scalar) 905.57 <.001 454 0.066 (0.060–0.072) 0.933 0.932 1.809
Model comparison Interpretation
Model 1 versus Model 2 24.34 .1105 17 Factor structure and factor loadings are invariant across groups Model 2 versus Model 3 62.55 .0097 39 Thresholds are not invariant across groups
Note. CFA¼confirmatory factor analysis; CFI¼comparative fit index;v2¼chi-square;df¼degrees of freedom; RMSEA¼root mean squared error of approximation; TLI¼Tucker–Lewis index; WRMR¼Weighted Root Mean Square Residual.
Internal Consistency
Cronbach’s alpha was used to assess the reliability of the scale’s internal consistency. The alphas (a) for the Latino sample are Emotional Functioning (a ¼ .85), Physical Functioning (a ¼ .79), Teasing/ Marginalization (a ¼ .52), Positive Social Attributes (a¼.70), and Social Avoidance (a¼.60). The coeffi-cient alphas for the non-Latino sample are Emotional Functioning (a¼.88), Physical Functioning (a¼.80), Teasing/Marginalization (a ¼ .71), Positive Social Attributes (a¼.61), and Social Avoidance (a¼.75). Internal consistency values are presented inTable II.
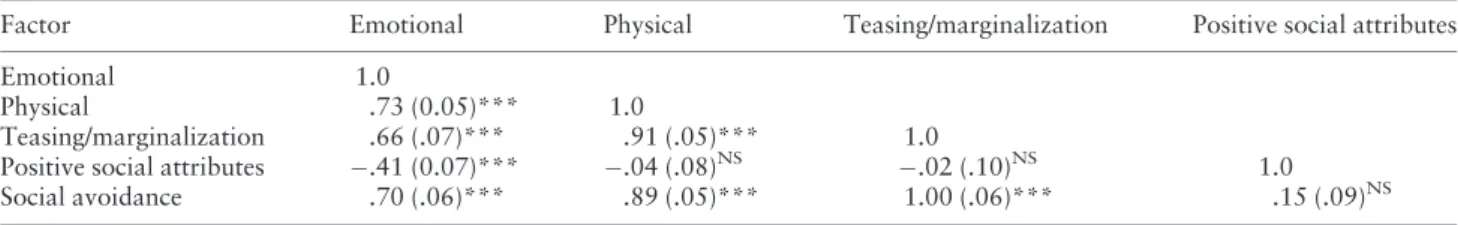
Interfactor Correlations
Correlations between subscales in the final Latino model are presented in Table IV. The Emotional Functioning subscale was positively associated with all other subscales: Physical Functioning (r¼.73,p<
.001), Teasing/Marginalization (r ¼ .66, p < .001), Positive Social Attributes (r ¼ .41, p < .001), and Social Avoidance (r ¼ .70, p < .001). The Positive Social Attributes subscale was not associated with Physical Functioning (r ¼ .04, p ¼ .64), Teasing/ Marginalization (r ¼ .02, p < .82), or Social Avoidance (r ¼ .15, p ¼ .10). Physical Functioning was highly correlated with Teasing/Marginalization (r ¼.91,p<.001) and Social Avoidance (r¼.89,p<
.001). However, the highest correlation was between Teasing/Marginalization and Social Avoidance (r ¼
1.00,p<.001). A correlation of 1 indicates that these subscales are indistinguishable. While this might not be the case for all youth, it is interesting to note that the Latino children in this sample did not differentiate the concepts associated with these constructs.
Discussion
The purpose of this study was to validate the factor structure of SMU, a self-reported 22-item, 5-factor, obesity-specific, HRQOL measure in Latino youth, 5– 13 years of age. The initial model did have acceptable fit in this population based on RMSEA, CFI, and TLI fit indices, and all factor loadings were statistically sig-nificant. The v2 test was significant; however, thev2
test is influenced by sample size, and conclusions are commonly drawn from other fit indices (Bowen, &
Guo 2012). The SMU measure was empirically and theoretically justified during its development. Therefore, even though model fit was not optimal ac-cording to some indices, no additional justifications for modifications to improve model fit were deemed reasonable.
Measurement invariance testing indicated that the factor structure and factor loadings were equivalent across Latino and non-Latino groups, but thresholds were not. Scalar model fit is often rejected, and factor loadings have been discussed as the most important for establishing invariance (Vandenberg & Lance, 2000). This level of invariance also provides sufficient support for practical application, as equivalent factor loadings indicate that items relate to factors in similar ways across groups (Millsap, 2011). However, this could limit the ability to conduct group mean com-parisons, and might indicate that group mean differ-ences are biased or potentially influenced by differential additive response bias, a concern in cross-cultural research (Gregorich, 2006).
When examining the subscales in the Latino sam-ple, the Positive Social Attributes subscale demon-strates mostly negative, nonsignificant correlations with all other subscales except Emotional Functioning. The Positive Social Attributes scale assesses a child’s emotions and self-perceived social strengths in the context of their size. The lack of sig-nificant correlations with other subscales might indi-cate that Latino children with obesity do not associate their positive social attributes with their weight status or that their feelings about their positive attributes in the context of their weight are not associated with other weight-related perceptions. The Positive Social Attributes subscale and its corresponding items might not be capturing an independent construct of obesity-specific HRQOL and warrant further examination.
The Teasing/Marginalization and Social Avoidance subscales were highly correlated in the Latino sample (r¼1.00, p<.001), and had the lowest Cronbach’s alpha values (a¼.52 anda¼.60). These are the only two subscales with values <0.70 (a range of 0.70– 0.95 is typically considered acceptable) (Bland & Altman, 1997). However, as was done in this study, it is recommended that an SEM framework be used to
Table IV.Standardized Intrafactor Correlations of the Model in the Latino Sample
Factor Emotional Physical Teasing/marginalization Positive social attributes
Emotional 1.0
Physical .73 (0.05)*** 1.0
Teasing/marginalization .66 (.07)*** .91 (.05)*** 1.0
Positive social attributes .41 (0.07)*** .04 (.08)NS .02 (.10)NS 1.0
Social avoidance .70 (.06)*** .89 (.05)*** 1.00 (.06)*** .15 (.09)NS
Note. NS = Non-significant. ***p<.001.
assess the underlying assumptions of coefficient alpha, as it can vary based on number of items per scale, average item correlation, and uncorrelated error as-sumptions (Yang & Green, 2011). The SEM factor loadings for Teasing/Marginalization ranged from 0.71 to 0.75 and loadings on the Social Avoidance scale ranged from 0.36 to 0.74; all were significant. Therefore, other factors might be influencing the lower alpha value. First, the Teasing/Marginalization scale only has two items. Additionally, the high correl-ation between the two subscales could indicate that Latino youth do not separately distinguish these con-structs or their corresponding items, and this could be contributing to the low alphas as well. Though these subscales are acceptable when assessing the overall model fit, strategies to refine self-report measures could be valuable in helping researchers tailor subscale items and improve fit in Latino youth. For example, focus groups could be conducted to better understand the content and terminology of the subscales, while more specific approaches such as cognitive interview-ing could be used to examine individual items (Jobe, 2003). These qualitative research strategies imple-mented with a diverse population of youth with obes-ity, regarding their perspectives on teasing, marginalization, and social avoidance in the context of their weight status, could help refine the existing measure.
Although this study did not include overweight children, another study tested the validation of the SMU measure in a non-treatment-seeking community sample of predominately White children (54.4%) with overweight and obesity, aged 8–12 years, and found the total score of the SMU to be an acceptable meas-ure of obesity-specific HRQOL (Cushing & Steele, 2012). Our study extends the application of the SMU measure by deeming it acceptable for use in Latino youth with obesity. However, to date, these are the only two studies that have validated this measure, and future studies should aim to examine the application of SMU in a wider range of ages, race/ethnicities, and among treatment-seeking and community-based populations.
The current study has several limitations. First, the use of a self-report measure could lead to biased re-sponses because of social desirability. Second, the level of acculturation of participating families, and other culturally driven factors influencing perceived obesity-specific HRQOL, was not assessed. Maternal accul-turation has been associated with child-feeding prac-tices and consequently child weight status (Kaiser, Melgar-Quinonez, Lamp, Johns, & Harwood, 2001). Understanding acculturation could also provide in-sight into how youth perceive their own weight status in comparison with peers of different ethnic origins. Third, although parent language preference was
assessed, child language preference was not, and all children completed the measure in English. Therefore, comprehension or interpretation of the questions could have varied for children for whom English is a second language. Additionally, though assistance was provided in completing the questionnaire, literacy lev-els may be lower among children who are bilingual in their nonpreferred language, limiting the understand-ing of the items (Hoff, 2013). Finally, all children in the current study were treatment seeking and may dif-fer in their perceptions of their weight status and HRQOL in comparison with non-treatment-seeking obese children.
This study indicates that SMU is an appropriate measure for assessing obesity-specific HRQOL in treatment-seeking Latino youth with obesity. Future research should aim to discern the constructs of Positive Social Attributes, Teasing/Marginalization, and Social Avoidance and should validate the SMU measure in more diverse groups of children. Researchers and clinicians can use this measure to bet-ter understand the relationship between weight status and HRQOL, and to assess the effect of treatment programs on obesity-specific HRQOL. This study serves as an important step in providing a tool that can be used to better understand and measure obesity-specific HRQOL in Latino youth, who are dispropor-tionately affected by obesity and its related comorbidities.
Acknowledgements
The authors would like to acknowledge the support of our funders, and thank all of the families and staff who make our programs possible.
Funding
Funding for this study was provided by the Healthcare Foundation of Greater Kansas City and the Greater Kansas City YMCA.
Conflict of Interest: None declared.
References
Ahuja, B., Klassen, A. F., Satz, R., Malhotra, N., Tsangaris, E., Ventresca, M., & Fayed, N. (2014). A review of patient-reported outcomes for children and adolescents with obesity.Quality of Life Research,23, 759–770. doi: 10.1007/s11136-013-0459-9
Arif, A. A., & Rohrer, J. E. (2006). The relationship between obesity, hyperglycemia symptoms, and health-related quality of life among Hispanic and non-Hispanic white children and adolescents.BMC Family Practice,7, 3. doi: 10.1186/1471-2296-7-3
Bland, J. M., & Altman, D. G. (1997). Cronbach’s alpha.
BMJ,314, 572.
Bowen, N. K., & Guo, S. (2012).Structural equation model-ing. New York, NY: Oxford University Press.
Chavez, E. L., & Oetting, E. R. (1995). A critical incident model for considering issues in cross-cultural research. Failures in cultural sensitivity. The International Journal of the Addictions,30, 863–874.
Chavez, L. M., Matıas-Carrelo, L., Barrio, C., & Canino, G. (2007). The cultural adaptation of the youth quality of life instrument-research version for Latino children and ado-lescents.Journal of Child and Family Studies,16, 72–86. Cook, K. F., Kallen, M. A., & Amtmann, D. (2009). Having
a fit: Impact of number of items and distribution of data on traditional criteria for assessing IRT’s unidimensionality assumption. Quality of Life Research,18, 447–460. doi: 10.1007/s11136-009-9464-4
Cushing, C. C., & Steele, R. G. (2012). Psychometric proper-ties of sizing me up in a community sample of 4th and 5th grade students with overweight and obesity. Journal of Pediatric Psychology, 37, 1012–1022. doi: 10.1093/ jpepsy/jss075
Davis, A. M., Daldalian, M. C., Mayfield, C. A., Dean, K., Black, W. R., Sampilo, M. L.. . ., , & Suminski, R. (2013). Outcomes from an urban pediatric obesity program target-ing minority youth: The healthy Hawks program.
Childhood Obesity, 9, 492–500. doi: 10.1089/ chi.2013.0053
Deckelbaum, R. J., & Williams, C. L. (2001). Childhood obesity: The health issue. Obesity Research, 9(Suppl 4), 239S–243S. doi: 10.1038/oby.2001.125
Freedman, D. S., Mei, Z., Srinivasan, S. R., Berenson, G. S., & Dietz, W. H. (2007). Cardiovascular risk factors and ex-cess adiposity among overweight children and adolescents: The Bogalusa heart study.The Journal of Pediatrics,150, 12–17. e12. doi: 10.1016/j.jpeds.2006.08.042
Gregorich, S. E. (2006). Do self-report instruments allow meaningful comparisons across diverse population groups? Testing measurement invariance using the confirmatory fac-tor analysis framework. Medical Care, 44(11 Suppl 3), S78–S94., doi: 10.1097/01.mlr.0000245454.12228.8f Hampl, S., Odar Stough, C., Poppert Cordts, K., Best, C.,
Blackburn, K., & Dreyer Gillette, M. L. (2016). Effectiveness of a hospital-based multidisciplinary pediat-ric weight management program: Two-year outcomes of PHIT kids. Childhood Obesity,12, 20–25. doi: 10.1089/ chi.2014.0119
Hoff, E. (2013). Interpreting the early language trajectories of children from low-SES and language minority homes: Implications for closing achievement gaps.Developmental Psychology,49, 4–14. doi: 10.1037/a0027238
Hu, L. T., & Bentler, P. M. (1999). Cutoff criteria for fit indexes in covariance structure analysis: Conventional cri-teria versus new alternatives. Structural Equation Modeling-a Multidisciplinary Journal, 6, 1–55. doi: 10.1080/10705519909540118
Jelalian, E., Hart, C. N., & Rhee, K. (2009). Treatment of pediatric obesity.Medicine and Health, Rhode Island,92, 48–49.
Jobe, J. B. (2003). Cognitive psychology and self-reports: Models and methods. Quality of Life Research, 12, 219–227.
Kaiser, L. L., Melgar-Quinonez, H. R., Lamp, C. L., Johns, M. C., & Harwood, J. O. (2001). Acculturation of Mexican-American mothers influences child feeding strat-egies.Journal of the American Dietetic Association,101, 542–547. doi: 10.1016/S0002-8223(01)00136-5
Kamath, C. C., Vickers, K. S., Ehrlich, A., McGovern, L., Johnson, J., Singhal, V.. . ., , , , & Montori, V. M. (2008). Clinical review: Behavioral interventions to prevent child-hood obesity: A systematic review and metaanalyses of randomized trials.The Journal of Clinical Endocrinology and Metabolism, 93, 4606–4615. doi: 10.1210/jc.2006-2411
Kolotkin, R. L., Zeller, M., Modi, A. C., Samsa, G. P., Quinlan, N. P., Yanovski, J. A.. . ., , , , & Roehrig, H. R. (2006). Assessing weight-related quality of life in adoles-cents.Obesity (Silver Spring),14, 448–457. doi: 10.1038/ oby.2006.59
Larson, N., & Story, M. (2008). The adolescent obesity epi-demic: Why, how long, and what to do about it.
Adolescent Medicine: State of the Art Reviews, 19, 357–379, vii.
Little, T. D. (2013).Longitudinal structural equation model-ing. New York, NY: The Guilford Press
Lytle, L. A. (2009). Examining the etiology of childhood obesity: The IDEA study.American Journal of Community Psychology, 44, 338–349. doi: 10.1007/s10464-009-9269-1
Matza, L. S., Swensen, A. R., Flood, E. M., Secnik, K., & Leidy, N. K. (2004). Assessment of health-related quality of life in children: A review of conceptual, methodological, and regulatory issues. Value in Health, 7, 79–92. doi: 10.1111/j.1524-4733.2004.71273.x
Millsap, R. E. (2011).Statistical approaches to measurement invariance. New York, NY: Taylor & Francis Group. Morales, L. S., Edwards, T. C., Flores, Y., Barr, L., &
Patrick, D. L. (2011). Measurement properties of a multi-cultural weight-specific quality-of-life instrument for chil-dren and adolescents. Quality of Life Research, 20, 215–224. doi: 10.1007/s11136-010-9735-0
Muthe´n, B. O., & Muthe´n, L. K. (1998-2011).Mplus User’s Guide(6th ed.). Los Angeles, CA: Muthe´n & Muthe´n. Ogden, C. L., Carroll, M. D., Fryar, C. D., & Flegal, K. M.
(2015). Prevalence of obesity among adults and youth: United States, 2011-2014.NCHS Data Brief, 219: 1–8. Ogden, C. L., Carroll, M. D., Kit, B. K., & Flegal, K. M.
(2014). Prevalence of childhood and adult obesity in the United States, 2011-2012. JAMA, 311, 806–814. doi: 10.1001/jama.2014.732
Ogden, C. L., Kuczmarski, R. J., Flegal, K. M., Mei, Z., Guo, S., Wei, R.. . ., , , , & Johnson, C. L. (2002). Centers for disease control and prevention 2000 growth charts for the United States: Improvements to the 1977 national center for health statistics version.Pediatrics,109, 45–60. Quittner, A. L., Davis, M. A., & Modi, A. C. (2003).
Health-related quality of life in pediatric populations. In M. Roberts (Ed.), Handbook of pediatric psychology. (pp. 696–709). New York, NY: Guilford Publications.
Ravens-Sieberer, U., Gortler, E., & Bullinger, M. (2000). Subjective health and health behavior of children and adolescents—A survey of Hamburg students within the scope of school medical examination [in German].
Gesundheitswesen, 62, 148–155. doi: 10.1055/s-2000-10487
Reeve, B. B., Hays, R. D., Bjorner, J. B., Cook, K. F., Crane, P. K., Teresi, J. A.. . ., , , , , , , , , Cella, D., & PROMIS Cooperative Group. (2007). Psychometric evaluation and calibration of health-related quality of life item banks: Plans for the Patient-Reported Outcomes Measurement Information System (PROMIS).Medical Care,45(5 Suppl 1), S22–S31. doi: 10.1097/01.mlr.0000250483.85507.04 Schmitt, T. A. (2011). Current methodological
consider-ations in exploratory and confirmatory factor analysis.
Journal of Psychoeducational Assessment, 29, 304–321. doi: 10.1177/0734282911406653
Schwimmer, J. B., Burwinkle, T. M., & Varni, J. W. (2003). Health-related quality of life of severely obese children and adolescents. JAMA, 289(14), 1813–1819. doi: 10.1001/ Jama.289.14.1813
Speiser, P. W., Rudolf, M. C., Anhalt, H., Camacho-Hubner, C., Chiarelli, F., Eliakim A.. . ., , , , , , , , , , , , , , , , , , & Hochberg, Z.; Obesity Consensus Working Group (2005). Childhood obesity.The Journal of Clinical Endocrinology and Metabolism, 90, 1871–1887. doi: 10.1210/jc.2004-1389
Spieth, L. E., & Harris, C. V. (1996). Assessment of health-related quality of life in children and adolescents: An inte-grative review. Journal of Pediatric Psychology, 21, 175–193.
Streiner, D. L. (2003). Starting at the beginning: An introduc-tion to coefficient alpha and internal consistency.Journal of Personality Assessment, 80, 99–103. doi: 10.1207/ S15327752JPA8001_18
Thompson, B. (2004).Exploratory and confirmatory factor analysis: Understanding concepts and applications. Washington DC.: American Psychological Association. Tsiros, M. D., Olds, T., Buckley, J. D., Grimshaw, P.,
Brennan, L., Walkley, J.. . ., , , & Coates, A. M. (2009). Health-related quality of life in obese children and adoles-cents.International Journal of Obesity,33, 387–400. doi: 10.1038/ijo.2009.42
Vandenberg, R. J., & Lance, C. E. (2000). A review and syn-thesis of the measurement invariance literature: Suggestions, practices, and recommendations for organiza-tional research.Organizational Research Methods,3, 4–69. Williams, J., Wake, M., Hesketh, K., Maher, E., & Waters, E. (2005). Health-related quality of life of overweight and obese children. JAMA, 293, 70–76. doi: 10.1001/ jama.293.1.70
Yang, Y., & Green, S. . (2011). Coefficient alpha: A reliabil-ity coefficient for the 21st century? Journal of Psychoeducational Assessment,27, 377–392.
Zeller, M. H., & Modi, A. C. (2009). Development and ini-tial validation of an obesity-specific quality-of-life measure for children: Sizing me up. Obesity (Silver Spring), 17, 1171–1177. doi: 10.1038/oby.2009.47
![Table II. Sizing Me Up Subscales With Corresponding Internal Consistency Estimated With Cronbach’s Alpha, and Individual Items With Factor Loadings for the Latino Sample [14]](https://thumb-us.123doks.com/thumbv2/123dok_us/8292574.2196008/4.892.82.805.578.1060/subscales-corresponding-internal-consistency-estimated-cronbach-individual-loadings.webp)