arXiv:1510.01514v1 [astro-ph.GA] 6 Oct 2015
using deep
Hubble
+
Spitzer
/IRAC observations
Stephen M. Wilkins
1⋆, Rychard J. Bouwens
2, Pascal A. Oesch
3, Ivo Labb´e
2,
Mark Sargent
1, Joseph Caruana
4, Julie Wardlow
5, Scott Clay
11Astronomy Centre, Department of Physics and Astronomy, University of Sussex, Brighton, BN1 9QH, UK 2Leiden Observatory, Leiden University, P.O. Box 9513, 2300 RA Leiden, The Netherlands
3Yale Center for Astronomy and Astrophysics, Yale University, P.O. Box 208120, New Haven, CT 06520, USA 4Leibniz-Institut fur Astrophysik, An der Sternwarte 16, D-14482 Potsdam, Germany
5Dark Cosmology Centre, Niels Bohr Institute, University of Copenhagen, Denmark
7 October 2015
ABSTRACT
Measurements of theU V-continuum slopesβ provide valuable information on the physical properties of galaxies forming in the early universe, probing the dust redden-ing, age, metal content, and even the escape fraction. While constraints on these slopes generally become more challenging at higher redshifts as the UV continuum shifts out of the Hubble Space Telescopebands (particularly at z >7), such a characterisation actually becomes abruptly easier for galaxies in the redshift window z = 9.5−10.5 due to the Spitzer/IRAC 3.6µm-band probing the rest-UV continuum and the long wavelength baseline between this Spitzer band and the HubbleHf160w band. Higher S/N constraints on βare possible atz∼10 than atz= 8. Here we take advantage of this opportunity and five recently discovered brightz= 9.5−10.5 galaxies to present the first measurements of the mean β for a multi-object sample of galaxy candidates at z ∼ 10. We find the measured βobs’s of these candidates are −2.1 ±0.3±0.2 (random and systematic), only slightly bluer than the measured β’s (βobs ≈ −1.7) at 3.5 < z <7.5 for galaxies of similar luminosities. Small increases in the stellar ages, metallicities, and dust content of the galaxy population from z∼10 to z ∼7 could easily explain the apparent evolution inβ.
Key words:
galaxies: high-redshift – ultraviolet: galaxies – galaxies: ISM
1 INTRODUCTION
Thanks to extremely sensitive near-infrared (NIR) imaging obtained using Wide Field Camera 3 (WFC3) on the
Hub-ble Space Telescope it is now possible to routinely identify
galaxies at very high redshift (z >6: e.g., Oesch et al. 2010; Bunker et al. 2010; Wilkins et al. 2010; Wilkins et al. 2011a; Bouwens et al. 2011b; Finkelstein et al. 2010, 2012; Oesch et al. 2012; McLure et al. 2013; Schmidt et al. 2014) with the first samples now being identified atz∼10 and beyond, less than 500 Myr after the Big Bang (Bouwens et al. 2011a; Zheng et al. 2012; Ellis et al. 2013; Oesch et al. 2013, 2014, 2015b; Zitrin et al. 2014; Ishigaki et al. 2015; Bouwens et al. 2015b).
One area of significant interest in the study of distant
⋆ E-mail: [email protected]
(Shim et al. 2011; Schaerer & de Barros 2010; Wilkins et al. 2013b), but now seems clear fromz ∼6 toz∼2 (Stark et al. 2013; Gonzalez et al. 2014; Schaerer & de Barros 2013; Labb´e et al. 2013; Smit et al. 2014; Salmon et al. 2015).
The spectral characteristics of galaxies at z ∼ 8 and z ∼ 8.5 have also been explored (Bouwens et al. 2010, 2013; Finkelstein et al. 2010, 2012; Dunlop et al. 2013), but are more difficult to robustly quantify due to the lim-ited leverage in wavelength available for constraining these slopes and corrections required to remove the impact of the IGM absoprtion (Bouwens et al. 2014a). This is particularly true forU V-continuum slope determinations atz∼8.5-9.5. Given the challenges in deriving the spectral characteristics of galaxies atz∼8.5-9.5, it may seem that further advances may need to wait until the James Webb Space Telescope
(JWST).
Fortunately, as we will show, we can make immediate progress on this issue by taking advantage of the deep IRAC observations available for galaxy samples atz∼10 from the
Spitzer Space Telescope. Over the redshift intervalz∼
9.5-10.5, theHubbleH-band band and the IRAC 3.6µm band fall in theU V-continuum. The wavelength leverage is sufficient between these bands that one can plausibly quantify the UV-continuum slopes of galaxies more accurately atz∼10 than is possible atz ∼8 and especially atz∼8.5-9, as we demonstrate in§2.2 of this paper.
Opportunities to use z ∼ 10 samples to perform such studies now exist thanks to the deep near-IR data avail-able from Hubble in the Cosmic Assembly Near-Infrared Deep Extragalactic Survey (CANDELS, Grogin et al. 2011; Koekemoer et al. 2011),HubbleUltra-Deep Field 2009/2012 programs (Bouwens et al. 2011; Koekemoer et al. 2013; El-lis et al. 2013)1, and Cluster Lensing and Supernovae
sur-vey with Hubble (CLASH: Postman et al. 2012) programs. The samples range from particularly faint sources over the HUDF/XDF (Ellis et al. 2013; Oesch et al. 2013) and the Frontier Fields (Zitrin et al. 2014) to brighter sources lo-cated over CANDELS (Oesch et al. 2014) and CLASH (e.g. Zheng et al. 2012, Coe et al. 2013, and Zitrin et al. 2014).2 Particularly valuable for probing the spectral charac-teristics of galaxies in the early universe are those z ∼10 candidates that are intrinsically bright or lensed, since those sources have sufficient S/N with IRAC that one can use them to quantify the meanU V-continuum slope of galaxies at very early times. To date, five such galaxies have been identified in the magnitude range 26-27 mag from the CAN-DELS fields (Oesch et al. 2014) and behind lensing clusters (Zheng et al. 2012).
In this paper, we make use of these 5 particularly bright z∼10 candidates to derive, for the first time, the meanU V -continuum slopeβatz∼10 for a multi-object sample. We compare the observed properties with predictions from
re-1 The HUDF12 programme obtained Y
f105wandJf160w. Both
the HUDF09 and HUDF12 observations, along with imaging from various other sources have been released as part of the eXtreme Deep Field (XDF) project (Illingworth et al. 2013).
2 It is important to note that not all such candidates necessarily
lie atz∼10; indeed UDFj-39546284 (Bouwens et al. 2011a) for instance, which was initially reported to be az∼10 candidate, no longer has a favoured high-redshift identification (Ellis et al. 2013; Brammer et al. 2013, Bouwens et al. 2013a).
cent cosmological galaxy formation simulations to provide some context. Such simulations are valuable given that the U V-continuum slopes and U V-optical colours can be af-fected by a complex mixture of different factors including the joint distribution of stellar masses, ages, metallicities, and the escape fraction – which makes it difficult to inter-pret the observations in terms of a single variable (Bouwens et al. 2010; Wilkins et al. 2011).
This paper is organised as follows: in Section 2 we de-scribe recent observations of candidatez∼10 star forming galaxies. In Section 3 we interpret observations of these sys-tems in the context of dust emission. Finally, in Section 4 we present our conclusions. Throughout this work magnitudes are calculated using the AB system (Oke & Gunn 1983). In calculating absolute magnitudes we assume a ΩM = 0.3,
ΩΛ= 0.7,h= 0.7 cosmology.
2 OBSERVATIONS OF THE UV-CONTINUUM SLOPE
2.1 Data and Sample Selection
This paper is based on the brightz ∼10 galaxy sample se-lected over the GOODS fields from Oesch et al. (2014) as well thez ∼9.6 CLASH source behind MACS1149 identi-fied in Zheng et al. (2012). For details on the datasets, we refer the reader to the discovery papers. We summarise the photometry of these sources in Table 1.
In brief, the candidates from Oesch et al. (2014) were identified using the completeHubbledataset from the CAN-DELS survey (Grogin et al. 2011, Koekemoer et al. 2011) in addition to ancillary Advanced Camera for Surveys (ACS) data mostly from the GOODS survey. The central area of the GOODS-South and North fields represent the CANDELS Deep survey, which reach to Hf160w= 27.8 mag (5σ), while
the outer regions are covered with slightly shallower data Hf160w= 27.1 mag. Galaxy candidates atz∼10 were
iden-tified based on the spectral break shortward of Lyman-α resulting in a red color of (Jf125w−Hf160w)>1.2 and
com-plete non-detection in all shorter wavelength filters. While Oesch et al. (2014) also selectedz∼9 galaxies with a weaker continuum break, here we restrict our analysis to the redder color selection resulting in galaxies withzphot>∼9.5.
Here we make use of a redetermination of the IRAC photometry for the four sources in the Oesch et al. (2014) sample. For these measurements, we take advantage of new reductions of the Spitzer/IRAC 3.6µm and 4.5µm imaging data over the GOODS fields from Labbe et al. (2015). These reductions include all data from the original GOODS, the Spitzer Extended Deep Survey (SEDS: Ashby et al. 2013), the IRAC Ultra Deep Field (IUDF: Labb´e et al. 2015), and S-CANDELS (Ashby et al. 2015) programs. The average 5σ depths of the IRAC data within 1′′
radius apertures are 27.0 and 26.7 mag in the two channels, respectively.
Our measurements again make use of themophongo
Oesch et al. (2014). Three of the four z ∼10 galaxy can-didates from Oesch et al. (2014) are significantly detected (>4.5σ) in these data in at least one filter. In particular, the brightest source GN-z10-1 with a photometric redshift of zphot= 10.2±0.4 is robustly detected in the 3.6µm channel
at∼7σ, allowing for an individual estimate a UV-continuum slope for this source.
Equally important for robust measurements of the H160−[3.6] colors are accurate measurements of the total
H160-band flux. Our determination of the total H160-band
flux is as described in Oesch et al. (2014) and includes all the light inside an elliptical aperture extending to 2.5 Kron (1980) radii. The measured flux inside the utilized Kron aperture is corrected to total (typically a ∼0.2 mag cor-rection) based on the expected light outside this aperture (Dressel et al. 2012).
As a correction to total is performed for both the HST H160-band photometry and for the Spitzer/IRAC
photom-etry, colors derived from HST to Spitzer/IRAC should not suffer from significant biases. Nevertheless, it was worth-while to verify that this was the case by applying the HST-to-Spitzer PSF-correction kernel to the HST data (derived from mophongo) and then measuring total magnitudes
from the HST data in the same way as the Spitzer/IRAC data. Given the relatively small number of z ∼ 10 candi-dates in our sample and their limited S/N after convolving with the IRAC PSF correction kernel, we perform this test on a sample of bright (H160,AB <25) z ∼4 galaxies from
the Bouwens et al. (2015a) catalogs. We found that the to-tal magnitudes we recover by applying this procedure to the HST observations of these z ∼ 4 sources were consistent to < 0.1 mag in the median with that derived using our primary method.
To probe intrinsically fainter galaxies while maintaining a sufficiently high signal-to-noise, we can take advantage of sources which are lensed by foreground galaxies (or clusters of galaxies). Several z∼10 candidates have now been dis-covered in cluster searches (Zheng et al. 2012; Coe et al. 2013; Zitrin et al. 2014), with more likely to be identified in the near future as a result of the ongoing Hubble Frontier Fields observations.
Of the three currently knownz∼10 candidates we con-centrate on MACS1149-JD (Zheng et al. 2012). The object presented by Zitrin et al. (2014) does not currently have suf-ficiently deep IRAC imaging to provide anything other than a weak upper limit on the rest-frame UV-continuum slope. The object presented by Coe et al. (2013) has a photomet-ric redshift of z ∼ 10.7, at which redshift the H160-band
flux could be affected by the position of the Lyman-αbreak within theH160 band and/or Lyman-αline emission.
MACS1149-JD was identified in a search of 12 CLASH clusters and has strong detections in both the JHf140w and
Hf160w bands with weaker detections in both Yf105w and
Jf125w and non-detections in several optical bands.
Photo-metric redshift fitting of the sources photometry suggests it isz ∼9.6.3 Zheng et al. (2012) presented
Spitzer/IRAC
photometry of MACS1149-JD ([3.6]<160 nJy,1σ) based on observations taken under Program ID 60034 (PI: Egami).
3 Bouwens et al. 2014b estimate a photometric redshift of
9.7±0.1.
We augment these observations with Frontier Fields obser-vations and archival data taken as part of the Spitzer Ul-tRa Faint SUrvey Program (Surfs’Up, Bradaˇc et al. 2014) and measure a [3.6] flux of 175±44 nJy (see Bouwens et al. 2014b). This is consistent with that reported by both Zheng et al. (2012) (<160 nJy,1σ) and Bradaˇc et al. (2014) (190±87 nJy).
2.1.1 Bright Stack
The uncertainties on theU V-continuum slopes of individ-ual sources is large enough that it is useful to consider con-straints for the averagez∼10 source from the Oesch et al. (2014) bright sample. We therefore stack the photometry of the 4z∼10 candidates presented in Oesch et al. (2014). The Hf160w−[3.6] colour of the stack is−0.1±0.2. If we stack
only GN-z10-1 and GN-z10-2 (i.e. excluding sources without JHf140w detections) we find Hf160w−[3.6]=−0.2±0.2.
2.2 Measuring the UV continuum slope
Forz >7 galaxies, observations of the rest-frame UV contin-uum are typically limited to just 3 WFC3/IR bands uncon-taminated by the Lyman-αbreak (i.e.,Jf125w,JHf140w, and
Hf160w), and therefore suitable to measure the UV
contin-uum slopeβ. This is demonstrated, in Figure 1, for sources atz∈ {7,8,9,10}.
When only two bands are utilised for U V-continuum slope estimates, the relationship4 between the observed
colour and UV continuum slope can simply be written as:
β=p×(m1−m2)AB−2, (1)
where (m1−m2)ABis the observed colour assuming the AB
magnitude system andpis a value sensitive to the choice of bands. The valuepis approximately related to the ratio of the effective wavelengths (λ1,λ2) of the filters used to probe
the slope5, i.e.,
p−1= 2.5·log10(λ1/λ2). (2)
The value of log10(λ1/λ2) and the rest-frame UV
wave-length baseline (λ2−λ1) accessible byHubble/WFC3 and
Spitzer/IRAC observations as a function of redshift are
shown in Figure 2.
This accessible wavelength baseline is important as the uncertainty on β will also scale with p. For example, at z ∼8 where we only have observations using the JHf140w
and Hf160w bands, the value of pusing these bands is
ap-proximately 9.0 (Bouwens et al. 2014a). A typical error on m1andm2of 0.1 then translates into a large uncertainty on
β(≈9.0·√0.12+ 0.12 ≈1.3). Atz >9.5 theSpitzer/IRAC
[3.6]-band probes the UV continuum, which, when combined with Hf160w-band observations, provides an especially
ex-tended wavelength baseline. The end result is a particularly small value forp(≈1.1) and thus small uncertainty onβ.
4 Assuming the underlying spectral flux density is described by
a power-law, i.e.fν∝λβ+2
5 The value ofp is also sensitive to the shape of the filter and
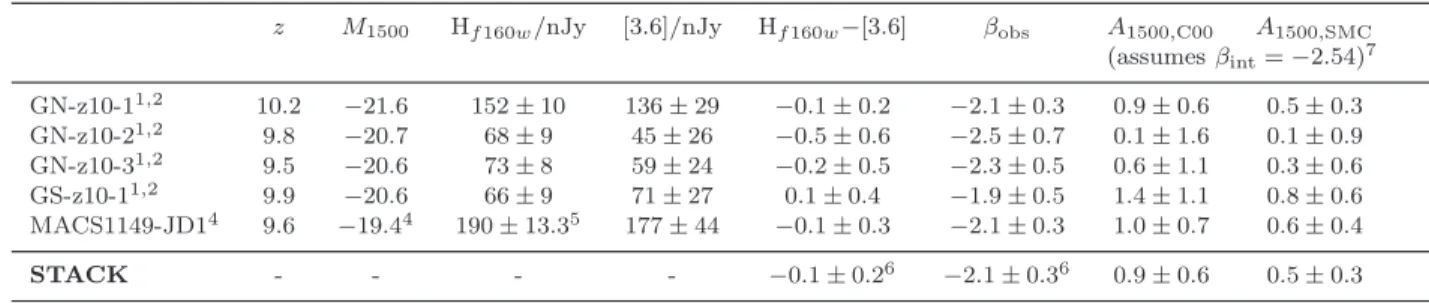
Table 1.Photometry and derived properties for thez∼10 sources, and the bright stack, considered in this work.
z M1500 Hf160w/nJy [3.6]/nJy Hf160w−[3.6] βobs A1500,C00 A1500,SMC
(assumesβint=−2.54)7
GN-z10-11,2 10.2 −21.6 152±10 136±29 −0.1±0.2 −2.1±0.3 0.9±0.6 0.5±0.3
GN-z10-21,2 9.8 −20.7 68±9 45±26 −0.5±0.6 −2.5±0.7 0.1±1.6 0.1±0.9
GN-z10-31,2 9.5 −20.6 73±8 59±24 −0.2±0.5 −2.3±0.5 0.6±1.1 0.3±0.6
GS-z10-11,2 9.9 −20.6 66±9 71±27 0.1±0.4 −1.9±0.5 1.4±1.1 0.8±0.6
MACS1149-JD14 9.6 −19.44 190±13.35 177±44 −0.1±0.3 −2.1±0.3 1.0±0.7 0.6±0.4
STACK - - - - −0.1±0.26 −2.1±0.36 0.9±0.6 0.5±0.3
1Oesch et al. (2014).2included in stack.3Zheng et al. (2012), Bouwens et al. (2014b).4 MACS1149-JD is gravitationally lensed by a
foreground cluster, we determine the un-lensed absolute magnitude using the best-fit magnification of 14.5.5We independently
measure the [3.6] flux for MACS1149-JD using the Frontier FieldsSpitzer/IRAC observations combined with observations taken as part of the Spitzer UltRa Faint SUrvey Program (SURFSUP, Bradaˇc et al. 2014) and Program ID 60034 (PI: Egami). Our flux measurements are consistent with those reported by both Zheng et al. (2012) (<160 nJy,1σ) and Bradaˇc et al. (2014) (190±87 nJy).6
The uncertainty on the mean increases to±0.3, if we assume there is significant intrinsic scatter in theβdistribution as observed at z∼4-5 (Bouwens et al. 2009, 2012; Castellano et al. 2012; Rogers et al. 2014: see§2.2).7 The intrinsicU V-continuum slope predicted
in dynamical simulation atz∼10 assumingfesc= 0 (§3).
Figure 1.Relative observed near-IR photometry of a model star-forming galaxy atz∈ {7,8,9,10}highlighting the bands available to measure the rest-frame UV-continuum slope. Atz >9.6, the
Spitzer/IRAC [3.6] band can be combined with the Hf160wband
to measure the UV continuum slope over a large wavelength base-line, minimising its uncertainty. Atz∼8 only the JHf140wand
Hf160wbands are uncontaminated by the Lyman-γbreak
provid-ing only a small wavelength baseline and leavprovid-ing the uncertainty on the observed UV continuum slope very large.
This long wavelength baseline compensates for the lower sen-sitivity of observations withSpitzer/IRAC [3.6], allowing the the UV continuum to be estimated much more robustly than atz∼8 and on a par withz∼6−8 for the same observed apparent magnitude. This is demonstrated in the bottom panel of Figure 2.
The observed values of the UV-continuum slopeβ for the z ∼ 10 candidates (and the stack) are listed in Table 1 and shown in Figure 3. For the brightest candidate (GN-z10-1) we findβobs =−2.1±0.2 while for the bright stack
(see §2.1.1) we find βobs = −2.1±0.3. If we stack only
those sources which have JH140-band observations
(pro-viding a second WFC3/IR filter where thez ∼ 10 candi-dates are detected), i.e., GN-z10-1 and GN-z10-2, we find βobs=−2.2±0.3.
While the formal random error on the mean β is 0.2, at lower redshifts theβ distribution for luminous galaxies appears to show a significant intrinsic scatter ofσβ ∼0.35
(Bouwens et al. 2009, 2012; Castellano et al. 2012; Rogers et al. 2014). Assuming a similar scatter atz∼10 translates to a slightly larger random error on the meanβof 0.3.
2.2.1 Selection Biases
It is useful to consider briefly whether our mean β results could be biased because of the selection criteria that were applied in searching forz∼10 galaxies. Such issues became an important aspect of the debate regardingU V-continuum slopes atz∼7 (e.g., Wilkins et al. 2012; Dunlop et al. 2012; Bouwens et al. 2012, 2014a), and it is important that we ensure that such issues do not become important again.
In identifying bright z ∼ 9-10 candidates over CAN-DELS GOODS-S and GOODS-N, Oesch et al. (2014) did not consider sources with particularly red Hf160w−[4.5]>2
col-ors redward of the Lyman break. Although the Hf160w−[4.5]
colour, unlike the Hf160w−[3.6] colour, does not directly
probe the UV continuum slope, they are correlated and noise in the two colors is not independent.6. A colour of
6 This is particularly true at H
f160w−[4.5]>0 where the colour
Figure 2.Top panel- The number ofHubble/WFC3 (Yf098m,
Jf125w, JHf140w, and Hf160w) and Spitzer/IRAC ([3.6]) bands
probing the rest frame 1216< λrest/˚A<3700 UV continuum as
a function of redshift.Second panel - The rest-frame UV wave-length baseline accessible by Hubble/WFC3 and Spitzer/IRAC observations as a function of redshift.Third panel - The ratio of the mean wavelength of the bluest and reddest filters to probe the rest-frame UV continuum. The arrows at the top denote the red-shift range over which an individual band probes the rest-frame 1216 < λrest/˚A < 3700 UV continuum. Bottom panel - The
expected uncertainty on the measurement ofβ as a function of redshift. This assumes aβ=−2,m= 26 source, for whichβis measured from the colour providing the longest usable wavelength baseline.
Hf160w−[4.5]∼2 corresponds toβ≈ −0.1. Given that all
of our candidates have measured colors of β < −1.8 with small uncertainties, it is unlikely that aβ <−0.1 selection will have an important impact on the meanβmeasured for the sample, since the limit is>3σaway from the meanβ ob-served and 3σaway from the meanβassuming no evolution fromz∼5-7.
It is encouraging that Bouwens et al. (2015a) selected exactly the samez ∼10 candidates as Oesch et al. (2014), utilizing a slightly modified criteria (Hf160w−[3.6]<1.6:
cor-responding to β < −0.2). This further confirms that the
Oesch et al. (2014) sample of bright sources is not affected by strongβ-dependent selection biases.
2.3 Possible Evolution in the observed UV-continuum slope
In the previous section, we presented the first determination of the meanU V-continuum slopeβfor a multi-object sample at z ∼ 10. Previously, UV continuum slopes for similarly luminous galaxies could only be determined up to z ∼ 8 (Finkelstein et al. 2012).
With these new measurements in hand, it is interesting to look for evidence of evolution in the meanβ of galaxies versus redshift. Figure 4 presents the current measurements and compares it against previous measurements atz ∼4-7 from Bouwens et al. (2014a) and Rogers et al. (2014).
As is evident from Figure 4, the observed UV continuum slopes of individual galaxies atz∼10 are found to be much bluer (∆β≈0.4) than those atz ∼4-7. These new results are interesting, as they suggest either a gradual evolution in βtowards bluer colors or no evolution over a wide redshift baseline.
The comparison of measurements atz = 4-7 withz ∼
10 is not necessarily straightforward as theU V-continuum slope is measured over very different wavelength baselines which may introduce a systematic bias. This is explored in more detail in Appendix A where we conclude that this is unlikely to be an important factor in this case, but could be as large as ∆β ∼ 0.2. If we allow for potential ∼10% systematics in our HST - IRAC color measurements (pos-sible if the total magnitudes we estimate from the HST or Spitzer/IRAC data are not quite identical), the total sys-tematic error relevant to the inferred evolution in β could be as large as∼0.22.
Accounting for both random and systematic errors, we find the observedβfor luminous galaxies atz∼10 is only 1σbluer than atz∼7. Therefore, our results are consistent with either a mild reddening of theU V-continuum slopes with cosmic time or no evolution at all.
3 INFERRED DUST ATTENUATION
3.1 Relating the observed UV continuum slope to dust attenuation
The presence of dust causes the observed UV continuum slope to redden relative to the intrinsic slope. The relation-ship between between the observed slopeβobs and the
at-tenuation Aλ can be written as (e.g. Meurer et al. 1999,
Wilkins et al. 2013a),
Aλ=Dλ×[βobs−βint], (3)
whereβint is the intrinsic UV continuum slope, βobs is the
observed slope, and Dλ (= dAλ/dβ) describes the change
Figure 3.Mean value of the UV-continuum slope as a function of absolute rest-frame UV magnitude for candidate high-redshift (z= 4−10) star forming galaxies (Bouwens et al. 2014; Rogers et al. 2014). The thin horizontal line denotes the intrinsic slope implicit in the empirical Meurer et al. (1999) relation and the two horizontal bands show the range of intrinsic slopes expected from the MassiveBlack-II hydrodynamical simulation at z ∼
10 assuming both fesc = 1 (pure stellar) and fesc = 0. It is
important to note that at lower redshift theMassiveBlack-II
simulation predicts significantly bluer intrinsic slopes (see Wilkins et al. 2013a).
Figure 4. The observed UV continuum slope as a function of redshift for candidate high-redshift (z = 4−10) star forming galaxies. Results atz= 4−7 are based on the bi-weight mean of galaxies withM1500≈ −20.75 from Bouwens et al. (2014a).
Bothβint and Dλ can be constrained empirically (e.g.
Meurer et al. 1999, Heinis et al. 2013) using a combination of rest-frame UV and far-IR observations of a sample of galax-ies.Dλcan be determined for any attenuation curve which
extends over the rest-frame UV, and thus doesn’t necessarily require far-IR observations to be constrained.
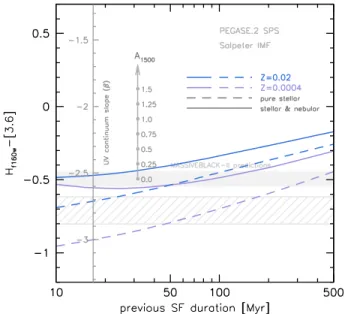
Figure 5.The sensitivity of the Hf160w-[3.6] colour (our proxy
for the UV continuum slope) to the duration of previous (con-stant) star formation. The blue and purple lines show the result forZ = 0.02 andZ = 0.0004 respectively, while the solid and dashed lines show the result assuming fesc = 0 (i.e. including
nebular continuum and line emission) andfesc= 1 (i.e. pure
stel-lar emission) respectively. The solid and hatched horizontal bands show the predictions from theMassiveBlack-IIsimulations
as-sumingfesc= 0 andfesc= 1 respectively.
3.2 The intrinsic UV continuum slope
Empirical constraints onβintare, at present, due to the lack
of sufficiently deep far-IR/sub-mm observations, limited to low-intermediate redshift (e.g. Heinis et al. 2013). The value ofβintat low/intermediate redshift is unlikely to reflect that
at very-high redshift asβintis sensitive to both the age and
metallicity of the stellar population, both of which are ex-pected to decrease in typical star forming galaxies to high-redshift (e.g. Wilkins et al. 2013a).
The sensitivity of the intrinsic UV-continuum slopeβint
to various properties, including the joint distribution of stel-lar masses, ages, and metallicities (themselves determined the recent star formation and metal enrichment histories, and initial mass function) and the presence of nebular con-tinuum, and to a lesser extent, line emission is discussed in Wilkins et al. (2012) and Wilkins et al. (2013a). We demon-strate this sensitivity in Figure 5 utilising thePegase.2
stel-lar population synthesis code (Fioc & Rocca-Volmerange 1997, 1999). We determine the Hf160w−[3.6] colour (our
proxy for the UV continuum slope atz∼10) as a function of the duration of previous constant star formation, for two stellar metallicities, and also assumingfesc= 0 andfesc= 1
(i.e. a pure stellar continuum). Increasing the metallicity, the strength of nebular emission (i.e. decreasing the escape fractionfesc), and the duration of previous star formation all
3.2.1 Sensitivity to the candidate redshift
In addition to the physical properties outlined above the UV continuum slope inferred from observations will also be sen-sitive to the redshift of the source. This is demonstrated in Figure 6 where the predicted intrinsic Hf160w−[3.6] colour
(our proxy for the observed UV-continuum slope) of a stel-lar population that has been forming stars constantly for 50 Myr is shown as a function of redshift. Three different nebu-lar emission scenarios are shown: (i)fesc= 1 (i.e. pure
stel-lar), (ii)fesc= 0, and (iii)fesc= 1 but with Lyman-α
sup-pressed. In all three cases, in the intervalz= 9.6−10.4, the observed colour exhibits virtually no variation. Atz <9.6 various strong emission lines, beginning with [OII]λ3727˚A, enter theSpitzer/IRAC [3.6]-band resulting in generally red-der colours7.
At z > 10.4 the Hf160w-band filter overlaps with the
wavelength of rest-frame Lyman-α. Assuming no Lyman-α emerges (scenario iii) this results in the observed Hf160w
-band encompassing the Lyman-α break resulting in a de-creased flux, and consequently redder Hf160w−[3.6] colours.
If strong Lyman-αemerges the Hf160w−[3.6] colour would
rapidly become very blue before gradually becoming redder. Spectroscopic follow-up of z >∼6.5 galaxies strongly points towards very little Lyαemission in z >∼10.4 galaxies (e.g., Stark et al. 2010; Ono et al. 2012; Schenker et al. 2012; Pentericci et al. 2011; Caruana et al. 2012; Treu et al. 2013; Finkelstein et al. 2013; Oesch et al. 2015a: but see also Zitrin et al. 2015).
3.2.2 Simulation Predictions for the Intrinsic Slope
While empirical constraints on the intrinsic slope βint
ex-ist they are only available at low-redshift, and are therefore unlikely to be representative of the very-high redshift Uni-verse. We then also employ predictions from galaxy forma-tion models for the intrinsic slope and spectral energy dis-tribution. Specifically, we utilise predictions from the Mas-siveBlack and MassiveBlack-IIhydro-dynamical
simu-lations (see Khandai et al. 2015 for a general description of the simulations, and Wilkins et al. 2013a for predictions of the intrinsic UV continuum slope). Atz= 10 these simula-tions predict a median intrinsic slope of βint ≈ −2.54
(as-suming fesc = 0) andβint ≈ −2.78 for a pure stellar SED.
In both cases thePegase.2SPS model is assumed, however
other commonly used models models produce similar results (Wilkins et al. 2013ab).
3.3 Inferred Dust Attenuation
By combining the observed UV continuum slopeβobswith a
choice of intrinsic slopeβintand dust curve we can infer the
level of dust attenuation using Equation 3. We do this both utilising the empirical Meurer relation and by assuming the intrinsic slope predicted by the MassiveBlack-II
simula-tion combined with various attenuasimula-tion/extincsimula-tion curves.
7 The Spitzer/IRAC [3.6]-band also no longer probes the
rest-frame UV continuum
Figure 6.lower-panelThe sensitivity of the Hf160w-[3.6] colour
(our proxy for the UV continuum slope) to the redshift for a stellar population which has been constantly forming stars for 50 Myr (withZ= 0.004, i.e.≈1/5Z⊙). The three lines show the
result of different nebular emission scenarios: (dashed)fesc = 1
(i.e. pure stellar), (solid)fesc= 0, and (dotted)fesc= 1 but with
Lyman-αsuppressed. The predictions fromMassiveBlack-IIare
shown by the shaded horizontal bands.upper-panelThe redshift probability distributions of the 4 brightz∼10 candidates.
In Figure 7 we first show the inferred UV attenuation as-suming the empirical Meurer et al. (1999) relation. The com-bination of very blue observed colours and the β ≈ −2.23 intrinsic slope implicit in the Meurer relation result in in-dividual objects having best fit attenuations formally con-sistent with A1500 = 0. The attenuation inferred from the
bright stack isA1500= 0.3±0.5.
Figure 8 is similar but instead shows the attenua-tion when we assume the intrinsic slope predicted by the
MassiveBlack-IIsimulation (assuming fesc = 0.0) along
with both the Calzetti et al. (2000) and SMC (from Pei et al. 1992) dust curves. In this case all of the individual ob-servations as well of the stack yield positive values ofA1500.
If instead a higher escape fraction is assumed (which would make the intrinsic slope bluer) the inferred attenuation in-creases by between 0.25−0.5 mags, depending on the choice of attenuation/extinction curve.
3.3.1 Evolution of dust attenuation
predic-Figure 7.The inferred rest-frame UV attenuationA1500
(right-hand axes) assuming the Meurer et al. (1999) relation.
Figure 8.The inferred rest-frame UV attenuationA1500
(right-hand axes) assuming the intrinsic slope predicted by Massive-Blackalong with the Calzetti et al. (2000)starburstand Pei et al. (1992) SMC dust curves.
tions of the intrinsic slope with the Calzetti et al. (2000) dust curve. Assuming a constant intrinsic slopes hints at a significant increase in the UV attenuation from z ∼10 to z∼7 followed by little evolution betweenz = 7 andz= 4. Utilising the intrinsic slopes predicted by MassiveBlack
(which vary with redshift) weakens this evolution.
Figure 9.The evolution of the rest-frame UV attenuationA1500
inferred from observations of the UV continuum slope in bright z∈ {4,5,6,7,10}star forming galaxies. Both the attenuation cal-culated using the Meurer et al. (1999) relation and combining the Calzetti et al. (2000) attenuation curve with theMassiveBlack
predictions are shown.
4 CONCLUSIONS
Here we make use of the deep Hubble and Spitzer obser-vations available over 5 particularly bright z ∼ 10 candi-dates (Oesch et al. 2014; Zheng et al. 2012) to provide a first characterization of the mean UV-continuum slope for a multi-object sample of galaxies atz∼10.
We find:
• Combining Hubble and Spitzer we have measured the mean UV continuum slope of star formation galaxy candidates atz∼10. We find a meanβof−2.1±0.3±0.2. We allow for up to a 0.2 error in this measurement due to systematic errors that may derive from the wavelength baseline used to derive β (Appendix A) or from small systematics in the photometry. The average observed UV continuum slope of a stack of brightz∼10 sources is only bluer than those at z < 8 (βobs ≈ −1.7) by 1σ. These
measurements are more robust than those atz ∼8 due to the wide wavelength baseline provided by the combination of the Hubble/WFC3 Hf160w-band and Spitzer/IRAC
[3.6]-band. The only previous measurement ofβat z ∼10 was by Oesch et al. (2014) for the most luminous z ∼10 galaxy in their selection.
4.1 Acknowledgements
We acknowledge useful conversations with Dan Coe on this topic, who has been attempting similar measurements on his triply imaged z ∼ 11 candidate. SMW acknowledges sup-port from the Science and Technology Facilities Council. IL acknowledges support from the European Research Council grant HIGHZ no. 227749 and the Netherlands Organisation for Scientific Research Spinoza grant. The Dark Cosmology Centre is funded by the Danish National Research Founda-tion.
REFERENCES
Ashby, M. L. N., Stanford, S. A., Brodwin, M., et al. 2013, ApJS, 209, 22
Ashby, M. L. N., Willner, S. P., Fazio, G. G., et al. 2015, ApJS, in press.
Bouwens, R. J., Illingworth, G. D., Oesch, P. A., et al. 2014a, ApJ, 793, 115
Bouwens, R. J., Bradley, L., Zitrin, A., et al. 2014b, ApJ, 795, 126
Bouwens, R. J., Illingworth, G. D., Oesch, P. A., et al. 2015, ApJ, 803, 34
Bouwens, R. J., Oesch, P. A., Illingworth, G. D., et al. 2013a, ApJ, 765, L16
Bouwens, R. J., Oesch, P. A., Labbe, I., et al. 2015b, arXiv:1506.01035
Bouwens, R. J., Illingworth, G. D., Oesch, P. A., et al. 2012, ApJ, 754, 83
Bouwens, R. J., Illingworth, G. D., Oesch, P. A., et al. 2011b, ApJ, 737, 90
Bouwens, R. J., Illingworth, G. D., Labbe, I., et al. 2011a, Nat, 469, 504
Bouwens, R. J., Illingworth, G. D., Oesch, P. A., et al. 2010, ApJ, 709, L133
Bouwens, R. J., Illingworth, G. D., Franx, M., et al. 2009, ApJ, 705, 936
Bouwens, R. J., Illingworth, G. D., Franx, M., & Ford, H. 2008, ApJ, 686, 230
Bouwens, R. J., Illingworth, G. D., Franx, M., & Ford, H. 2007, ApJ, 670, 928
Bouwens R. J. Illingworth G. D. Blakeslee J. P.; Franx M., 2006, ApJ, 653, 53
Bunker, A. J., Wilkins, S., Ellis, R. S., et al. 2010, MNRAS, 409, 855
Bradaˇc, M., Ryan, R., Casertano, S., et al. 2014, ApJ, 785, 108 Brammer, G. B., van Dokkum, P. G., Illingworth, G. D., et al.
2013, ApJ, 765, L2
Calzetti, D., Armus, L., Bohlin, R. C., et al. 2000, ApJ, 533, 682 Caruana, J., Bunker, A. J., Wilkins, S. M., et al. 2012, MNRAS,
427, 3055
Casey, C. M., Narayanan, D., & Cooray, A. 2014, Phys. Rep., 541, 45
Coe, D., Zitrin, A., Carrasco, M., et al. 2013, ApJ, 762, 32 da Cunha, E., Groves, B., Walter, F., et al. 2013, ApJ, 766, 13 Dressel, L., et al. 2012. Wide Field Camera 3 Instrument
Hand-book, Version 5.0 (Baltimore: STScI)
Dunlop, J. S., Rogers, A. B., McLure, R. J., et al. 2013, MNRAS, 432, 3520
Dunlop, J. S., McLure, R. J., Robertson, B. E., et al. 2012, MN-RAS, 420, 901
Ellis, R. S., McLure, R. J., Dunlop, J. S., et al. 2013, ApJ, 763, L7
Finkelstein, S. L., Papovich, C., Salmon, B., et al. 2012, ApJ, 756, 164
Finkelstein, S. L., Papovich, C., Giavalisco, M., et al. 2010, ApJ, 719, 1250
Finkelstein, S. L., Papovich, C., Dickinson, M., et al. 2013, Nat, 502, 524
Fioc, M., & Rocca-Volmerange, B. 1999, arXiv:astro-ph/9912179 Fioc, M., and Rocca-Volmerange, B. 1997, A&A, 326, 950 Gonz´alez, V., Bouwens, R., Illingworth, G., et al. 2014, ApJ, 781,
34
Gonz´alez, V., Labb´e, I., Bouwens, R. J., et al. 2010, ApJ, 713, 115
Grogin, N. A., Kocevski, D. D., Faber, S. M., et al. 2011, ApJS, 197, 35
Hathi, N. P., Cohen, S. H., Ryan, R. E., Jr., et al. 2013, ApJ, 765, 88
Heinis, S., Buat, V., B´ethermin, M., et al. 2013, MNRAS, 429, 1113
Illingworth, G. D., Magee, D., Oesch, P. A., et al. 2013, ApJS, 209, 6
Ishigaki, M., Kawamata, R., Ouchi, M., et al. 2015, ApJ, 799, 12 Khandai, N., Di Matteo, T., Croft, R., et al. 2015, MNRAS, 450,
1349
Koekemoer, A. M., Ellis, R. S., McLure, R. J., et al. 2013, ApJS, 209, 3
Koekemoer, A. M., Faber, S. M., Ferguson, H. C., et al. 2011, ApJS, 197, 36
Kron, R. G. 1980, ApJS, 43, 305
Kurczynski, P., Gawiser, E., Rafelski, M., et al. 2014, ApJ, 793, L5
Labb´e, I., Bouwens, R., Illingworth, G. D., & Franx, M. 2006, ApJ, 649, L67
Labb´e, I., et al. 2010, ApJ, 708, L26
Labb´e, I., Oesch, P. A., Bouwens, R. J., et al. 2013, ApJ, 777, L19
Labbe, I., Oesch, P. A., Illingworth, G. D., et al. 2015, ApJS, in press, arXiv:1507.08313
Lehnert, M. D., & Bremer, M. 2003, ApJ, 593, 630
McLure, R. J., Dunlop, J. S., Bowler, R. A. A., et al. 2013, MN-RAS, 432, 2696
McLure, R. J., Dunlop, J. S., de Ravel, L., et al. 2011, MNRAS, 418, 2074
Meurer, G. R., Heckman, T. M., & Calzetti, D. 1999, ApJ, 521, 64
Oesch, P. A., Bouwens, R. J., Illingworth, G. D., et al. 2010, ApJ, 709, L16
Oesch, P. A., Bouwens, R. J., Illingworth, G. D., et al. 2012, ApJ, 759, 135
Oesch, P. A., Bouwens, R. J., Illingworth, G. D., et al. 2013, ApJ, 773, 75
Oesch, P. A., Bouwens, R. J., Illingworth, G. D., et al. 2014, ApJ, 786, 108
Oesch, P. A., van Dokkum, P. G., Illingworth, G. D., et al. 2015a, ApJ, 804, L30
Oesch, P. A., Bouwens, R. J., Illingworth, G. D., et al. 2015b, ApJ, 808, 104
Oke J. B., Gunn J. E., 1983, ApJ, 266, 713
Ono, Y., Ouchi, M., Mobasher, B., et al. 2012, ApJ, 744, 83 Papovich, C., Dickinson, M., Ferguson, H. C., et al. 2004, ApJ,
600, L111
Pei, Y. C. 1992, ApJ, 395, 130
Pentericci, L., Fontana, A., Vanzella, E., et al. 2011, ApJ, 743, 132
Postman, M., Coe, D., Ben´ıtez, N., et al. 2012, ApJS, 199, 25 Reddy, N. A., Erb, D. K., Pettini, M., Steidel, C. C., & Shapley,
A. E. 2010, ApJ, 712, 1070
Robertson, B. E., Furlanetto, S. R., Schneider, E., et al. 2013, ApJ, 768, 71
Salmon, B., Papovich, C., Finkelstein, S. L., et al. 2015, ApJ, 799, 183
Salpeter E. E., 1955, ApJ, 121, 161
Schaerer, D., de Barros, S., & Sklias, P. 2013, A&A, 549, A4 Schaerer, D., & de Barros, S. 2010, A&A, 515, A73
Schenker, M. A., Stark, D. P., Ellis, R. S., et al. 2012, ApJ, 744, 179
Schmidt, K. B., Treu, T., Trenti, M., et al. 2014, ApJ, 786, 57 Shim, H., Chary, R.-R., Dickinson, M., et al. 2011, ApJ, 738, 69 Smit, R., Bouwens, R. J., Labb´e, I., et al. 2014, ApJ, 784, 58 Spitler, L. R., Straatman, C. M. S., Labb´e, I., et al. 2014, ApJ,
787, L36
Stanway E. R., McMahon R. G., Bunker A. J., 2005, MNRAS, 359, 1184
Stark, D. P., Ellis, R. S., Chiu, K., Ouchi, M., & Bunker, A. 2010, MNRAS, 408, 1628
Stark, D. P., Schenker, M. A., Ellis, R., et al. 2013, ApJ, 763, 129 Stark, D. P., Ellis, R. S., Bunker, A., et al. 2009, ApJ, 697, 1493 Symeonidis, M., Vaccari, M., Berta, S., et al. 2013, MNRAS, 431,
2317
Treu, T., Schmidt, K. B., Trenti, M., Bradley, L. D., & Stiavelli, M. 2013, ApJ, 775, LL29
Wilkins, S. M., Coulton, W., Caruana, J., et al. 2013b, MNRAS, 435, 2885
Wilkins, S. M., Bunker, A., Coulton, W., et al. 2013a, MNRAS, 430, 2885
Wilkins, S. M., Gonzalez-Perez, V., Lacey, C. G., & Baugh, C. M. 2012, MNRAS, 424, 1522
Wilkins, S. M., Bunker, A. J., Stanway, E., Lorenzoni, S., & Caru-ana, J. 2011b, MNRAS, 417, 717
Wilkins, S. M., Bunker, A. J., Lorenzoni, S., & Caruana, J. 2011a, MNRAS, 411, 23
Wilkins, S. M., Bunker, A. J., Ellis, R. S., et al. 2010, MNRAS, 403, 938
Zheng, W., Postman, M., Zitrin, A., et al. 2012, Nat, 489, 406 Zitrin, A., Zheng, W., Broadhurst, T., et al. 2014, ApJ, 793, L12 Zitrin, A., Labbe, I., Belli, S., et al. 2015, ApJ, submitted,
arXiv:1507.02679
This paper has been typeset from a TEX/ LATEX file prepared
by the author.
APPENDIX A: THE EFFECT OF THE WAVELENGTH BASELINE ON THE MEASURED UV CONTINUUM SLOPE
The UV continua of real stellar populations, though well ap-proximated by, does not perfectly follow a power law. This effectively leaves the power law slopeβinferred from obser-vations sensitive to the wavelength baseline of the observa-tions.
In Figure A1 we demonstrate the difference between the UV continuum slope measured at z = 7 using the Jf125w −Hf160w colour and that measured atz = 10
us-ing theHf160w−[3.6] colour for different durations of
previ-ous constant star formation and stellar metallicities. With the exception of very young durations of star formation the offset between the measured values of β is fairly constant with star formation duration. However, the offset is strongly affected by the stellar metallicity. For example, for stellar metallicities ofZ = 0.02 there is a significant deviation be-tween the two measures ofβwith ∆β≈0.2 suggesting that a much bluer value ofβwould be measured atz= 10 com-pared toz= 7. However, for metallicitiesZ = 0.004−0.008,
Figure A1. The difference between the UV continuum slope measured atz = 7 using theJf125w−Hf160w colour and that
measured at z = 10 using the Hf160w−[3.6] colour as a
func-tion of the previous durafunc-tion of (constant) star formafunc-tion for 4 different metallicities (Z∈ {0.0004,0.004,0.008,0.02}.
which are expected to be typical of star forming galaxies at Z = 0.004−0.008 (Wilkins et al., in-prep8) this effect becomes small (|∆β| < 0.05), though reverses at very-low metallicity.
![Figure 2. Top panel - The number of Hubble/WFC3 (Y f 098m , J f 125w , JH f 140w , and H f 160w ) and Spitzer/IRAC ([3.6]) bands probing the rest frame 1216 < λ rest /˚ A < 3700 UV continuum as a function of redshift](https://thumb-us.123doks.com/thumbv2/123dok_us/8292637.2196033/5.918.89.422.101.641/figure-number-hubble-spitzer-probing-continuum-function-redshift.webp)
![Figure 6. lower-panel The sensitivity of the H f 160w -[3.6] colour (our proxy for the UV continuum slope) to the redshift for a stellar population which has been constantly forming stars for 50 Myr (with Z = 0.004, i.e](https://thumb-us.123doks.com/thumbv2/123dok_us/8292637.2196033/7.918.466.819.91.483/figure-sensitivity-continuum-redshift-stellar-population-constantly-forming.webp)

![Figure A1. The difference between the UV continuum slope measured at z = 7 using the J f 125w − H f 160w colour and that measured at z = 10 using the H f 160w −[3.6] colour as a func-tion of the previous durafunc-tion of (constant) star formafunc-tion for](https://thumb-us.123doks.com/thumbv2/123dok_us/8292637.2196033/10.918.472.817.95.410/difference-continuum-measured-measured-previous-durafunc-constant-formafunc.webp)
