Maternal Physical Activity and Birth Outcomes
Marit L. Bovbjerg
A dissertation submitted to the faculty of the University of North Carolina at Chapel Hill in partial fulfillment of the requirements for the degree of Doctor of Philosophy in the
Department of Epidemiology, Gillings School of Global Public Health
Chapel Hill
2010
Approved by:
Anna Maria Siega-Riz, PhD, RD, chair Kelly R. Evenson, PhD
ii
iii ABSTRACT
Marit L. Bovbjerg
Maternal Physical Activity and Birth Outcomes
(under the direction of Anna Maria Siega-Riz)
Background: Information on physical activity (PA) during pregnancy and subsequent
maternal birth outcomes (such as cesarean rate, labor duration) is plentiful in the
literature, but consensus among studies is lacking. Poor exposure analytic methods may
be a source of conflicting results. Objective: To estimate associations between PA
during pregnancy and maternal birth outcomes using appropriate statistical methods.
Methods: Detailed 7-day PA recalls were administered to pregnant women at two time
points: 17-22 and 27-30 weeks’ completed gestation. Covariables and labor outcomes
were obtained by a combination of self-administered questionnaires and medical record
abstraction. Physical activity was treated in analyses as a continuous, non-linear
variable. We analyzed separately 8 different exposures: total hours/week PA at each
time point, hours/week moderate-to-vigorous PA (MVPA) at each time point; total
hours/week recreational PA at each time point, and finally hours/week recreational
MVPA at each time point. Outcomes included induction, labor duration, augmentation,
operative vaginal delivery (OVD), cesarean birth, episiotomy, and laceration severity.
Covariables for each model were selected using directed acyclic graphs (DAGs);
variables in final models were chosen through backwards stepwise selection using
analysis of deviance. Sensitivity analyses explored the effects of excluding women
reporting extremely large PA volumes and of excluding women reporting zero
iv
decreased risk of induction. Recreational PA at the second time point only was
associated with a decreased risk of augmentation. PA during pregnancy was associated
with longer labor durations, but our measure of labor duration was crude and we do not
consider this result definitive. PA was not associated in these data with episiotomy,
OVD, or cesarean. PA may be associated with increased laceration severity, but effects
were quite small. Conclusions: Lack of consensus in the literature on the associations
between PA and maternal birth outcomes may be partially because of categorical
v
TABLE OF CONTENTS
LIST OF TABLES ... vi
LIST OF FIGURES ... viii
LIST OF ABBREVIATIONS ... viii
INTRODUCTION AND SPECIFIC AIMS ... 1
LITERATURE REVIEW ... 3
Previously-Reported Associations Between Maternal PA and Pregnancy Outcomes .. 3
Summary of Previous Literature on Cesarean/Physical Activity (PA) ... 11
Physical Activity During Pregnancy and Induction of Labor ... 16
Physical Activity During Pregnancy and Labor Duration ... 18
Physical Activity During Pregnancy and Labor Augmentation ... 20
Physical Activity During Pregnancy and Operative Vaginal Delivery ... 22
Physical Activity During Pregnancy, Episiotomy, and Perineal Lacerations ... 24
Summary ... 25
RESEARCH DESIGN AND METHODS ... 27
PAPER 1 ... 33
Abstract ... 34
Introduction ... 35
Methods ... 36
Results ... 41
Discussion ... 44
vi
Abstract ... 74
Introduction ... 75
Methods ... 76
Results ... 82
Discussion ... 87
Discussion ... 98
Limitations ... 98
Study Strengths ... 100
Mechanisms... 101
Public Health Implications ... 102
vii
LIST OF TABLES
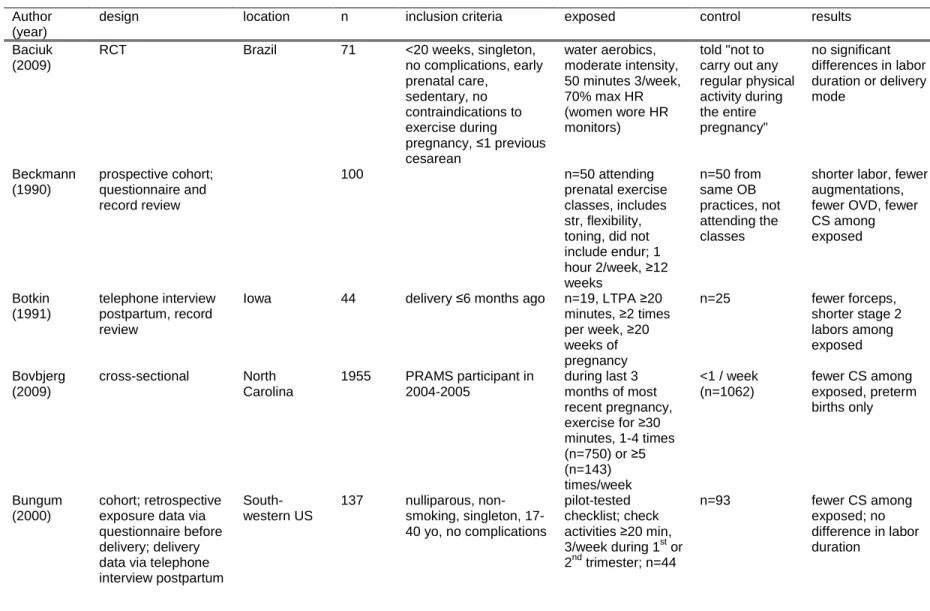
Table 2.1. Characteristics of studies reporting maternal birth outcomes. ... 7
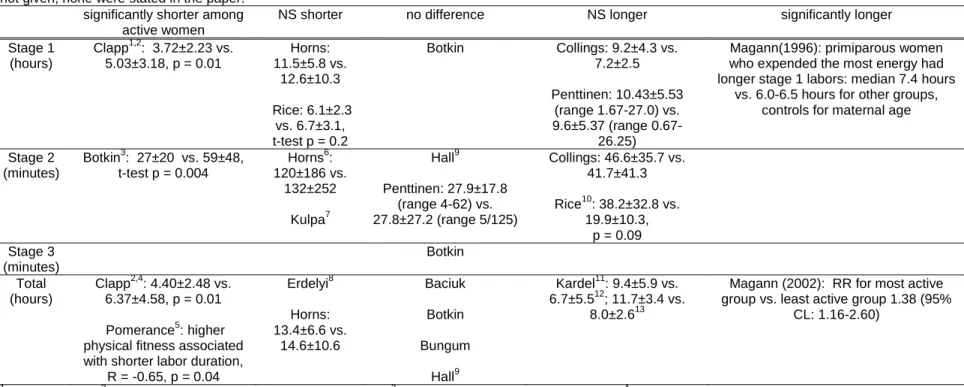
Table 2.2. Summary of labor duration studies.. ... 19
Table 4.1. Characteristics of 1205 women from the third Pregnancy, Infection, and Nutrition cohort (PIN3) who were at risk for primary cesarean
during the index pregnancy ... 580
Table 4.2. Maximum and minimum predicted adjusted risks associated with
different participant characteristics. ... 51
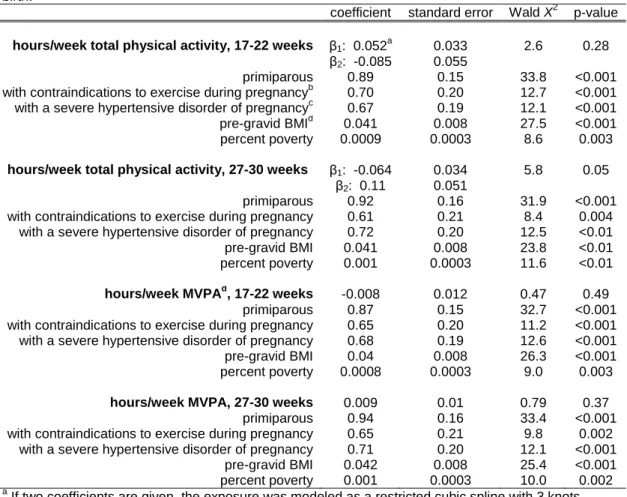
Table 4.3. Final model coefficients and test statistics for each of the four
physical activity exposures. ... 52
Table 5.1. Sample characteristics, n=945 participants in the third Pregnancy,
Infection, and Nutrition study who had a vaginal delivery ... 953
Table 5.2. Physical activity exposure definitions applied to the Pregnancy,
viii
LIST OF FIGURES
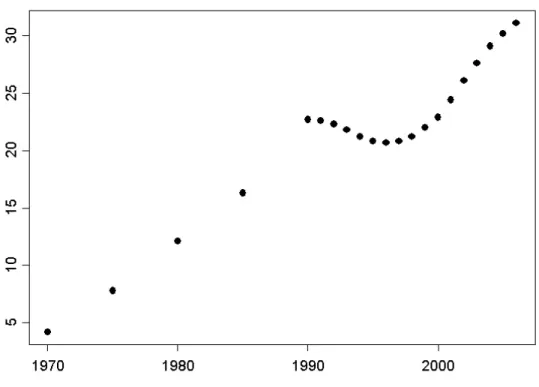
Figure 2.1. Rates of cesarean birth in the US, 1970-2006. ... 5
Figure 2.2. Directed Acyclic Graph showing the causal relationships between minutes of moderate to vigorous physical activity (MVPA)
and delivery mode. ... 13
Figure 4.1. Unadjusted predicted risk of cesarean by 4 maternal PA exposures ... 53
Figure 4.2. Adjusted predicted risk of cesarean following PA during pregnancy. ... 58
Figure 4.3. Adjusted predicted risk of cesarean, limiting exposure to
recreational physical activity. ... 63
Figure 4.4. Adjusted predicted risk of cesarean, using the same exposures as in Figures 1 and 2, but dropping the women who reported activity
volumes in the upper 2.5%. ... 68
Figure 5.1. Predicted proportion of inductions (and point-wise 95% confidence intervals) at different levels of self-reported physical activity for 945 women in the third Pregnancy, Infection, and Nutrition cohort who had a vaginal birth. ... 95
ix
LIST OF ABBREVIATIONS
ACOG, American College of Obstetricians and Gynecologists
B/C, because
BMI, body mass index
BW, birthweight
CDC, Centers for Disease Control and Prevention
CI, confidence interval
CM, centimeters
CL, confidence limits
CS, cesarean section
DAG, directed acyclic graph
DM, diabetes mellitus
ED, education
ENDUR, endurance training
EXP, exposure
G, grams
GA, gestational age
HELLP, hemolysis, elevated liver enzymes, low platelets
HR, heart rate
HTN, hypertension
HX, history
INT, interval training
IQR, inter-quartile range
x
L&D, labor and delivery
LBW, low birth weight
LTPA, leisure-time physical activity
MVPA, moderate-to-vigorous physical activity
NICU, neonatal intensive care unit
NIH, National Institutes of Health
NS, non-significant
OB/GYN, obstetrics and gynecology
OR, odds ratio
OVD, operative vaginal delivery
PA, physical activity
PEH, pre-eclampsia, eclampsia, or HELLP syndrome
PIN3, third Pregnancy, Infection, and Nutrition study
PRAMS, Pregnancy Risk Assessment Monitoring System
PT PREF, patient preferences for labor and delivery
RCT, randomized controlled trial
RR, risk ratio
SD, standard deviation
SES, socio-economic status
STR, strength training
UNC, University of North Carolina
US, United States
VBAC, vaginal birth after cesarean
INTRODUCTION AND SPECIFIC AIMS
The American College of Obstetricians and Gynecologists (ACOG) issued the
most recent update to their guidelines for exercise during pregnancy in January of
2002.(1) They recommend “30 minutes or more of moderate exercise on most, if not all,
days of the week”—an exercise prescription which corresponds closely to what the
Centers for Disease Control and Prevention (CDC) suggested for all adult Americans at
that time.(2) Of note, ACOG's use of the word "exercise" is probably a misnomer, as the
guidelines do discuss non-exercise physical activity; however, ACOG does intentionally
limit its recommendations to moderate exercise (rather than moderate or vigorous, as
the CDC suggested), noting that little research had been done on strenuous exercise
during pregnancy. They caution all pregnant women to limit exercise intensity and
duration; to avoid competitive, injury-prone, and supine-position activities; to be aware of
the physiologic changes that accompany pregnancy and which therefore present
heightened risks; and not to exercise at all if women have any of a number of pregnancy
complications (placenta previa, pre-eclampsia, unexplained late bleeding, incompetent
cervix, signs of preterm labor, etc.) While ACOG does not state that exercise benefits
pregnancy per se, they do note the lack of apparent harm as well as the benefits of
exercise enjoyed by all relatively healthy adults, regardless of pregnancy status.
Many maternal benefits have been postulated to follow physical activity during
pregnancy, mostly based on the assumption that an active woman's body is better able
to withstand the rigors of labor and birth. These claims are largely unsubstantiated by
2
of consensus is likely because of a number of methodological difficulties, including
inadequate sample sizes and lack of appropriate statistical techniques. This study
examined the associations between physical activity during pregnancy and maternal
birth outcomes. Data came from the third Pregnancy, Infection, and Nutrition (PIN3)
cohort and from the University of North Carolina at Chapel Hill's Department of
Obstetrics and Gynecology's clinical Perinatal Database. This study represents an
improvement over previous efforts because of the large sample size, extensive
prospective exposure ascertainment, and large number of available covariables.
The aims were:
• To determine whether women who report more hours/week of physical
activity (PA), or those who report more hours/week of
moderate-to-vigorous PA (MVPA), at either 17-22 weeks or at 27-30 weeks, have a
different pattern of delivery modes than do women who report less activity.
Hypotheses: Women reporting more hours/week will have fewer primary
urgent/emergent cesareans than women reporting fewer.
• To describe the patterns of labor for women who report different volumes
of PA and MVPA at 17-22 weeks and 27-30 weeks.
Hypotheses: When excluding women who had cesarean births, women with higher
volumes of physical activity during pregnancy will require fewer inductions, have shorter
labors, require less augmentation, have fewer operative vaginal deliveries, fewer
LITERATURE REVIEW
Previously-Reported Associations Between Maternal PA and Pregnancy Outcomes
Active women have slightly smaller babies, but there is no change in the percent
of babies falling into the low birth weight category (LBW, <2500 g).(3-4) Activity during
pregnancy does not appear to increase rates of preterm birth.(3-5) A woman who is
active during her pregnancy has a reduced risk of developing gestational
diabetes,(3-4,6) pregnancy-induced hypertension,(6) and pre-eclampsia.(3-diabetes,(3-4,6) Active women gain
less weight during their pregnancies (3,6)—a bad prognostic factor in developing
countries where adequate maternal nutrition is scarce, but a good sign in the US, where
many women gain above the Institute of Medicine's recommendations.(7-8) Women
who are active during their pregnancies have fewer physical complaints (nausea, leg
cramping, backache) than do less active women.(6,9) Pregnant women who exercise
regularly may also have fewer depressive symptoms.(6) However, there is still debate
regarding the effects, if any, that physical activity during pregnancy may have on
maternal birth outcomes such as delivery mode, pain, labor duration, perineal
lacerations, episiotomy, and need for induction or augmentation of labor.
A systematic search of the English-language literature indexed by the National
Library of Medicine was conducted on 19 October 2008 by searching the keyword terms
(exercise or physical activity) and (maternal or pregnancy or pregnant or antepartum or
antenatal or prenatal); limiting the results to those studies involving research on human
subjects retrieved 4229 articles. All titles were read, and 286 studies identified that may
have a bearing on this topic. Of the 286, abstracts were read where available (if not, full
4
relevant results. The systematic search was repeated on 15 April 2009, this time
searching the English-language literature indexed by the National Library of Medicine
using the medical subject heading (MeSH) terms (athletic performane or exercise
tolerance or exercise or physical exertion or physical fitness or exercise therapy or
exercise test or sports or exercise movement techniques or muscle stretching exercises
or resistance training) and (parturition or labor,obstetric or pregnancy outcome or
delivery,obstetric or oxytocin); when limited to human and female, 344 articles were
identified. Of these, abstracts for 84 were read, and 55 original research articles
identified for full-text searching. Of these 55, 27 were duplicates from the earlier search,
leaving 28 new original research articles, and a total of 121 studies identified. This
search was repeated on 15 Dec 2009, and an additional 2 studies were identified.
Physical Activity During Pregnancy and Cesarean Birth
Rates of cesarean delivery in the US have risen steadily since 1970 (see Figure
2.1), prompting the US Department of Health and Human Services to make reduction in
the number of cesareans among low-risk mothers one of the goals of Healthy People
2000, 2010, and 2020.(10) Unfortunately, during the last decade the cesarean rate has
in fact not declined, but rather has risen as sharply as ever, and is currently over
31%.(11) This is of concern from a public health perspective because cesareans are not
5
Figure 2.1. Rates of cesarean birth in the US, 1970-2006. Data from the CDC.
Delivery by cesarean section is associated with increased risk of hysterectomy,
postpartum pain, neonatal respiratory morbidity, neonatal seizures, maternal ureteral
tract injury, accidental laceration of the newborn, infection, and postpartum
hemorrhage.(13-17) Additionally, cesareans increase a woman's risk for uterine
rupture, unexplained fetal death, and placental problems in subsequent pregnancies, not
to mention drastically increase her risk for future deliveries by cesarean.(15) Cesareans
are associated with increases in both neonatal (RR 3.0) and maternal (reported RRs
range from 2.6-7.0) mortality.(15,18-21) Finally, cesarean deliveries cost more than
vaginal births,(12) and are associated with increased lengths of stay and lower patient
satisfaction.(22)
Available evidence suggests that while some of the recent increase in cesarean
6
in cesareans cannot be attributed entirely to a worsening of maternal or fetal risk
profiles.(24-26) This implies that some of the cesareans performed each year in the
U.S. may be medically unnecessary, exposing women and babies to risks without
proven benefit.(27-29) Interventions aimed at reducing cesarean delivery rates should
thus be a public health priority.
Many researchers have examined whether or not physical activity during
pregnancy is associated with cesarean delivery; however consensus has not been
reached. Many studies show a reduced risk of cesarean, but methodologic limitations
are a concern. From the 121 articles identified through the systematic search described
above, 23 were found to report an association between physical activity during
pregnancy and cesarean delivery.(30-52) Twenty-two studies present results for
cesarean vs. all vaginal deliveries, and one reports results for cesarean/operative
vaginal vs. spontaneous vaginal births. Characteristics of these studies are summarized
7
Table 2.1. Characteristics of studies reporting maternal birth outcomes. Abbreviations: LTPA, leisure-time physical activity; CS, cesarean section; RCT, randomized controlled trial; yo, years old, HR, heart rate; str, strength training; int, interval training, endur, endurance training; hx, history; b/c because; PA, physical activity; OVD, operative vaginal delivery; PRAMS, pregnancy risk assessment monitoring system
Author (year)
design location n inclusion criteria exposed control results
Baciuk (2009)
RCT Brazil 71 <20 weeks, singleton,
no complications, early prenatal care,
sedentary, no contraindications to exercise during pregnancy, ≤1 previous cesarean
water aerobics, moderate intensity, 50 minutes 3/week, 70% max HR (women wore HR monitors)
told "not to carry out any regular physical activity during the entire pregnancy"
no significant differences in labor duration or delivery mode Beckmann (1990) prospective cohort; questionnaire and record review
100 n=50 attending
prenatal exercise classes, includes str, flexibility, toning, did not include endur; 1 hour 2/week, ≥12 weeks n=50 from same OB practices, not attending the classes
shorter labor, fewer augmentations, fewer OVD, fewer CS among exposed Botkin (1991) telephone interview postpartum, record review
Iowa 44 delivery ≤6 months ago n=19, LTPA ≥20 minutes, ≥2 times per week, ≥20 weeks of pregnancy
n=25 fewer forceps, shorter stage 2 labors among exposed
Bovbjerg (2009)
cross-sectional North Carolina
1955 PRAMS participant in 2004-2005
during last 3 months of most recent pregnancy, exercise for ≥30 minutes, 1-4 times (n=750) or ≥5 (n=143) times/week
<1 / week (n=1062)
fewer CS among exposed, preterm births only
Bungum (2000)
cohort; retrospective exposure data via questionnaire before delivery; delivery data via telephone interview postpartum
South-western US
137 nulliparous, non-smoking, singleton, 17-40 yo, no complications
pilot-tested checklist; check activities ≥20 min, 3/week during 1st or 2nd trimester; n=44
n=93 fewer CS among
8 8
Clapp (1990)
cohort 131 recreational runners or
aerobic dancers
n=87 who
continued at ≥50% maximal capacity,
≥30 min ≥3/week
n=44 did not continue pre-conception levels of activity
fewer CS, fewer OVD, faster labor, fewer
augmentations among exposed Collings
(1983)
intervention; first 5 not random, rest random
20 n=12; 50 min
3/week at 65-70% capacity
n=8, did not report regular LTPA
longer labors, fewer CS among exposed Dale (1982) retrospective cohort, prospective cohort (results reported together)
44 n=21 delivered in
last 5 years and ran during pregnancy; n=12 currently running during pregnancy n=11 not currently running during pregnancy
more CS among exposed
Erdelyi (1962)
case series Hungary 172 athlete under author's care
athletes --- fewer CS, faster
labor among exposed; no difference in OVD Hall
(1987)
intervention Florida 845 recruited from private OB clinics
tailored exercise prescription, 45 min 3/week
n=82 attended 10-20 sessions n=309 attended 21-59 sessions n=61 attended ≥60 sessions
n=393 attended
≤ 10 sessions
fewer CS among exposed; no difference labor duration Horns (1996) cohort; questionnaire before delivery for exposure, postpartum record review and
telephone interview
101 nulliparous, 20-30 yo, >31 weeks' gestation, no medical conditions
checklist, which for 15-30 minutes continuously
≥3/week
n=48
n=53 fewer CS among
exposed; no difference labor duration Jarrett (1983) retrospective cohort; questionnaire
Chicago 67 self-reported
jogging during pregnancy
--- fewer CS among
exposed than national rate Kardel (1998) intervention, not randomized
Norway 42 elite athletes, non-smokers, low-risk, <20 weeks' gestation, no medications, no alcohol
n=21 high intensity: 72 min str 2/week, 35 min int 2/week, 150 min endur 2/week
n=21 medium intensity: 72 min str 2/week, 25 min int 2/week, 90 min endur 2/week
9 9
Kulpa (1987)
RCT, block stratified by parity; exposure info captured via prospective diary
Michigan 37 primips, 48 multips
18-34 yo, non-smoker, within 15% of ideal body weight, no pregnancy
complications/ medical problems, interest in recreational sports
n= 34 given an exercise prescription following an exercise test, target HR 75% maximum, NFIG
n= 47 maintained target HR <20 minutes per week
no difference in OVD, CS,
lacerations; shorter 1st stage,
primiparas only
Lynch (2003)
intervention 23 sedentary 1st 4 months
pregnancy; nulliparous
40 min swimming, 3/week; HR < 140
--- fewer CS among
exposed than national rate Magann (1996) cohort; validated exposure questionnaire, LTPA and occupational
Australia 2743 ≥18 yo, English-speaking, singleton, prenatal care, 16-18 weeks' gestation
group 4, n=608: expend 2701-2900 kcal/day
group 5, n=172: expend >2900 kcal/day
group 1, n=359: expend ≤2300 kcal/day
group 2, n=545: expend 2301-2500 kcal/day group 3, n=1059: expend 2501-2700 kcal/day
more OVD, more inductions, more CS, longer labor (primiparas only) among exposed
Magann (2002)
retrospective cohort California 750 active duty Navy 4 groups based on voluntary and mandatory activity (group 4 had the most activity)
group 1 more CS, longer labor, more induction, more augmentation, among exposed; no difference OVD
Marquez-Sterling (2000)
RCT Florida 15 low-risk, sedentary ≥1
year pre-pregnancy
n=9
1 hour str & endur, 3/week
n=6 no difference CS
Melzer (2009)
cohort Switzerland 44 low-risk, no history of CS
≥30 minutes, ≥3 times during 7 days of accelerometry
did not
accumulate that amount of activity
fewer OVD, fewer CS, shorter 2nd stage among exposed women Narendran (2005) non-randomized intervention
India 335 35 yo, singleton, 18-20 weeks' gestation, no illness, no yoga training
walk 30 min 2/day 1 hour yoga/day
10 10 Penttinen (1997) retrospective cohort, questionnaire— exposed only! and record review
Finland 60 primiparous n=30 elite
endurance athletes n=30 next woman delivering at same hospital— assumed did less exercise than elite athletes
more CS among exposed; no difference labor duration
Pomerance (1973)
cross-sectional California 41 wives of Naval officers, low-risk, no history of CS
fitness test results --- higher fitness assoc. with shorter labor, multiparas only
Rice (1991)
cross-sectional Kentucky 23 ≥30 minutes,
≥3/week aerobic exercise
do not meet exposed definition
longer 2nd stage among exposed, but more primiparas in exposed group; no difference 1st stage Zeanah (1993) retrospective cohort, pilot-tested questionnaire national physical fitness conferences
173 high-intensity
(n=18)
long-duration (n=37)
above groups not mutually exclusive
moderate- or low-intensity
medium- or short-duration
11
Summary of Previous Literature on Cesarean/Physical Activity (PA)
Botkin (32) and Kulpa (43) found "no difference" in cesarean rates between the
exercising women and control women. In the Kardel study (42), one woman in each
equally-sized group had a cesarean; in the Marquez-Sterling study (47), 3/9 exercising
women and 2/6 control women (33% each) delivered via cesarean.
Three studies did not have control groups.(38,41,44) The Jarrett and Lynch
studies were conducted in the U.S. and reported cesarean rates of 17% and 5.1%
among active women; the U.S. cesarean rates for those years were 22% and 20%,
respectively. Erdelyi reported that 2.19% of his 172 athlete-patients delivered
abdominally, while the national average in Hungary at that time was 4.1%. Though the
women participating in these studies are almost certainly not representative of the
American or Hungarian childbearing populations as a whole, the numbers lend some
credence to the hypothesis that physical activity during pregnancy is associated with
reduced cesarean delivery rates.
Eight studies report that women who were active vs. sedentary, or women who
exercised more rather than less, were less likely to deliver via cesarean. Bungum (34)
reported an odds ratio of 4.48 (95% CL: 1.23-16.23, p = 0.02) for cesarean delivery if a
woman was sedentary during pregnancy, controlling for age, weight gain, epidural use,
place of delivery, induction, labor duration, and pre-gravid exercise. Confounder control
is important; however based on the causal diagram shown in Figure 2.2, Bungum et. al.
may well have controlled for variables on causal pathways, and thus their reported result
may be biased. In the Clapp study (35), 6% of women who continued exercising at
pregravid levels delivered via cesarean, compared to 30% of women who did not,
chi-square p = 0.01. In the Collings study (36), 2 control women had cesareans but no
12
28% of controls, 23% of low-level exercisers, 10% of medium-level exercisers, and 7%
of high-level exercisers delivered by cesarean (p for trend < 0.001). In the Horns study
(40), 32% of sedentary women had cesareans compared to 25% of active women (p =
0.6). Baciuk et. al. reported 36% cesareans in the 34 women randomized to water
aerobics and 46% in the 37 women randomized to the non-exercising group (X2 p =
0.6).(30) However, this study was small and randomization did not work well; the control
group had both more nulliparous women and more women with a history of cesarean
delivery, either of which could explain the discrepancy in cesarean rates between the
groups. Melzer et. al. reported an odds ratio of 7.65 (95% CI 1.27-45.84, adjusted for
parity, gestational weight gain, and birth weight), indicating that active women in their
sample had fewer cesarean births.(48) Finally, Bovbjerg et. al. reported fewer
cesareans among women reporting at least one 30-minute exercise session per week
during the last 3 months of the most recent pregnancy, compared to those reporting less
than 1 such session per week (OR 0.65 [0.38, 1.13] for 1-4/week, 0.62 [0.29, 1.33] for
≥5/week, compared to <1/week; adjusted for gestational age, parity, and hypertensive
disorders of pregnancy), but among women delivering preterm only.(33) Given the text
of the question used in the Bovbjerg study (exercise during the last 3 months), it is
unclear whether preterm births themselves, or merely the timing of the exercise in
13
Figure 2.2 (on next page): Directed Acyclic Graph showing the causal relationships between minutes of moderate to vigorous physical activity (MVPA) and delivery mode. Abbreviations: GA, gestational age; SES, socio-economic status; DM, diabetes mellitus (pre-existing or gestational); PEH, pre-eclampsia, eclampsia, HELLP syndrome; Pt pref, patient preferences for labor and delivery; ed, education; BW, birth weight, contraind, contraindications to activity during pregnancy, includes incompetent cervix, 3rd trimester bleeding, placenta previa or abruption, and undelivered preterm labor; mild HTN, mild hypertension, includes chronic and pregnancy-induced hypertension; pre-preg PA, amount of physical activity prior to the index pregnancy. The double arrows between Pt pref and provider pref indicates uncertainty in the direction of the association; the DAG was analyzed with each arrow separately and the results did not change. Variables in blue are on causal pathways; variables in pink and green represent a minimally-sufficient adjustment set.
15
Four studies report that women who are active vs. sedentary, or who are more
active vs. less active, are more likely to deliver via cesarean. In the Dale study (37),
15% of runners and 11% of controls delivered via cesarean (Fisher's exact test, p = 0.9).
In Magann (1996) (45), primiparous women in group 5 (who expended the most energy)
had more urgent/emergent cesareans than did women in other groups, though these
subgroups analyses were performed post hoc. In Magann (2002) (46), 15% of women in
group 1 (the least active women), 13% of women in group 2, 15% of women in group 3,
and 22% of women in group 4 had cesareans. This increase for group 4 was not
statistically significant, and was driven by an increase in urgent/emergent operations. In
the Zeanah study, women in the low- and moderate-intensity groups had fewer
cesareans than did women in the high-intensity group, p < 0.05.(52)
The Narendren study reported mixed results. Women in the yoga group had
more elective cesareans than did those women in the walking group (22% vs. 16%, p =
0.4) but fewer urgent/emergent cesareans (23% vs. 33%, p = 0.2).(49)
Finally, Beckmann et. al. reported the results of combined forceps/cesarean
deliveries compared to spontaneous vaginal deliveries.(31) The exercising group had
5/50 operative deliveries, whereas the non-exercising group had 22/50 (Fisher's exact
test p = 0.002; the paper reports the result of a chi-square test).
To summarize the cesarean results, which are too heterogeneous for formal
meta-analysis, the studies indicate that physical activity during pregnancy may decrease
a woman's risk of delivering by cesarean. Half of the papers reporting this association
were statistically significant, despite smaller average sample sizes; the papers
(especially the 2 Magann studies) showing a trend towards a detrimental effect of
16
studies without control groups add a bit of weight to the argument, with the caveat that
the question is far from resolved.
Physical Activity During Pregnancy and Induction of Labor
The Listening to Mothers II survey estimated that 41% of women in the US
currently have their labors induced.(53) This is of concern from a public health
perspective because while induction is a necessary intervention in some scenarios, it
carries risks for both mother and baby, including increased risk of uterine
hyperstimulation (which in turn can lead to fetal distress or non-reassuring fetal heart
rate, fetal acidosis, meconium aspiration, postpartum hemorrhage, and uterine rupture),
placental abruption, uterine infection, respiratory distress/transient tachypnea of the
newborn, operative delivery, lacerations, and maternal hypotension; increased use of
regional anesthesia because augmented contractions are more painful; increased
neo-natal intensive care unit (NICU) admissions; longer labor duration, and possible
gastrointestinal side effects or fever if prostaglandins are used.(54-58) One also runs
the risk of iatrogenic prematurity.(59) Inductions cost between 15-20% more than do
deliveries subsequent to spontaneous labor.(60)
The systematic review of the literature described above found five studies
reporting an association between physical activity during pregnancy and induction of
labor. Unfortunately only one of the 5 studies reporting associations between prenatal
physical activity and labor induction specified indication for induction: Lynch et.al. report
that 1 of 23 women in the intervention group was induced at 34 weeks' gestation for
pre-eclampsia.(44) However, as the Lynch study did not include a control group, it is difficult
to interpret this number. The Bungum study specified that there were no differences
between groups for "other medications"—a category which may or may not include
17
Results vary across the remaining 3 studies. Clapp et. al. report that 13% of
women continuing pre-pregnancy training were induced compared to 14% of controls, a
non-significant difference.(35) The Magann (1996) study reported that there were more
inductions in group 5 (who expended the most energy per day), p = 0.04.(45) The other
Magann (2002) study reported RR 1.84 (95% CL: 1.05, 3.20) for requiring induction if a
woman was more active (46); however this calculation cannot be replicated using
numbers reported in the paper. From Table 3 in the Magann paper, 8% of women were
induced in group 1 (the group engaging in the least amount of activity), 14% in group 2,
13% in group 3, and 15% in group 4, X23 = 6.2, p 0.10, suggesting that perhaps being
somewhat sedentary is associated with lower risk of induction but there is a low
threshold for activity above which a woman's risk increases but not in a dose-response
fashion.
The data reported in the literature for an association between physical activity
during pregnancy and labor induction are sparse and inconclusive, though currently they
trend towards a higher risk of induction if a woman is physically active during pregnancy.
If indeed physically active women are less likely to experience spontaneous onset of
labor, it is unclear what the clinical and public health implications would be. Risks from
more inductions may be offset by known benefits of physical activity, but this would be a
18
Physical Activity During Pregnancy and Labor Duration
Duration of labor has important consequences for patients. Labor duration is
strongly associated not only with the use of medical interventions (which themselves
may be important patient-oriented outcomes, such as episiotomy or operative delivery)
but also with patient satisfaction.(61-64) Labor duration is also associated with neonatal
outcomes such as Apgar scores and NICU admissions.(63) Duration of labor also has
billing, staffing, and patient volume implications for clinicians and hospitals.
The systematic review of the literature described above found sixteen studies
that reported associations between duration of labor and physical activity during
pregnancy.(30-32,34-36,38-40,43,45-46,48,50-51,65) It is difficult to synthesize the
results of these studies because of markedly different outcomes (duration of 1st stage,
total duration of labor, etc) and varying definitions within a single outcome (does the
second stage start at full dilatation or with pushing? does it end with birth of the baby or
with cutting the cord? does total labor duration include stage 3 or not?). A summary of
19 19
Table 2.2: Summary of labor duration studies. Data are mean ± SD unless otherwise noted; if definition of labor duration is not specified, or if exact numbers are not given, none were stated in the paper.
significantly shorter among active women
NS shorter no difference NS longer significantly longer
Stage 1 (hours)
Clapp1,2: 3.72±2.23 vs. 5.03±3.18, p = 0.01
Horns: 11.5±5.8 vs.
12.6±10.3
Rice: 6.1±2.3 vs. 6.7±3.1, t-test p = 0.2
Botkin Collings: 9.2±4.3 vs. 7.2±2.5
Penttinen: 10.43±5.53 (range 1.67-27.0) vs. 9.6±5.37 (range
0.67-26.25)
Magann(1996): primiparous women who expended the most energy had longer stage 1 labors: median 7.4 hours
vs. 6.0-6.5 hours for other groups, controls for maternal age
Stage 2 (minutes)
Botkin3: 27±20 vs. 59±48, t-test p = 0.004
Horns6: 120±186 vs.
132±252
Kulpa7
Hall9
Penttinen: 27.9±17.8 (range 4-62) vs. 27.8±27.2 (range 5/125)
Collings: 46.6±35.7 vs. 41.7±41.3
Rice10: 38.2±32.8 vs. 19.9±10.3,
p = 0.09 Stage 3
(minutes)
Botkin
Total (hours)
Clapp2,4: 4.40±2.48 vs. 6.37±4.58, p = 0.01
Pomerance5: higher physical fitness associated with shorter labor duration,
R = -0.65, p = 0.04
Erdelyi8 Horns: 13.4±6.6 vs. 14.6±10.6 Baciuk Botkin Bungum Hall9
Kardel11: 9.4±5.9 vs. 6.7±5.512; 11.7±3.4 vs.
8.0±2.613
Magann (2002): RR for most active group vs. least active group 1.38 (95%
CL: 1.16-2.60)
1
4 cm to 10 cm; 2 explicitly limited to women delivering vaginally; 3 complete dilation to birth of the baby; 4 stage 1 + stage 2; no definition given for end of stage 2 5
among multiparas only; 6 these seem unusually long—perhaps this includes stage 3? unclear from the paper 7
"The primigravid group in the exercise group appeared to have a shortened active phase in the second stage of labor when compared with the primigravid women in the control group. No differences were seen for multiparas." No numbers were reported. It is unclear to which stage of labor this is referring—active labor (i.e. mid- to late stage 1) or stage 2.
8
Erdelyi reports that 150 of the 172 athletes under his care "delivered their babies faster than the established average." He also mentions that stage 2 lasted about half the duration as expected from non-athletes. No explicit comparison group.
9
Primiparas only, because parity not evenly distributed among the groups 10
Based on 18 vaginal deliveries; would be significant if not underpowered 11
stage 1 + stage 2, defined as contractions 5 minutes apart until birth of the baby 12
20
In summary, some studies report longer total labors, stage 1, or stage 2 labors in
exercising women; others report shorter labors. Many report no significant differences,
though in many cases power is an issue. Only 4 studies report differences separately
for primiparous vs. multiparous women (39,43,45,51), and for the latter 2 of those it
appears to be an unplanned post hoc comparison. Controlling for primiparity should be
automatic when reporting labor duration results, as the course of labor is so markedly
different for these women. Only 2 studies explicitly limit the population to women
delivering vaginally—presumably all studies did this, but this is uncertain.(35,42)
It is difficult to synthesize these results because of heterogeneity of exposures,
outcomes, and reporting methods; however when taken as a whole there does not seem
to be a consensus of the relation between PA during pregnancy and labor duration.
Studies to date have not used rigorous PA ascertainment methods or standardized labor
duration definitions; many have also been underpowered and none used appropriate
statistical techniques (though as discussed above, a few controlled for parity or operative
vaginal delivery (OVD)—though OVD is inappropriate to include as a confounder).
Physical Activity During Pregnancy and Labor Augmentation
Augmentation of labor is closely tied to labor duration; conceivably if women who
are more active have either shorter or longer labors then use of labor augmentation for
these women would also vary. It is also possible that physical activity during pregnancy
may be related to labor augmentation directly, if an active woman's body works more
efficiently.
Labor augmentation, though often required and used successfully to avoid
operative deliveries (and their sequelae) resulting from poor progress or maternal
21
baby, and therefore should be used judiciously in clinical practice.(66) Adverse
outcomes associated with labor augmentation include increased risk of uterine
hyperstimulation (which in turn can lead to fetal distress or non-reassuring fetal heart
rate tones, fetal acidosis, meconium aspiration, postpartum hemorrhage, and uterine
rupture), placental abruption, uterine infection, respiratory distress/transient tachypnea of
the newborn, operative delivery, lacerations, and maternal hypotension; increased use of
regional anesthesia because augmented contractions are more painful; increased NICU
admissions; and longer labor duration.(54-58) Some of these associations are the result
of the augmentation itself (hyperstimulation, increased epidural use), some (labor
duration, operative delivery) are probably confounded by upstream factors such as
dystocia. In some cases the causal relationship may be unclear; for example the
increase in perineal lacerations may be secondary to increased vaginal operative
deliveries or it may be that oxytocin during the second stage causes the baby to be born
so quickly that the perineal tissue does not have a chance to stretch.
The systematic review of the literature described above found three studies that
report an association between physical activity during pregnancy and labor
augmentation, and one additional study that may report such an association. Beckmann
et. al. reported that 2/50 women attending prenatal exercise classes required labor
augmentation compared with 8/50 women not attending such classes (Fisher's exact test
p = 0.09; paper reports a chi-square test).(31) The Clapp study reports that 13% of
women who continued pre-gravid levels of training required labor augmentation
compared to 20% of women who did not (p = 0.01).(35) The Magann (2002) study in
Active Duty Navy women reports that women who were in the highest of 4 levels of
prenatal exercise were more likely to require oxytocin for induction or augmentation than
22
Finally, in the research presented by Bungum et. al., "No significant differences were
found between active and sedentary women for the use of epidural anesthesia, other
medications…" (p. 261).(34) It is unclear from the text whether or not this category of
"other medications" might include oxytocin, or whether it merely includes other forms of
analgesia.
In summary, consensus has not been reached regarding PA during pregnancy
and need for labor augmentation. Previous efforts have been hampered partly by their
non-generalizeable study populations and poor exposure ascertainment (see Table 2-1),
but also by the lack of appropriate confounder control. None of the studies presented in
this section conducted any adjusted analyses for this association.
Physical Activity During Pregnancy and Operative Vaginal Delivery
Vaginal operative deliveries (OVD), though associated with less overall maternal
morbidity than cesarean deliveries, are nonetheless associated with increased risks of
perineal laceration, episiotomy, anal sphincter injury, neonatal trauma, maternal
hemorrhage, urinary incontinence, and cervical laceration when compared with
spontaneous vaginal deliveries.(67-75) They are also associated with lower APGAR
scores and increased need for neonatal resuscitation.(69,72) Some risk factors for OVD
are not modifiable, or not easily modifiable: parity, fetal gender, and fetal
presentation.(75-77) However, several modifiable risk factors are known, including labor
duration, epidural use, birth weight, and maternal overweight or obesity (63,76-79)—
each of which may in turn be affected by physical activity during pregnancy. Increasing
women's physical activity during pregnancy could have an impact on rates of OVD, thus
reducing maternal and neonatal morbidity.
The systematic review of the literature described above found eleven studies
OVD.(31-32,34-35,37-38,42-23
43,45-46,50) Of these, nine present results for spontaneous vaginal vs. operative
vaginal, one reports results for cesarean/operative vaginal vs. spontaneous vaginal, and
one reports use of "obstetric interventions," a category which includes use of forceps.
These studies are summarized in Table 2.1.
Both Bungum (34) and Kulpa (43) report "no significant differences"; Erdelyi (38)
reports that the athletes under his care had a forceps delivery rate of 6.0%, which is
nearly identical to the 6.1% reported in Hungary as a whole at that time. As mentioned
above in the discussion on cesarean delivery, Beckmann et. al. (31) reported the results
of combined forceps/cesarean compared to spontaneous vaginal deliveries. The
exercising group had 5/50 operative deliveries, whereas the non-exercising group had
22/50 (p = 0.002). Botkin et. al. reported that 19/25 (76%) non-exercising and 8/19
(42%) exercising women (p = 0.06) had an "obstetric intervention", a category which
included forceps, oxygen resuscitation, or use of a fetal monitor.(32)
Clapp et. al. reported OVDs at the rate of 9/31 (29%) in the women who reduced
their exercise as pregnancy progressed, and 5/82 (6%) in the women who continued
exercising at their pre-conception levels (p = 0.003).(35) Dale reported 5/10 (50%)
operative vaginal deliveries in controls and 8/28 (29%) in runners (p = 0.26).(37) Kardel
found 3/20 operative vaginal deliveries in the medium-intensity group, and 2/20 in the
high-intensity group (p = 0.9).(42) Penttinen found 8% vaginal operative deliveries in the
exposure group and 11% in the control group, a non-significant difference.(50)
Magann (1996) found fewer operative vaginal deliveries only among multiparous
group 1 women (who expended the least amount of energy per day).(45) In the Magann
24
vacuum extraction, compared to 19% in group 2, 22% in group 3, and 17% in group 4 (p
= 0.6 for trend).(46)
It is difficult to draw firm conclusions about the relationship, if any, between
physical activity during pregnancy and OVD based on currently-published studies.
Physical Activity During Pregnancy, Episiotomy, and Perineal Lacerations
Episiotomy and perineal lacerations are important patient-oriented outcomes of
delivery. Sequelae to episiotomy include increased risks of maternal hemorrhage,
infection, antibiotic use, anal sphincter injury, severe perineal laceration, and neonatal
trauma; decreased patient satisfaction; and longer durations of both catheter use and
hospital stay.(67,80-81) Increasing severity of perineal laceration is associated with
increased maternal hemorrhage, infection, urinary incontinence, fecal incontinence,
dyspareunia, rectovaginal fistula, and pain; and decreased pelvic floor muscle strength
and sexual functioning postpartum.(67,73,82-83) Interventions with the potential to
reduce rates of episiotomy and laceration would be of great interest to patients, and also
of interest to payers, clinicians, and patients' families.
The systematic review of the literature described above revealed three studies
that reported associations between physical activity and perineal lacerations and two
studies that reported associations between episiotomy use and physical activity during
pregnancy; characteristics of these studies are presented in Table 2.1.
Bungum reported no significant differences in episiotomy between women who
had exercised throughout their pregnancies and those who hadn't; exact numbers were
not reported.(34) Clapp et. al. reported that 38/82 (46%) women who maintained a high
level of activity during pregnancy had episiotomy compared to 25/31 (81%) women who
25
these studies, especially given the practice trend towards decreased routine episiotomy
use since they were conducted.(84)
For perineal lacerations, the Kulpa study reported no differences between
groups, but with no further details.(43) The Penttinen study reported no "vaginal or
perineal ruptures" in either group.(50) The Magann (2002) study classified active duty
Naval women into 4 groups based on voluntary and mandatory activity; group 1 had the
least amount of total activity during pregnancy and group 4 had the most.(46) There
were no differences in severity of lacerations across these 4 groups, X 26 = 6.6, p = 0.4.
At this time, one cannot say for certain whether or not physical activity during pregnancy
is associated with perineal lacerations.
Summary
Research on maternal birth outcomes following PA during pregnancy is plentiful
for some outcomes (delivery mode, labor duration) and sparse for others (episiotomy,
lacerations, induction, augmentation). This literature suffers from small
non-population-based samples, retrospective exposure ascertainment, poor outcome characterization,
and little or no confounder control. At this point it is unclear what associations, if any,
exist between physical activity during pregnancy and these maternal birth outcomes. If
causal, these would be complex relationships—perhaps the most important
methodologic improvement that could be made in future studies is appropriate
confounder control.
From a public health perspective, if PA during pregnancy were indeed associated
with fewer adverse maternal birth outcomes, then encouraging women, especially
pregnant women, to be physically active would represent a low-risk, low-cost potential
intervention that could conceivably reduce not only maternal and fetal/neonatal morbidity
26
associated with more adverse maternal birth outcomes, the public health implications
would be less clear. Perhaps the increase in adverse birth outcomes would be "worth
it," given the many known benefits of physical activity, both in general and during
pregnancy—but perhaps it would not. In this scenario, it may be more of an individual
choice, with each pregnant woman weighing the pros and cons herself or in conjunction
with her health care provider—in which case results of research on this topic would have
important patient counseling implications. Either way, resolving the uncertainty
surrounding the relationship between physical activity during pregnancy and maternal
birth outcomes via well-designed, appropriately-analyzed studies is a wise use of limited
RESEARCH DESIGN AND METHODS
The vast majority of the methods are detailed in the two papers resulting from
this dissertation project, which can be found in later chapters. Here the basic methods
are reiterated and the logic behind the methods decisions is discussed.
This study was a secondary data analysis of a pregnancy cohort study, designed
to assess the associations, if any, between physical activity (PA) during pregnancy and
maternal birth outcomes such as delivery mode, episiotomy, perineal lacerations, labor
duration, induction, and augmentation. Exposure data came from the third Pregnancy,
Infection, and Nutrition (PIN3) cohort, and included detailed 7-day PA recalls during two
windows in pregnancy: the first at 17-22 weeks, the second at 27-30 weeks. The bulk
of the outcomes data came from a clinical database kept by the Obstetrics department at
UNC, which is populated from medical records.
Paper 1 explored the association between maternal PA and cesarean delivery,
among women without a history of cesarean. One objective of this paper was to
determine if in fact PA predicts cesarean birth, but the other was to explore the
characteristics of the association, if any: was there a dose-reponse relationship? If yes,
was it linear? Did the association change depending on gestational age at time of
exposure? To address these questions analytic methods new to this topic area were
used (made possible by the excellent and extremely detailed PA data available in the
28
depart from linearity in the log risk as necessary to ensure adequate model fit, and using
data from the two time points separately.
Restricted cubic splines were used for all non-linear models. This method was
chosen over other ways of relaxing the linearity assumption (namely polynomials) for
four reasons. First, polynomials require the model to be fit with all lower-order terms
included—i.e. if adding a quadratic term, the non-squared exposure term must be
included as well. As one would expect, these terms are collinear, which can lead to
instability in the predicted estimates. Second, spline terms are able to capture function
shapes which are not exact polynomials. With no previous studies using continuous
exposure data, no prior guess as to the shape of an association was available. Third,
restricted splines are so-named because they are restricted to be linear in the tails
(outside of the outermost knots). This decreases the influence of data points at the
extremes of exposure, though in this case it did not work perfectly (see Paper 1). Lastly,
restricted splines generally use fewer degrees of freedom than their corresponding
polynomial term.
Biostatisticians agree that when using restricted splines, the important parameter
is the number of knots, with results being much less dependent on knot location.(85)
Common advice is to use four knots, preferably five should the sample size be adequate
(n=400 or so). However, as mentioned in Paper 1, using either five or four knots with
these data resulted in overfitting in the exposure ranges of 0-5 hours/week, presumably
because this is where the bulk of the data lie. It seemed highly implausible that the risk
of cesarean truly increased, then decreased, then increased, then decreased again, all
within the 0-5 hours/week span—using 3 knots solved this problem, and
29
secondary importance, evenly-spaced percentiles were used, as recommended by a
prominent text on the subject.(85)
Models were built using a backwards step-wise variable selection process,
selecting covariables for retention using a model fit criterion based on Analysis of
Deviance. Deviance is equivalent to two times the log likelihood; the software used for
this project happens to report deviance and not the log likelihood, but conclusions would
be identical from either method. A change-in-estimate criterion was not employed
because many PA exposures were expected to be non-linearly related to the outcomes.
Effect estimates in such cases have less meaning, being so highly dependent on exactly
which two exposure levels one compares.(86)
Paper 2 explored labor patterns for women accumulating varying amounts of PA.
The methods used in Paper 2 built on the conclusions from Paper 1. First, in Paper 1
results sometimes varied depending on which exposure time point was used, 17-22
weeks vs. 27-30, implying a potential effect of gestational age (GA) at time of exposure
ascertainment. However, including more finely-measured GA at time of exposure (i.e.
GA in days at time of the telephone interview) did not improve the fit of any of the
models in Paper 1, and therefore it was not included in Paper 2.
Likewise, Paper 1 explored whether or not PA at 17-22 weeks should be included
as a covariable in models using PA at 27-30 weeks as the main exposure. This was
intended to isolate the effects of activity at the second time point, though collinearity was
a potential threat to validity. However, in no case did including the earlier estimate of PA
improve model fit, and so this exercise was not repeated for Paper 2. Analysis elements
from Paper 1 which were carried over included allowing for non-linear effects and
30
proposal discussed looking at indication for induction; however, given the poor data
quality for indication for cesarean (see Paper 1), this aspect of the analysis was not
pursued.
Missing data was a problem for the data set used in Paper 2; three variables
were missing more than 5% of the data. Multiple imputation was used to address this
concern. The imputed data sets were generated using the aregImpute( ) function in the
Hmisc library for S-Plus (87), using 3 burn-in repeats followed by 10 iterations that were
then used as the imputed data sets. The model which generated the imputed data
included all exposure and outcome variables, race, marital status, maternal age,
maternal education, percent poverty, pre-gravid BMI, gestational diabetes, chronic
hypertension, pre-existing diabetes, Bishop's score on admission, parity, pre-conception
PA, PA during the first trimester, history of OVD, contraindications to PA during
pregnancy, gestational age at birth, and birthweight. For all subsequent analyses,
models were fit using the fit.mult.imput( ) function (also from Hmisc); this function fits
each model 10 times, once with each of the imputed data sets, averages the
coefficients, and reports standard errors inflated to account for multiple model fittings.
One topic unique to Paper 2 is the decision to limit the sample to women who
had a vaginal birth. For some outcomes, such as operative vaginal delivery (OVD),
episiotomy, and laceration severity, restricting to women who had a vaginal birth is
obviously the correct choice. For labor duration, however, arguably one could also
include women who had a cesarean birth. After much thought, they were not included,
for three reasons. First, it was unclear whether their labor durations should be
right-censored or not. On the one hand, if a woman is laboring at 6 cm, and her membranes
rupture and her cord prolapses, leading to a cesarean, then she did not experience the
31
"end" of labor is defined in all obstetrics and midwifery texts as either "birth of the baby"
or "birth of the placenta"—both of which occur during cesarean delivery. So in that case
the 6 cm woman's labor duration should NOT be right-censored. Which is it? One can
easily argue either way, and neither, perhaps, is entirely correct.
The second reason labors ending in cesarean were not included is that even
more so than vaginal births, cesarean births are a heterogenous group. If the woman
described above had five hours of labor before her cesarean at 6 cm, can she really be
grouped with a woman who got to 10 cm and had a vaginal birth, all within five hours?
Otherwise, can she be grouped legitimately with a woman who had 22 hours of labor,
including 4 hours of pushing, and a cesarean at the end for maternal exhaustion?
Whether censored or not, one or the other of these comparisons would be made, and
again, neither is quite correct.
Finally, the public health/patient education message to be gleaned is unclear.
Suppose that, among labors destined to end in cesarean, women reporting more
hours/week of PA had shorter labors than those reporting fewer hours. What, then, to
do with this information? At this time we are entirely unable to predict which labors will
end in cesarean, so having ready advice on how to behave during pregnancy for those
women is moot.
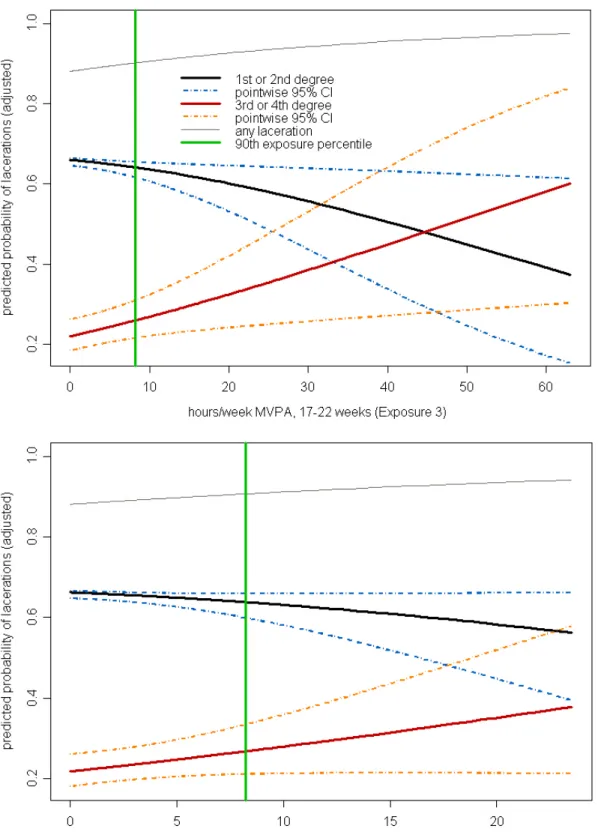
In Paper 2, the proportional odds model was used to examine PA and laceration
severity. In the graphical results for that outcome, the odds of at least mild severity were
subtracted from the odds of at least severe to obtain the odds of mild alone. This was
not detailed in the methods section of that paper, given that the target audience is
clinicians. Additionally, because the proportional odds model was used for laceration
32
Binomial regression would have been a better choice for most of the outcomes, given
that they were relatively common, but the results are much clearer if they always refer to
odds and odds ratios (OR) when discussing models, rather than ORs in some cases and
PAPER 1
Physical Activity During Pregnancy and Cesarean Birth
Authors: Marit L. Bovbjerg, Anna Maria Siega-Riz, Kelly R. Evenson, William Goodnight
Support: Funding for this study was provided by National Institutes of Health (NIH: Bethesda, Maryland) / National Institute of Child Health and Human Development (#HD37584, #HD052468-01A2), NIH / National Cancer Institute (#CA109804-01), NIH/National Institute of Diabetes and Digestive and Kidney Diseases (#DK061981-05), and NIH General Clinical Research Center (#RR00046). Funding was also provided by the University of North Carolina at Chapel Hill Department of Obstetrics and Gynecology (UNC-OB/GYN: Chapel Hill, North Carolina). The content is solely the responsibility of the authors and does not necessarily represent the official views of the NIH or of UNC-OB/GYN.
34
Abstract
Background: Studies of physical activity during pregnancy and cesarean birth
report inconsistent results. Methods: Physical activity data were collected from 1205
North Carolina pregnant women without prior cesarean, between 2001-2005. Data were
collected via 7-day recalls, at 17-22 weeks' and 27-30 weeks' completed gestation, and
included recreational, occupational, transportation, care-giving, and indoor/outdoor
household activities. Outcome data are from medical records. We analyzed physical
activity as a continuous variable using binomial regression. Multivariable models
controlled for primiparity, contraindications to exercise during pregnancy, pre-eclampsia,
BMI, and percent poverty. Results: In unadjusted analyses, physical activity during
pregnancy is associated with cesarean if all intensities of activity are included, but not if
exposure is limited to moderate /vigorous activity. This association is non-linear and
reverses direction when one considers exposure at 17-22 weeks versus 27-30 weeks.
However, the strong unadjusted effect is largely attenuated when controlling for
confounders, when exposure is limited to recreational activity only, or when women
reporting volumes of activity in the upper 2.5% are dropped. This pattern of results
suggests that the association may be spurious secondary to residual or unmeasured
confounding. Conclusions: There is no overall association between physical activity
and cesarean birth. Future studies using maternal physical activity as an exposure
should treat it as a continuous variable, allow it to depart from linearity at least in
preliminary analyses, and give careful consideration to all potential confounders,
35
Introduction
Cesarean rates have risen dramatically in the U.S., and are currently over
32%.(88) Cesareans, though sometimes life-saving procedures, are not risk-free.
Interventions which reduce the cesarean rate could improve both neonatal and maternal
outcomes as well as control costs.(12,16,19)
One proposed intervention is physical activity (PA) during pregnancy, the theory
being that an active woman is better able to withstand the rigors of labor and birth.
Twenty-two previous studies examined the association between PA or exercise during
pregnancy and risk of cesarean.(30-49,51-52) Effect estimates are not consistent
across studies, with results split among those showing no effect (32-33,42-43,47), an
increased risk (37,45-46,49,52), and a decreased risk (30-31,33-36,38-41,44,48-49,51)
of cesarean with higher levels of PA or exercise.
Several methodological issues arise when examining the body of work on this
issue, including small samples, varying exposure definitions, inadequate methods for
ascertaining exposure, questionable generalizeablility, and inadequate statistical
methods. Only three studies conducted multivariable analysis (33-34,48), all 22
categorized the exposure, and only one explicitly accounted for timing of activity in
relation to gestational age of the fetus.(33)
This study had two objectives. The first was to explore the associations between
maternal PA and cesarean risk, noting the shape of a possible dose-response curve and
timing of PA in relation to gestational age. The second was to conduct a rigorous
36
Methods
The aims were addressed by merging two data sources. The first was the third
Pregnancy, Infection, and Nutrition (PIN3) cohort, an ongoing study of pregnancy in
central North Carolina that provided PA exposure data. The PIN3 Study recruited
women, January 2001 through June 2005, from prenatal clinics affiliated with the
University of North Carolina (UNC) Hospitals. Women were eligible if they presented for
antenatal care before 20 weeks' gestation, intended to deliver at a UNC hospital, were
carrying a singleton fetus, were ≥16 years old, read and spoke English, and had access
to a telephone. Complete details about the data collection protocols can be found at the
PIN3 website (http://www.cpc.unc.edu/pin/design_pin3.html).
The PIN3 Study collected 7-day PA recalls by telephone interview at 17-22
weeks' and 27-30 weeks' gestation. These detailed interviews collected information
about occupational, recreational, indoor and outdoor household, care giving, and
transportation activities. Women were asked to list the specific activities, the frequency
and average duration for each, and to rate the intensity of the activity as "fairly light,"
"somewhat hard," or "hard or very hard." Expert review of selected taped interviews
ensured consistency among interviewers. The entire questionnaire, along with evidence
demonstrating reliability and validity in pregnant women, is available elsewhere.(89)
Based on the recall data, women were assigned values for total hours/week of
PA, and hours per week of moderate-to-vigorous PA (MVPA—anything rated as at least
“somewhat hard”). These calculations were conducted separately for each recall, and
also for recreational activity only.
PA data were examined for outliers. Paper records for women who reported
37
hours/week of total PA (or more than 40 hours of MVPA), and women whose average
duration for a given bout of PA exceeded 1 hour were reviewed. Data entry errors were
corrected, and unreasonable values were set to missing.
The second data source, which provided outcomes data, was the Perinatal
Database maintained by the UNC Hospitals Department of Obstetrics and Gynecology.
Data were collected by labor and delivery (L&D) nurses, who review medical records for
all admitted women and fill out a 12-page Perinatal Record form containing information
on demographics, obstetrical history, prenatal care, comorbidities, assessment on
admission to L&D, the course of labor, and any complications arising during L&D.
Monthly validity checks allow correction of impossible or inconsistent values.
The outcome for this paper was primary cesarean birth. We considered a
woman to have a cesarean delivery if her delivery mode was recorded as primary
planned cesarean or primary emergent/urgent cesarean. Though we did not address
reliability or validity of the outcome for this study, delivery mode is typically accurately
and prominently recorded in medical records because of patient care needs, liability
concerns, and billing requirements.
These data sources were merged on mother's medical record number and baby's
date of birth. Following electronic merge, additional matches were made by hand. 3203
women were eligible for PIN3; of these 2006 agreed to participate (63%). Of the 2006,
2% became ineligible (4 multiple pregnancies, 43 pregnancy losses), 9% were lost to
follow-up (126 did not complete any questionnaires or interviews; 48 asked to be
dropped later in the study), and 121 (7%) were participating for the second or third time,
leaving 1654 participants. Of these, 1488 (90%) were successfully merged with the