Experimental Analysis of Functional Variation within Protein
Families: Receiver Domain Autodephosphorylation Kinetics
Stephani C. Page,a*Robert M. Immormino,b*Thane H. Miller,bRobert B. Bourretb
Department of Biochemistry & Biophysics, University of North Carolina, Chapel Hill, North Carolina, USAa; Department of Microbiology & Immunology, University of North Carolina, Chapel Hill, North Carolina, USAb
ABSTRACT
Plants and microorganisms use two-component signal transduction systems (TCSs) to mediate responses to environmental stimuli. TCSs mediate responses through phosphotransfer from a conserved histidine on a sensor kinase to a conserved aspar-tate on the receiver domain of a response regulator. Typically, signal termination occurs through dephosphorylation of the re-ceiver domain, which can catalyze its own dephosphorylation. Despite strong structural conservation between rere-ceiver domains, reported autodephosphorylation rate constants (kdephos) span a millionfold range. Variable receiver domain active-site residues
Dⴙ2 and Tⴙ2 (two amino acids C terminal to conserved phosphorylation site and Thr/Ser, respectively) influencekdephos
val-ues, but the extent and mechanism of influence are unclear. We used sequence analysis of a large database of naturally occurring receiver domains to design mutant receiver domains for experimental analysis of autodephosphorylation kinetics. When com-bined with previous analyses,kdephosvalues were obtained for CheY variants that contained Dⴙ2/Tⴙ2 pairs found in 54% of
receiver domain sequences. Tested pairs of amino acids at Dⴙ2/Tⴙ2 generally had similar effects onkdephosin CheY, PhoBN,
or Spo0F. Acid or amide residues at Dⴙ2/Tⴙ2 enhancedkdephos. CheY variants altered at Dⴙ2/Tⴙ2 exhibited rate constants for autophosphorylation with phosphoramidates and autodephosphorylation that were inversely correlated, suggesting that Dⴙ2/Tⴙ2 residues interact with aspects of the ground or transition states that differ between the two reactions.kdephosof
CheY variants altered at Dⴙ2/Tⴙ2 correlated significantly withkdephosof wild-type receiver domains containing the same
Dⴙ2/Tⴙ2 pair. Additionally, particular Dⴙ2/Tⴙ2 pairs were enriched in different response regulator subfamilies, suggest-ing functional significance.
IMPORTANCE
One protein family, defined by a conserved domain, can include hundreds of thousands of known members. Characterizing con-served residues within a concon-served domain can identify functions shared by all family members. However, a general strategy to assess features that differ between members of a family is lacking. Fully exploring the impact of just two variable positions within a conserved domain could require assessment of 400 (i.e., 20ⴛ20) variants. Instead, we created and analyzed a nonre-dundant database of receiver domain sequences. Five percent of Dⴙ2/Tⴙ2 pairs were sufficient to represent 50% of receiver domain sequences. Using protein sequence analysis to prioritize mutant choice made it experimentally feasible to extensively probe the influence of positions Dⴙ2 and Tⴙ2 on receiver domain autodephosphorylation kinetics.
T
wo-component systems (TCSs) are a prevalent means of signal transduction used by plants and microorganisms to mediate responses to stimuli (1). TCSs are present in more than 95% of sequenced bacterial genomes (2,3), and one species can contain tens to more than a hundred TCSs. TCSs regulate a wide range of processes from cell development to virulence. Signal transduction by TCSs occurs through the transfer of phosphoryl groups be-tween histidyl and aspartyl residues of different protein compo-nents (4). Canonically, the sensory component (the sensor kinase) is a phosphodonor to the response regulator (the response-medi-ating component) (4). The conserved domain in the response reg-ulator, the receiver domain, functions as a molecular switch. The phosphorylation status of a conserved Asp on the receiver domain corresponds to turning the output response on and off. Typically, receiver domain phosphorylation initiates the output response, and dephosphorylation terminates the response. Dephosphoryla-tion can occur with the assistance of another protein, such as a phosphatase, or by self-catalysis by the receiver domain, which is termed autodephosphorylation. Reported autodephosphoryla-tion rate constants of receiver domains span almost 6 orders of magnitude (5) (see Fig. S1 in the supplemental material). Thelarge variation in receiver domain autodephosphorylation kinet-ics is striking in light of the strong conservation of structure among receiver domains. There are now almost 300 structures of receiver domains in the RCSB Protein Data Bank (6,7). Receiver
Received17 October 2015Accepted28 June 2016
Accepted manuscript posted online5 July 2016
CitationPage SC, Immormino RM, Miller TH, Bourret RB. 2016. Experimental analysis of functional variation within protein families: receiver domain autodephosphorylation kinetics. J Bacteriol 198:2483–2493.
doi:10.1128/JB.00853-15.
Editor:A. M. Stock, Rutgers University-Robert Wood Johnson Medical School Address correspondence to Stephani C. Page, [email protected].
*Present address: Stephani C. Page, Department of Pharmacology, University of North Carolina, Chapel Hill, North Carolina, USA; Robert M. Immormino, Center for Environmental Medicine, Asthma, and Lung Biology, University of North Carolina, Chapel Hill, North Carolina, USA.
Supplemental material for this article may be found athttp://dx.doi.org/10.1128 /JB.00853-15.
domains have a conserved Rossmanoid fold structure, with a -sheet made up of five-strands, surrounded by five␣-helices (8). Five conserved residues and a divalent metal ion are arranged in a conserved geometry and comprise the active site that catalyzes both the phosphorylation and dephosphorylation of the con-served Asp (8). Despite the conserved fold and active-site geome-try, on average any two receiver domains will have only about 25% amino acid sequence identity (9), suggesting that there is a fair amount of variability from one receiver domain to the next. Vari-able residues located within or close to the receiver domain active site could potentially be positioned to exert influence on the ca-talysis of autodephosphorylation. Residues at D⫹2 (located two amino acids C terminal to the site of phosphorylation on the 3-␣3 loop) and T⫹2 (located two amino acids C terminal to the conserved Thr/Ser on the4-␣4 loop) are located such that their side chains may potentially interact with conserved active-site res-idues, the phosphoryl group, and/or the attacking water nucleo-phile. Furthermore, mutual information analysis suggests a high degree of coevolution between the amino acids at positions D⫹2 and T⫹2, implying functional importance. In previous studies using a limited set ofEscherichia coliCheY andBacillus subtilis Spo0F mutants based on the wild-type sequences of fewer than 10 receiver domains, we found that the particular amino acids at positions D⫹2 and T⫹2 altered the autodephosphorylation rate constant by almost 2 orders of magnitude (10,11). Due to the small data set, the full extent to which residues at D⫹2 and T⫹2 can influence receiver domain autodephosphorylation is unknown. Further, the mechanisms by which positions D⫹2 and T⫹2 influence autodephosphorylation remain unclear.
In this study, we extended investigation of the D⫹ 2 and T⫹2 residues and their influence on receiver domain autophos-phorylation by significantly expanding our data set to be much more representative of response regulators. Pursuing a larger and more relevant data set would potentially mean that conclusions could be applied more broadly to receiver domains. Protein se-quence analysis revealed that 20 (out of 400 possible) D⫹2/ T⫹2 pairs account for 50% of receiver domain sequences found in a nonredundant database of naturally occurring response reg-ulators; in essence, only 5% of possible amino acid pairs represent the majority of receiver domains. This circumstance made expan-sion of the data set experimentally feasible. We also expanded our experimental analysis to include another receiver domain, PhoBN, representative of a large family of response regulators. Combined with previous studies, the 44 D⫹2/T⫹2 pairs tested in CheY represent 54% of receiver domain sequences. Analysis of the ex-panded mutant collection showed that residues at D ⫹2 and T⫹2 modulated autodephosphorylation rate constants (kdephos) over 2 orders of magnitude, indicating that additional factors are required to account for the much larger range ofkdephosvalues reported for wild-type response regulators. Nevertheless,kdephos of CheY mutants were correlated (R2⫽0.62) withk
dephosof wild-type response regulators bearing the same amino acids at D⫹2/ T⫹2. Furthermore, for the 11 cases tested, a particular pair of amino acids at D⫹2 and T⫹2 generally had similar effects on autodephosphorylation in CheY and PhoB or Spo0F. Negatively charged amino acids (and, to a lesser extent, amide residues) at D⫹2 or T ⫹2 enhanced autodephosphorylation in all three receiver domains tested, but positively charged amino acids did not have a consistent effect on hydrolysis. The previously mea-sured rate constants for autophosphorylation with
phosphorami-date or monophosphoimidazole by CheY variants that differ at D⫹2 and T⫹2 (12,13) are inversely correlated with autode-phosphorylation rate constants of the same variants, suggesting that the amino acids at D⫹2 and T⫹2 interact with aspects of the ground or transition states that differ between the two reactions.
Finally, analysis of receiver domains from different response regulator subfamilies revealed dramatically different distributions of D⫹2/T⫹2 pairs between receiver domain subclasses. Typi-cally, a few pairs composed of chemically similar amino acids and exerting similar effects on the autodephosphorylation rate con-stant dominated the D⫹2/T⫹2 pairs in each response regulator subfamily. The biased distribution strengthens the notion that amino acids at positions D⫹ 2 and T⫹2 are important for response regulator function.
MATERIALS AND METHODS
Mutagenesis and protein purification.Plasmids encoding His6-tagged
CheY variants were made using QuikChange (Agilent) with plasmid pKC1 (14) as the template. CheA was purified as described previously (11). Each CheY variant was purified as described previously (5), and removal of the His6tag by thrombin cleavage left three additional residues
(GSH) on the N terminus. The additional GSH does not affect CheY autodephosphorylation kinetics (5). Plasmids encoding His6-tagged
PhoB1-127variants used pET28a-phoBN(14), which encodes a
thrombin-cleavable His6-tagged PhoB1-127, as a template. Thrombin cleavage leaves
the N-terminal GSH. PhoB variants were purified as described for CheY. His6-tagged PhoR193-431was expressed and purified as described
previ-ously (14). All protein variants were gel filtered using a Superdex 75 1660 size exclusion column (GE Biosciences).
We apply a nomenclature for discussion of CheY and PhoBNmutants
in which the first letter is the D⫹2 residue and the second letter is the T⫹ 2 residue. One D⫹2/T⫹2 pair in the top 20 was not assessed. EL (D⫹ 2 is E; T⫹2 is L), twelfth in abundance, was made in CheY, but attempts at protein purification were unsuccessful. Only six of pairs 21 to 34 were tested. The GY, KF, KH, RS, EY, HD, TY, and HS pairs (pairs 21 to 23, 28 to 31, and 33, respectively) were not made because they were not among the most prevalent pairs in our initial database analysis. Notably, analysis of Spo0F in reference11included three high-frequency pairs (EL, KH, and EY) missing from the CheY mutant set.
Autodephosphorylation rate constant measurement using32P.
Au-todephosphorylation rate constants for CheY variants were measured by following the loss of32P as described previously (5). CheY variants (8M)
were incubated with 0.5M purified [32P]CheA-P (15) in 100 mM Tris at
pH 7.5 and 10 mM MgCl2. Because some substitutions resulted in
dimin-ished rates of phosphotransfer from [32P]CheA-P to CheY, incubations
times were varied for different CheY mutants in order to ensure that at least 95% of the32P was transferred by the first time point. At each time
point, 6l of the reaction mixture was removed and mixed with an equal volume of 2⫻SDS sample buffer to quench the reaction. Components of samples taken at each time point were separated using SDS-PAGE. Loss of32P from [32P]CheY-P was detected using phosphorimaging
analysis of the dried gel. The signals were quantified using pixel vol-ume analysis in which the background signal was manually subtracted. The amounts of [32P]CheY-P were plotted versus time and fit to
one-phase exponential decays yielding thekdephos. Each time course was
designed to follow loss of32P over at least 4 or 5 half-lives (⬃3 to 6% 32P remaining on [32P]CheY-P). All measurements were repeated three
times.
To determine the autodephosphorylation rate constants of PhoBN
variants, 4M His6-tagged PhoR was incubated with 0.3 mM [␥-32P]ATP
in 3.5 mM MgCl2, 35 mM KCl, and 35 mM Tris (pH 8.0) for 30 min at
room temperature to generate [32P]PhoR-P. The reaction mixture
con-taining [32P]PhoR-P was pipetted onto a 0.22-m polyvinylidene
a nickel-nitrilotriacetic acid (Ni-NTA)–agarose (Qiagen) slurry that was equilibrated in 35 mM Tris (pH 8.0), 3.5 mM MgCl2, and 35 mM KCl buffer. After centrifugation, the column was washed multiple times with equilibration buffer to remove ATP. PhoBN(90M in 60l of
equilibra-tion buffer) was added directly to the slurry, mixed, and then incubated at room temperature for 5 min on the column to allow for sufficient phos-photransfer from [32P]PhoR-P to PhoBN. The column was centrifuged to
elute [32P]PhoB
N-P. Time courses were completed and phosphorimaging
was analyzed as described above for CheY.
Mutual information analysis.To examine coevolution of residues within receiver domains, in October 2015 we performed mutual informa-tion analysis of the Pfam Response_reg RP15 database (16) using the MISTIC server (http://mistic.leloir.org.ar/index.php) (17).
Receiver domain sequence analysis.To analyze the frequency of amino acids that naturally occur at various positions within receiver do-mains, we created a searchable database of nonredundant receiver domain amino acid sequences using a combination of publicly available web-based utilities and databases along with custom Perl (v5.16) scripts. The choice of D⫹2/T⫹2 combinations for experimental work was guided by preliminary analyses made several years ago (data not shown). The up-to-date analysis used to generate amino acid frequencies given in this report is described below.
The sequences of 250,546 proteins containing receiver domains, iden-tified using the Agfam signaling domain library of the Microbial Signal Transduction (MiST2.2) database (18), were provided by the curators on 11 February 2015 (see Database S2 athttp://www.unc.edu/⬃bourret/Page SupplementalDatabaseFiles.htm). To reduce bias and redundancy from multiple closely related genomes, one genome (the first encountered in the list) was chosen for each genus and proteins from all other genomes in the same genus were discarded. This process left 39,132 sequences. Ran-dom reordering of the original list of sequences using a Fisher-Yates shuf-fle resulted in different genome sequences being in the final database but did not significantly change reported results.
To facilitate sequence alignment, protein sequences were trimmed to retain only the receiver domain(s). First, a unique AseqID (19) was as-signed to each protein sequence database entry. The AseqIDs were then used to query the Agfam annotation in SeqDepot (19) to retrieve the location of the first and last residues of each receiver domain. Amino acids outside the receiver domain(s) were discarded. Because some proteins contain more than one receiver domain, the number of database entries increased to 41,370. USEARCH v5.1.221 (20) was used to group the re-ceiver domain sequences into clumps of 1,000 (a manageable size for alignment) based on sequence similarity. The sequences in each clump were then aligned using MUSCLE v3.8.31 (21). To further reduce the redundancy of the database, sequences within each clump were compared in a pairwise manner. Sequences withⱖ90% identity to the amino acids (gap positions were not tested) of a query sequence were discarded. This step removed 2,989 sequences (7.2% of the total) and did not significantly affect the amino acid frequencies at positions D⫹2 and T⫹2 in the final database. Because the clumps were created based on sequence similarity and response regulators are on average only⬃25% identical (9), the screen against high sequence identity was not applied between clumps.
The positions of the five conserved active-site residues that are critical for receiver domain function (8) were then located. Each clump of aligned sequences was searched to identify the positions that had the highest num-ber of matches to “DD” (two adjacent Asp and/or Glu residues), “D” (Asp only), “T” (Ser or Thr), and “K” (Lys only), with the constraint that the identified positions must occur in the listed order from N to C terminal. The 6,772 sequences that did not initially appear to contain all five served residues were cycled through the clumping, alignment, and con-served residue identification procedures again. On the second filtering attempt, 1,643 sequences met the criterion of containing all five con-served residues. Most of the sequences that passed upon rescreening came from the same few clumps as in the first attempt and appeared to have initially failed due to sequence misalignment. Sequences that
passed the first and second attempts were pooled to yield a collection of 33,252 receiver domain sequences. The 5,129 sequences (13.4%) that failed to pass the second screen for the presence of all five con-served residues were presumed to be pseudo-receiver domains (22) and were not considered further.
Receiver domains share a three-dimensional structure of alternating -strands and␣-helices, with the conserved residues on the loops at the C-terminal ends of-strands 1, 3, 4, and 5 (8). The nine loops connect-ing the five-strands and five␣-helices often differ in length between different receiver domains. Therefore, a header indicating the position of the DD, D, T, and K landmarks was added to each receiver domain sequence and gaps introduced during multiple-sequence alignment were removed. This left a primary receiver domain database (see Da-tabase S3 athttp://www.unc.edu/⬃bourret/PageSupplementalDatabase Files.htm) in which the amino acid at a given position with respect to a landmark (e.g., D⫹2, where⫹signifies in the C-terminal direction and⫺signifies in the N-terminal direction) can be identified for each entry in spite of differences in length. Sequences that match a specified search criterion (e.g., Met at position D⫹2) can also be retrieved.
Finally, response regulators can be categorized based on their output domains (23). Therefore, the primary receiver domain database was sub-divided into secondary databases representing the major classes of re-sponse regulators. The AseqID was used to query Seqdepot for the Pfam (16) domain annotation associated with each protein in the primary da-tabase. The presence of specific domains led to assignment to subfamilies as follows: PF00486 (Trans_reg_C) domain, OmpR subfamily; PF00196 (GerE) domain, NarL/FixJ subfamily; both PF00158 (Sigma54_activat) and PF02954 (HTH_8) domains, NtrC subfamily; PF04397 (LytTr) do-main, LytR subfamily; and PF02518 (HATPase_c) dodo-main, hybrid kinase subfamily. Proteins that had exactly one receiver domain in Agfam anno-tation and no domains other than PF00072 (Response_reg) in Pfam were assigned to the single receiver domain subfamily. A total of 188 proteins (⬃0.6%) were assigned to more than one family; 6,697 proteins were not assigned. The sorting process resulted in seven secondary databases (the six families listed above plus the proteins without assignment) that can be individually searched (see Databases S4 to S10 athttp://www.unc.edu /⬃bourret/PageSupplementalDatabaseFiles.htm).
RESULTS
Twenty Dⴙ2/Tⴙ2 pairs account for half of receiver domain sequences.Previous analysis of the influence of D⫹2 and T⫹2 residue pairs on receiver domain autodephosphorylation (11) was limited to pairs that mimicked fewer than 10 receiver domains. Protein sequence analysis was employed to guide experimental design for assessing the impact of D⫹ 2/T⫹2 residues in a manner that represented receiver domains more broadly and that was experimentally feasible. After accessing receiver domain se-quences from the MiST2 database (18), a nonredundant database of 33,252 receiver domain sequences was created by reducing se-quences to one genome per genus and then removing sese-quences withⱖ90% sequence identity (see Database S3 athttp://www.unc .edu/⬃bourret/PageSupplementalDatabaseFiles.htm). Out of 400 possible amino acid combinations at D⫹2 and T⫹2, 364 pairs were present (Fig. 1). Twenty D⫹2/T⫹2 pairs (only 5% of the possible combinations) accounted for 50% of natural receiver do-main sequences. The pair frequencies are displayed inFig. 1such that the bubble area reflects the total number of sequences in our database that contain a specific D⫹2/T⫹2 pair (see Table S11 in the supplemental material). Some pairs, such as MK (the first letter is the D⫹2 residue and the second letter is the T⫹2 residue) and MR, were quite abundant, each accounting for more than 5% of sequences analyzed. CheY mutants were made with the goal of completing a set of the most common D⫹2/T⫹2 pairs. In the end, the collection included 19 of the top 20 and 25 of the 34 most frequent D⫹2/T⫹2 pairs (the wild-type CheY pair NE was pair 13). Numerous single mutants representing less abundant D⫹2/T⫹2 pairs were also made and tested en route to making desired D⫹2/T⫹2 pairs in CheY.
Substitutions at Dⴙ2 and Tⴙ2 in CheY modulated autode-phosphorylation rate constants over 2 orders of magnitude. Au-todephosphorylation rate constants were measured for 26 CheY variants. With consolidated CheY data from references10,11, and 13, the expanded data set (Table 1) contained 12 D⫹2 single mutants, 10 T⫹2 single mutants, and 21 double mutants in CheY
that, together (including the NE pair found in wild-type CheY), represent 54% of receiver domains. At T⫹2, amino acids L, K, R, H, and Y were assessed in the study described in reference11and expanded to include Q, S, A, N, and F in this study. All T⫹2 single substitutions removed the wild-type Glu in CheY and resulted in diminished autodephosphorylation rate constants (Table 1). Overall, single substitutions at T⫹2 modulated rates constants over a 10-fold range, similar to what was reported in reference11. Rate constants for T⫹2 single mutants appeared to decrease as residue size and hydrophobicity increased; aromatics (H, Y, and F) made up the slowest T⫹2 single mutants.
In contrast, single substitutions at D⫹2 (changing the Asn) resulted in both enhanced and diminished rate constants. D, M, E, K, and L were assessed at D⫹2 in the study described in reference 11, which was extended to include S, Q, V, A, R, G, and W in this study. Overall, single substitutions at D⫹2 resulted in an⬃ 30-fold range in rate constants. Almost all (11/12) D⫹2 single mu-tants resulted in rate consmu-tants that were within 3-fold that of wild-type CheY. One D⫹2 single mutant (Trp), which slowed the reaction 11-fold, was responsible for the added order of magni-tude in the range of CheY D⫹2 single mutants.
Double mutants DL, EH, MR, MK, and KY were analyzed in the study described in reference11, RH and ML were analyzed in the study described in reference10, and QS was analyzed in the study described in reference13. This study expanded analysis of CheY double mutants to include ER, QN, SH, QH, GR, AA, QF, QY, VK, WH, RF, RY, and VY. An⬃30-fold range in autodephos-phorylation rate constants was observed for the consolidated CheY double mutants with simultaneous substitutions at D⫹2 and T⫹2. All of the CheY D⫹2/T⫹2 double mutants exhibited diminished autodephosphorylation rate constants compared to that of the wild type. Altogether, single and double substitutions at D⫹2 and T⫹2 in CheY resulted in a range in autodephosphor ylation rate constants that spans 2 orders of magnitude.
The previously studied data set included 16 CheY variants (ac-counting for 23% of receiver domain sequences) and resulted in an⬃90-fold range in autodephosphorylation rate constants (11). Given the small sample size, it was unknown whether the previ-ously observed range ofkdephosvalues represented an upper bound or a lower bound for the effect of D⫹2 and T⫹2 residues on autodephosphorylation. Increasing the data set to 44 CheY vari-ants (54% of receiver domain sequences) expanded the range of CheY autodephosphorylation rate constants only⬃30% to 120-fold. The expanded data set is more representative of naturally occurring D⫹2/T⫹2 pairs than the original and includes D ⫹ 2/T⫹ 2 pairs found in wild-type response regulators exhibiting a range in autodephosphorylation rate constants of 4 orders of magnitude. Therefore, we can reasonably expect to attribute only about 2 orders of magnitude of the range in wild-type response regulator autodephosphorylation rate con-stants to the particular amino acids at positions D⫹2 and T⫹2 and conclude that additional factors must contribute substantially to variation in the rate of autodephosphorylation between receiver domains.
Substitution mimicking CheY at Tⴙ2 in PhoBNenhanced
autodephosphorylation.E. coliPhoBN, a receiver domain with a relatively low autodephosphorylation rate constant (14), was used to analyze substitutions that could potentially enhance autode-phosphorylation. This expands a previous approach using theB. subtilisSpo0F response regulator (11). PhoB was chosen for mul-FIG 1Bubble plot showing distribution of D⫹2/T⫹2 pairs found in a
tiple reasons. While CheY and Spo0F are single-domain response regulators, PhoB has an output domain and is representative of the large OmpR class of response regulators. Although the pres-ence or abspres-ence of the output domain has little effect on PhoB autodephosphorylation (14), receiver and output domains within
response regulators have coevolved (24,25), and D⫹2/T⫹2 residues conceivably could have different effects in PhoBNthan in a single-domain response regulator. Another contrast with CheY and Spo0F is that PhoBNforms dimers (26). To the best of our knowledge, PhoBN is the only response regulator for which autodephosphorylation rate constants have been mea-sured in different multimeric states. The autodephosphoryla-tion rate constants for monomeric PhoBN-P, the PhoBN· PhoBN-P heterodimer, and the PhoBN-P·PhoBN-P homodimer are indistinguishable (14), removing a potential complication from interpretation of data.
Single and double substitutions at D⫹2 and T⫹2 were made in PhoBN(changing Met and Arg at D⫹2 and T⫹2, respectively) that mimic CheY (Table 2). Mutants with Glu substitutions at T⫹2 resulted in the largest increases compared to the wild-type PhoBN autodephosphorylation rate constant (PhoBN NE and PhoBNME autodephosphorylated 18- and 45-fold faster, respec-tively, than wild-type PhoBN).
The PhoBNmimics of CheY were compared to single and dou-ble Ala mutants of PhoBN. Steric occlusion, i.e., hindrance of the in-line attack of nucleophilic water by large residues, was previ-ously hypothesized as one mechanism by which D⫹2 and T⫹2 residues might influence receiver domain autodephosphorylation (10). Based on this hypothesis, removal of the large Arg and/or Met residues by substitution with Ala should result in enhanced autodephosphorylation. The autodephosphorylation rate con-stant of PhoBNAR was unchanged from that of wild-type PhoBN, whereas rate constants for PhoBNMA and PhoBNAA were both 2-fold faster than that of wild-type PhoBN. The relatively small effects of single and double Ala substitutions in PhoBNsuggest that steric obstruction is not the key mechanism of influence by D⫹2/T⫹2 residues. Because introducing a Glu at T⫹2 had a much larger effect than an Ala, it is clear that the key influence in the enhanced autodephosphorylation rate constant of PhoBNME was from adding a beneficial feature of Glu, as opposed to remov-ing a detrimental feature of Arg.
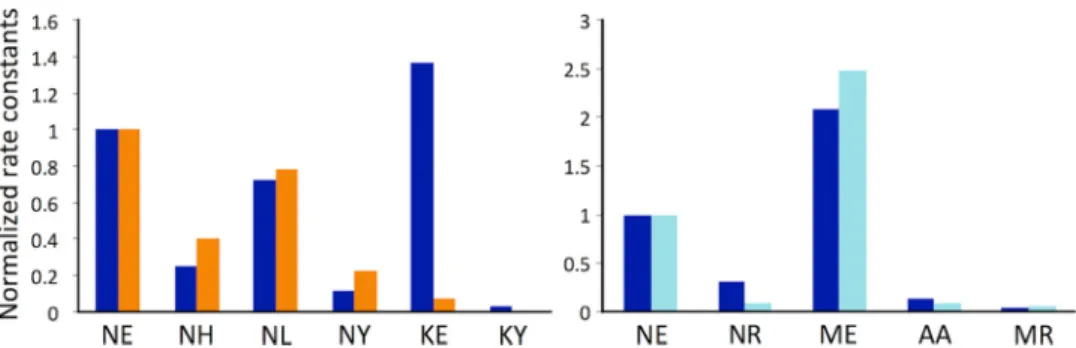
Autodephosphorylation rate constants appear to be influ-enced by negative charge at positions Dⴙ2 and/or Tⴙ2 but not by positive charge.The magnitudes of effects between the same D⫹ 2/T⫹2 pairs in CheY and PhoBNwere similar (Fig. 2). Generally, similar effects of D⫹2/T⫹2 pairs were also previously observed between CheY and Spo0F (11) (Fig. 2). The observation that the effects were similar regardless of backbone suggests that there may be some generality to the effect of a particular D⫹2/ TABLE 1CheY autodephosphorylation rate constants
CheY variant(s)
Amino acid at:
kdephos (min⫺1)a
Fold change from wild type D⫹2 T⫹2
Wild type N E 2.2⫾0.2 NAe
T⫹2 single mutants N Q 2.1⫾0.07 ⫺1.0
N L 1.6⫾0.1b ⫺1.4
N S 1.2⫾0.04 ⫺1.8
N A 1.2⫾0.1 ⫺1.8
N K 1.2⫾0.3b ⫺1.8
N N 0.88⫾0.04 ⫺2.5
N R 0.69⫾0.04b ⫺3.2 N H 0.55⫾0.04b ⫺4.1 N Y 0.26⫾0.01b ⫺8.5
N F 0.20⫾0.04 ⫺11
D⫹2 single mutants D E 5.5⫾0.4b ⫹2.5
M E 4.6⫾0.4b ⫹2.1
E E 4.5⫾0.2b ⫹2.0
S E 3.3⫾0.2 ⫹1.5
Q E 3.2⫾0.4 ⫹1.4
K E 3.0⫾0.1b ⫹1.4
V E 2.2⫾0.2 ⫺1.0
A E 1.8⫾0.2 ⫺1.2
R E 1.6⫾0.04 ⫺1.4
L E 1.3⫾0.1b ⫺1.7
G E 1.0⫾0.1 ⫺2.2
W E 0.20⫾0.02 ⫺11
Double mutants E R 1.3⫾0.1 ⫺1.7
Q S 1.1⫾0.2c ⫺2.0
Q N 0.91⫾0.04 ⫺2.4
D L 0.57⫾0.08b ⫺3.9 E H 0.50⫾0.03b ⫺4.4
S H 0.39⫾0.05 ⫺5.6
Q H 0.30⫾0.03 ⫺7.2
G R 0.30⫾0.04 ⫺7.2
A A 0.30⫾0.02 ⫺7.3
Q F 0.28⫾0.04 ⫺7.8
Q Y 0.22⫾0.02 ⫺9.9
V K 0.10⫾0.006 ⫺21
W H 0.098⫾0.01 ⫺22
M R 0.094⫾0.012b ⫺23 M K 0.078⫾0.004b ⫺28 K Y 0.062⫾0.006b ⫺35 R H 0.060⫾0.008d ⫺37 M L 0.060⫾0.006d ⫺37
R F 0.056⫾0.003 ⫺39
R Y 0.048⫾0.004 ⫺46
V Y 0.045⫾0.008 ⫺49
a
Values are means⫾standard deviations.
bAutodephosphorylation rate constant from reference11determined by loss of32P.
c
Autodephosphorylation rate constant from reference13determined by fluorescence, which typically gives slightly (⬍2⫻) higher values than measurement by loss of32P (5).
d
Autodephosphorylation rate constant from reference10determined by loss of32
P. The corresponding mutant also contains Glu rather than Phe at position 14 (DD⫹1), which has little (⬍2⫻) effect onkdephos(11).
eNA, not applicable.
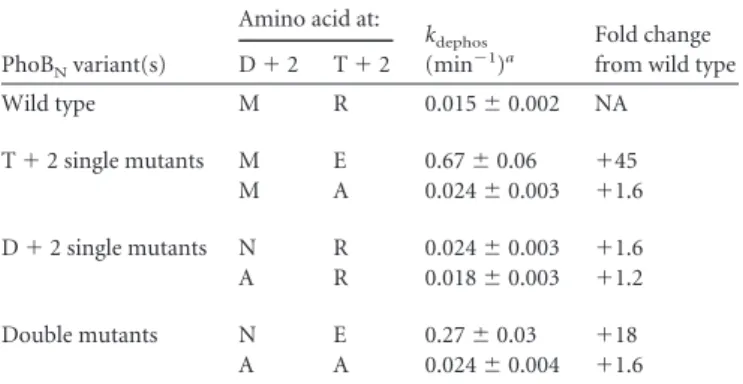
TABLE 2PhoBNautodephosphorylation rate constants
PhoBNvariant(s)
Amino acid at:
kdephos (min⫺1)a
Fold change from wild type D⫹2 T⫹2
Wild type M R 0.015⫾0.002 NA
T⫹2 single mutants M E 0.67⫾0.06 ⫹45 M A 0.024⫾0.003 ⫹1.6
D⫹2 single mutants N R 0.024⫾0.003 ⫹1.6 A R 0.018⫾0.003 ⫹1.2
Double mutants N E 0.27⫾0.03 ⫹18
A A 0.024⫾0.004 ⫹1.6
a
T⫹2 pair. Kinetic data were analyzed to probe for mechanistic insight that could be applied to all three receiver domain back-bones. Data were analyzed to determine whether kinetic effects correlated with features of the amino acids (such as size, solvent accessibility, and hydrophobic surface area) present at D⫹2 and T⫹2. Though relationships were not observed for other features, a plot of autodephosphorylation rates constants against net charge at D⫹2 and T⫹2 revealed that more negatively charged active sites weakly correlated with higher autodephosphorylation rate constants (best fitR2⫽0.44) (Fig. 3). Deeper inspection provides additional evidence that negative charge had a role in modulating autodephosphorylation. There are 13 CheY variants with Glu at T⫹2 (Table 1). Because the D⫹2 residue was varied experimen-tally, for purposes of discussion, this class of variants is designated XE. Of the XE variants, 12 have one or more related double mu-tants in which the Glu is replaced with another amino acid, des-ignated XZ. In all 31 of the CheY XE-versus-XZ comparisons, the autodephosphorylation rate constant is higher for the XE variant (Fig. 4A). Because Glu is the wild-type residue at T⫹2 in CheY, the result could be explained as loss of wild-type function.
How-ever, in both PhoBN(3/3) and Spo0F (6/6) (Fig. 4A), in which Glu is not the wild-type residue at T⫹2, all of the XE mutants tested resulted in a gain of function compared to the corresponding XZ mutants.
Acidic residues at D⫹2 similarly correlated with higher au-todephosphorylation rate constants. The CheY variants with an acidic residue at D⫹2 are designated EX, where E represents either Asp or Glu. There are 34 comparisons between EX pairs in CheY and variants that have the D⫹2 residue replaced, desig-nated ZX (Fig. 4B). In 30/34 comparisons, the EX variant exhib-ited a higherkdephosthan the ZX variant. Two of the four excep-tions have a negatively charged Glu at the “X” (T⫹2) position and the other two exceptions have the wild-type amide (Asn) at D⫹2. In Spo0F, acidic substitutions at D⫹ 2 also resulted in faster autodephosphorylation (11). There are two Spo0F EX variants that can be compared to ZX variants with the same T⫹2 residue. In all four Spo0F comparisons, the EX variants autodephosphor ylated faster than the corresponding ZX variants (Fig. 4B). There were no PhoBNmutants in this study that contain an acidic resi-due at D⫹2.
FIG 2Normalized autodephosphorylation rate constants for the same D⫹2/T⫹2 pairs in different receiver domains. Rate constants for variants containing a specific D⫹2/T⫹2 pair are normalized using the NE variant for each receiver domain. Variants are identified by single letter amino acid abbreviations, where the first letter is the D⫹2 residue and the second letter is the T⫹2 residue. Dark blue represents CheY variants (wild-type NE). Orange represents Spo0F variants (wild-type KY). Cyan represents PhoBNvariants (wild-type MR).yaxis scales are different between each data set.
FIG 3Correlation between net charge at positions D⫹2 and T⫹2 and CheY autodephosphorylation rate constants. His was considered neutral for calcu-lations of net charge. Best fitR2⫽0.44.
If negatively charged amino acids at positions D⫹2 or T⫹2 enhance autodephosphorylation, then positively charged amino acids might be expected to diminish autodephosphorylation. This general trend was observed inFig. 3. However, pairwise compar-isons of CheY variants with or without positively charged residues analogous to that shown inFig. 4did not yield similar outcomes. When looking among groupings of CheY variants that included some with a positively charged residue (Arg or Lys) at D⫹2 or T⫹2, we did not discern a consistent relationship between kinetic data and removal or addition of a positive charge. In 36 of 56 comparisons (data not shown), the CheY variant containing Arg or Lys exhibited a lower value forkdephosthan corresponding vari-ants without Arg or Lys. Further, because His has a pKawithin a reasonable pH range for autodephosphorylation experiments, we were able to directly assess pH dependence of CheY variants with a His at T⫹2. Changing the pH will alter the charge of a His between neutral and positive. Autodephosphorylation rate con-stants of the CheY QH, RH, and WH variants were not affected by pH (data not shown), suggesting that positive charge at T⫹2 may not influence CheY autodephosphorylation. In contrast to CheY, tested PhoBNand Spo0F variants containing Arg or Lys always supported slower autodephosphorylation than corresponding proteins without the positively charged residues, but the available data set is much smaller (only four comparisons for PhoBNand five for Spo0F). Arg, His, and Lys contain large hydrophobic sur-face areas, so hydrophobic sursur-face area or size, rather than positive charge, may be the means by which these residues influence au-todephosphorylation.
Dⴙ2/Tⴙ2 substitutions inversely affect CheY autodephorylation with water and autophosautodephorylation with phos-phoramidate or monophosphoimidazole.In addition to autode-phosphorylation, receiver domains self-catalyze phosphorylation with small-molecule phosphodonors, such as phosphoramidate (PAM), monophosphoimidazole (MPI), or acetyl phosphate (AcP). Analysis in CheY showed that the amino acids at D⫹2 and T⫹2 influence autophosphorylation with small-molecule phos-phodonors (12). Of the CheY variants for which autodephospho-rylation rate constants are available (Table 1), there were 20 CheY variants for which PAM and AcP autophosphorylation rate con-stants (kphos/Ks) were both known and 7 for which MPI autophos-phorylation rate constants were available (12,13). For the CheY variants, there were significant correlations betweenkdephosand kphos/Kswith PAM (R2⫽0.51) or MPI (R2⫽0.87) but not with AcP (R2⫽0.18). For both PAM and MPI, plottingkdephosversus kphos/Ksrevealed inverse relationships between the rate constants for the two reactions (Fig. 5), as exemplified by the negative slopes of the best fit lines on log-log plots of the data (Fig. 5, insets).
The plots ofkdephosversuskphos/KSshowed informative corre-lations between the amino acids found at T ⫹2 and the rate constants for each reaction. Pairs containing residues with large hydrophobic surface areas typically had higher PAM/MPI auto-phosphorylation rate constants (12) and lower autodephosphory-lation rate constants (Fig. 5). Pairs containing acid or amide resi-dues at T⫹2 were typically faster for autodephosphorylation and slower for PAM/MPI autophosphorylation, with acid residues having the greatest impact.
Certain Dⴙ2/Tⴙ2 pairs are enriched in receiver domains from different classes of response regulators.Because response regulator subfamilies with different output domains have dif-ferent functions, we wanted to determine whether particular
D⫹2/T⫹2 pairs were associated with specific response reg-ulator subfamilies and, potentially, with specific response regula-tor functions. The primary nonredundant database of receiver do-main sequences (see Database S3 athttp://www.unc.edu/⬃bourret /PageSupplementalDatabaseFiles.htm) was divided into seven secondary databases (see Databases S4 to S10 athttp://www.unc .edu/⬃bourret/PageSupplementalDatabaseFiles.htm) based on association with major classes of response regulators as described in Materials and Methods. Subfamilies represented the following fractions of the nonredundant database: hybrid kinases, 24%; OmpR, 20%; single receiver domains, 18%; NarL/FixJ, 12%; NtrC, 6%; and LytR, 4%. Sixteen percent of sequences were not assigned to a response regulator subfamily in our analysis. The smaller databases revealed that the distributions of D⫹2/T⫹2 pairs were strikingly different between response regulator sub-families, as well as between response regulator subfamilies and response regulators taken as a whole (Table 3). The functional consequences of this circumstance are considered in Discussion. FIG 5Inverse relationship betweenkdephosandkphos/KSof CheY D⫹2/T⫹2 variants. Wild-type CheY is indicated in red. (A) Autophosphorylation with PAM. (B) Autophosphorylation with MPI. Note the difference inyaxis scales for panels A and B.kphos/KSvalues are from references12and13.kdephosvalues are fromTable 1. Insets show the same data replotted in log-log form. The best-fit lines through the data have the equationskphos/KS⫽31(kdephos)⫺0.71 (R2⫽0.51) for PAM andk
phos/KS⫽170(kdephos)⫺
DISCUSSION
Acids and amides at positions Dⴙ2 and/or Tⴙ2 enhance au-todephosphorylation.The weak correlation between net charge of the amino acids at D⫹2/T⫹2 and the autodephosphorylation rate constant of CheY variants (Fig. 3) resolved upon closer in-spection into a consistent correlation between negative charge and enhancedkdephosin three different receiver domains (Fig. 4) but no correlation between positive charge and diminishedkdephos. This discrepancy suggests that charge is not the fundamental basis for the underlying mechanism by which amino acids at D⫹2/ T⫹2 enhance autodephosphorylation. It may be relevant that negatively charged amino acids are hydrogen bond acceptors, whereas positively charged amino acids are hydrogen bond do-nors. This suggests that negatively charged side chains at D⫹2/ T⫹2 might enhance the reaction by interacting with the attacking water molecule. Because amide residues can act as hydrogen bond acceptors, this hypothesis predicts that amides should also en-hance autodephosphorylation. Our mutant collection contains few examples with an amide residue at T⫹2, but we have mea-suredkdephosfor many CheY variants with an amide at D⫹2 (Table 1) and can analyze the data as was done inFig. 4for acid residues. In 33 pairwise comparisons between CheY NX and ZX variants (matched at T⫹2 and differing at D⫹2), there were only three cases in whichkdephosfor the CheY ZX mutant was faster and the “Z” (D⫹ 2) residue was not an acid or amide (data not shown). Similarly, there were only three cases among 25 matched pairs in whichkdephoswas greater for CheY QX than for CheY ZX without an acid or amide residue occupying D⫹ 2 (data not shown). For PhoBN(Table 2), in two of three NX-versus-ZX com-parisons,kdephoswas larger for the amide-containing variant (data not shown). For Spo0F (11), in four of five comparisons, the NX variant exhibited faster autodephosphorylation than the ZX vari-ant, and in the one exception an acid residue at D⫹2 resulted in a greaterkdephosthan with an amide (data not shown). Although the difference inkdephosis small in many pairwise comparisons, a preponderance of evidence indicates that amide residues at posi-tion D⫹2 enhance autodephosphorylation in multiple receiver domains, although not to the same extent as acid residues.
The conclusions that (i) acid and amide residues at D⫹2/ T⫹2 enhance receiver domain autodephosphorylation and (ii)
the mechanism likely involves interaction with the attacking water molecule are supported by a previous study of CheY mimics of haloacid dehalogenase phosphatases (27). The active sites of HAD phosphatases are similar to the active sites of receiver domains and catalyze similar chemistries (28). Although position D⫹2 is vari-able in receiver domains and rarely (2%) occupied by an Asp, HAD phosphatases contain a conserved Asp at D⫹2 that accel-erates phosphorylation and dephosphorylation by acid/base catal-ysis. The amino acid at T⫹2 in HAD phosphatases often helps position the Asp at D⫹2. We previously determinedkdephos val-ues in five CheY variants containing D⫹2/T⫹2 pairs (DR, DK, DQ, DY, and DT) that are rare in receiver domains but common in HAD phosphatases (27). Although the CheY DX variants do not utilize acid/base catalysis, they support faster autodephosphor ylation in all (12/12) possible comparisons with corresponding CheY ZX variants (matched at T⫹2 and differing at D⫹2) reported inTable 1. Furthermore, structural evidence was ob-tained for interactions between an Asp at D⫹2 and an attacking water molecule (27).
Mechanistic insights from relationships betweenkdephosand
kphos/Ksfor CheY Dⴙ2/Tⴙ2 variants.Receiver domains
self-catalyze both phosphorylation with small-molecule phosphodo-nors and dephosphorylation with water. Both reactions are sub-stitution reactions at the phosphoryl atom. The proposed transition states for autodephosphorylation and autophosphory-lation share multiple features, including a partially formed Asp-P bond and a planar PO32⫺group coordinated by conserved active-site residues and a divalent cation (10,12). If residues at D⫹2 and T⫹2 affected aspects of the two reactions that are similar, it would be reasonable to expect a direct correlation between the corresponding rate constants. However, direct correlation of kdephosfor CheY D⫹2/T⫹2 variants was not observed with the rate constants for autophosphorylation with PAM (Fig. 5A), MPI (Fig. 5B), or AcP (data not shown). The lack of a direct correlation suggests that residues at D⫹2 and T⫹2 affected features of autophosphorylation and autodephosphorylation that are not similar. Obvious differences between the reactions include the ground states (CheY-P for autodephosphorylation versus CheY for autophosphorylation) and the regions of the transition states near the attacking water for autodephosphorylation or the phos-TABLE 3Top 10 D⫹2/T⫹2 pairs for response regulator subfamilies
All receivers Hybrid kinase OmpR Single domain NarL/FixJ NtrC LytR Nonassigned
D⫹2/T⫹2a %b D⫹2/T⫹2 % D⫹2/T⫹2 % D⫹2/T⫹2 % D⫹2/T⫹2 % D⫹2/T⫹2 % D⫹2/T⫹2 % D⫹2/T⫹2 %
MK 7.7 QN 8.0 MK 24 NS 10 RF 16 RY 16 QY 19 EL 9.2
MR 6.0 MK 5.4 MR 24 NE 7.8 RY 8.1 RH 13 EY 11 RY 6.5
RY 4.0 QH 4.3 GR 15 MK 4.0 RH 8.0 WH 7.8 NY 8.0 ML 4.6
GR 3.2 VY 4.0 ML 5.9 VK 3.0 SH 6.2 RF 7.0 QF 7.5 MK 3.1
RF 2.9 MR 3.8 NR 5.1 RY 2.5 NH 3.1 KY 6.0 RY 6.8 KY 2.9
ML 2.9 GY 3.6 MM 1.4 KS 2.4 EF 2.8 NY 5.2 HY 4.1 NY 2.8
NS 2.5 ER 3.4 TR 1.2 NY 2.3 NS 2.8 KF 4.2 EH 2.8 KF 2.5
RH 2.5 ML 2.5 SR 1.2 KY 1.7 NY 2.6 KH 3.4 KY 2.3 KH 2.1
QN 2.1 TY 2.2 NL 0.93 SH 1.7 QF 2.5 NW 2.6 QH 2.3 RH 2.0
NY 2.1 IY 1.7 DA 0.78 QF 1.7 HS 2.1 QY 2.1 DH 1.8 NE 1.7
⌺c 36 39 80 37 54 67 66 37
aAmino acids at positions D⫹2 and T⫹2 in the indicated subfamily. Bold font indicates D⫹2/T⫹2 pairs found in the top 10 of all receiver domains in the nonredundant
Database S3 athttp://www.unc.edu/~bourret/PageSupplementalDatabaseFiles.htm. bPercentage of subfamily members containing the indicated D⫹2/T⫹2 pair.
c
phodonor for autophosphorylation. Notably, the residues at D⫹2/T⫹2 are within appropriate distance to affect the regions around the water or phosphodonor. A previous study concluded on different grounds that the amino acids at D⫹2/T⫹2 affect CheY autophosphorylation kinetics by interacting with the leav-ing group (12).
Instead of a direct correlation, kdephosof CheY variants differ-ing at D⫹2/T⫹2 varied inversely withkphos/KSfor PAM or MPI (Fig. 5) but not AcP. This distinction is consistent with a previous report that the kinetic determinants for autophosphorylation of CheY with phosphoramidates (PAM and MPI) or acyl phosphates (AcP) are different (12). In particular, autophosphorylation with PAM is more strongly influenced by the hydrophobic surface area of the amino acids at D⫹2 and T⫹2, whereas autophosphory-lation with AcP is more strongly affected by the charge of the D⫹2/T⫹2 residues. The inverse relationship betweenkdephos andkphos/KSfor PAM/MPI displayed inFig. 5may arise because the two reactions are primarily influenced by mutually exclusive properties of the amino acids at D⫹2/T⫹2. Specifically, hydro-gen bond accepting ability appears to promote autodephosphory-lation (presumably by interacting with water as discussed above), whereas a hydrophobic surface area appears to stimulate auto-phosphorylation through direct interaction with the imidazole ring or related portions of the phosphodonor (12, 13). Thus, D⫹2/T⫹2 variants of CheY that are adept at catalyzing both autophosphorylation with PAM/MPI and autodephosphoryla-tion with water were not observed.
Autodephosphorylation rate constants of CheY variants and wild-type response regulators with the same Dⴙ2/Tⴙ2 pair are correlated.In many instances, autodephosphorylation rate constants for CheY, PhoBN, and Spo0F variants appeared to be consistent with the effects of substitutions at D⫹2 and T⫹2 anticipated from rate constants for wild-type response regulators containing the same D⫹2/T⫹2 pairs. For example, wild-type PrrA is at the slower end of the range of autodephosphorylation rate constants for wild-type response regulators and contains RY at D⫹2/T⫹2. In CheY, the RY variant is one of the slowest of the CheY variants (Table 1). There was a direct correlation (R2⫽ 0.62) betweenkdephosfor wild-type response regulators (range, 4 orders of magnitude) andkdephosfor CheY variants with the same D⫹2/T⫹2 pair (range, 2 orders of magnitude) when plotted in log-log form (Fig. 6). The correlation betweenkdephosfor wild-type response regulators and corresponding CheY variants gener-ally holds even though the effects of changing amino acids at D⫹2 and T⫹2 in CheY are sufficient to account for⬍1% of the range in autodephosphorylation rate constants observed among wild-type response regulators. The correlation may indicate that other factors affectingkdephosoften evolved to reinforce the direc-tion set by the amino acids at D⫹2 and T⫹2.
Dⴙ2/Tⴙ2 amino acid pairs enriched in response regulator subfamilies correlate with functionally relevant autodephos-phorylation kinetics. The enrichment of particular pairs of amino acids at positions D⫹2 and T⫹2 in various response regulator subfamilies (Table 3) is substantial. For example, whereas the MK and MR D⫹2/T⫹2 pairs are found in 14% of receiver domain sequences overall, they are present in 49% of receiver domain sequences in the OmpR subfamily (Table 3). Fur-thermore, 72% of all sequences containing MK or MR pairs be-long to the OmpR subfamily. OmpR subfamily receiver domains
typically function to regulate transcription, a relatively slow pro-cess, and receiver domains containing MK or MR at D⫹2/T⫹2 have autodephosphorylation rate constants at the low end of the range of wild-type response regulators. Changing D⫹2/T⫹2 in CheY to MK or MR made CheY autodephosphorylation rate con-stants at least an order of magnitude lower than for the wild type (Table 1). Similarly, replacing the natural MR pair in PhoBNwith the NE pair found in CheY increased autodephosphorylation by more than an order of magnitude.
domain in hybrid kinases often functions as a phosphate sink to drain phosphoryl groups out of the system through autode-phosphorylation (30–33).
The enrichment of specific D⫹2/T⫹2 pairs with particular effects on autodephosphorylation kinetics in different response regulator subfamilies strengthens the correlation between which D⫹2/T⫹2 pairs are present in a receiver domain and the bio-logical function of that particular receiver domain. This correla-tion is further reinforced by the observacorrela-tions that (i) D⫹2/T⫹2 pairs with chemically similar amino acids (e.g., a basic residue at D⫹2 paired with a hydrophobic residue at T⫹2) often cluster together in response regulator subfamilies (Table 3) and (ii) D⫹2/T⫹2 pairs with chemically similar amino acids have very similar (within 2-fold) effects on CheY autodephosphorylation kinetics (Table 1).
The frequency of Dⴙ2/Tⴙ2 pairs in receiver domains from a particular microorganism likely reflects the distribution of re-sponse regulator subfamilies in that organism rather than phy-logeny.A central part of the research strategy described here is to identify the combinations of amino acids at variable positions D⫹2 and T⫹2 most commonly found in naturally occurring receiver domains and then use this information to prioritize sub-jects of experimental investigation. However, phylogenetic groups are not uniformly represented in sequence databases, which as a result are inevitably biased by what has been sequenced. It would be useful to assess possible sources of database bias and corre-sponding means to mitigate the impact of bias. When construct-ing our receiver domain databases, we attempted to minimize the effects of overrepresentation bias by including information from only one genome per genus and excluding sequences that were more than 90% identical to other sequences. This addressed prob-lems resulting from closely related organisms that have been quenced multiple times but not biases due to the absence of se-quences from other organisms.
The observation that a large majority of occurrences of a given D⫹2/T⫹2 pair were often found in a single response regulator subfamily (Table 3) provides a way to assess the potential impact of underrepresentation bias. Individual species typically encode response regulators from many different subfamilies, and there is variation in the abundance of different response regulator sub-families across phylogenetic groups (23). Thus, the abundance of particular pairs of amino acids at D⫹2/T⫹2 might more directly reflect the distribution of response regulator subfamilies across species than the phylogeny of sequenced genomes. To test this idea, we compared the abundance of D⫹2/T⫹2 pairs in sample species from various phylogenetic groups (see Table S12 in the supplemental material) with the abundance of response regulator subfamilies in the same organisms (see Table S13 in the supple-mental material). For example, more than three-quarters of re-sponse regulators in theActinobacteriasample belonged to the OmpR or NarL/FixJ subfamilies (see Table S13), and six of the seven most abundant D⫹2/T⫹2 pairs inAcinetobacteria(see Table S12) were highly enriched in the OmpR and NarL/FixJ sub-families (Table 3). Similarly,⬎70% of receiver domains in the Cyanobacteriasample belonged to the hybrid kinase or
single-domain subfamily, and the seven most common D⫹2/T⫹2
pairs in theCyanobacteriasample were characteristic of these two subfamilies. Additional examples are evident. Overall, the data in Tables S12 and S13 are consistent with the abundance of response
regulator subfamilies being a primary determinant of the most frequent D⫹2/T⫹2 pairs found in a given species.
If the distribution of response regulator families is very differ-ent in organisms that have not been sequenced compared to those that have, then the most frequent D⫹2/T⫹2 pairs in our data-base (see Table S11 in the supplemental material) may not be the most abundant in nature. Nevertheless, the 20 overall most com-mon D⫹2/T⫹2 pairs, which were the focus of our experimental investigation, account for two-thirds of the 70 pairs (10 most common D⫹2/T⫹2 pairs in each of seven receiver domain subfamilies) listed inTable 3. Representation of naturally occur-ring receiver domains could be further enhanced by experimental characterization of the effects of the D⫹2/T⫹2 pairs that are most abundant in each response regulator subfamily, rather than across all receiver domains.
Experimental design guided by protein sequences has broad implications for strategies to assess variation within protein families.With rapid advancements in genome sequencing, the known sizes of protein families have dramatically increased. While conserved domains identify the family to which a protein belongs, questions of functionality remain. Assessment of func-tionality within a protein family has historically focused on con-served residues within the concon-served domain. Typically, protein sequences are aligned to determine the conserved residues, the conserved residues are changed to alanines or other amino acids, and the mutant proteins are assessed using functional assays. However, when considering the different functionalities within a family of proteins, it is often the variable features that distinguish one protein in a family from another. Candidates for functionally important variable positions can be identified by mutual informa-tion analysis, inspecinforma-tion of protein structures, or alanine-scan-ning mutagenesis. Protein sequence analysis dramatically en-hanced the feasibility of studying variable features of a large protein family, i.e., response regulators. Not only were we able to assess receiver domain autodephosphorylation kinetics of a mu-tant set that reflects what is found in nature, but also we were able to gain more confidence in the mechanistic insights elucidated by an expanded data set. While previous work indicated steric occlu-sion as a key means of influence by D⫹2/T⫹2 pairs on autode-phosphorylation, the larger data set reported here suggests with more confidence that interaction with the attacking water is a key means of influence.
Protein sequence analysis also revealed distinctions between response regulator subfamilies. The D⫹2/T⫹2 pairs enriched in the response regulator subfamily databases (Table 3) modulated autodephosphorylation in ways that are consistent with the bio-logical functions associated with response regulators in those sub-families. Grouping protein sequences into subcategories (such as the response regulator subfamilies used here) combined with the knowledge of influence from variable features (such as results from changing D⫹2/T⫹2 reported here) could provide further mechanistic insight into functional variation with protein fami-lies.
ACKNOWLEDGMENTS
FUNDING INFORMATION
This work, including the efforts of Bob Bourret, was funded by HHS | NIH | National Institute of General Medical Sciences (NIGMS) (GM050860). This work, including the efforts of Stephani Page, was funded by HHS | NIH | National Institute of General Medical Sciences (NIGMS) (GM008570).
REFERENCES
1.Stock AM, Robinson VL, Goudreau PN.2000. Two-component signal transduction. Annu Rev Biochem69:183–215.http://dx.doi.org/10.1146 /annurev.biochem.69.1.183.
2.Wuichet K, Cantwell BJ, Zhulin IB.2010. Evolution and phyletic distri-bution of two-component signal transduction systems. Curr Opin Micro-biol13:219 –225.http://dx.doi.org/10.1016/j.mib.2009.12.011.
3.Capra EJ, Laub MT.2012. Evolution of two-component signal transduc-tion systems. Annu Rev Microbiol66:325–347.http://dx.doi.org/10.1146 /annurev-micro-092611-150039.
4.West AH, Stock AM. 2001. Histidine kinases and response regulator proteins in two-component signaling systems. Trends Biochem Sci26: 369 –376.http://dx.doi.org/10.1016/S0968-0004(01)01852-7.
5.Bourret RB, Thomas SA, Page SC, Creager-Allen RL, Moore AM, Silversmith RE.2010. Measurement of response regulator autodephos-phorylation rates spanning six orders of magnitude. Methods Enzymol 471:89 –114.http://dx.doi.org/10.1016/S0076-6879(10)71006-5. 6.Berman HM, Westbrook J, Feng Z, Gilliland G, Bhat TN, Weissig H,
Shindyalov IN, Bourne PE.2000. The Protein Data Bank. Nucleic Acids Res28:235–242.http://dx.doi.org/10.1093/nar/28.1.235.
7.Rose PW, Prlic A, Bi C, Bluhm WF, Christie CH, Dutta S, Green RK, Goodsell DS, Westbrook JD, Woo J, Young J, Zardecki C, Berman HM, Bourne PE, Burley SK.2015. The RCSB Protein Data Bank: views of structural biology for basic and applied research and education. Nucleic Acids Res43:D345–D356.http://dx.doi.org/10.1093/nar/gku1214. 8.Bourret RB.2010. Receiver domain structure and function in response
regulator proteins. Curr Opin Microbiol13:142–149.http://dx.doi.org/10 .1016/j.mib.2010.01.015.
9.Volz K.1993. Structural conservation in the CheY superfamily. Biochem-istry32:11741–11753.http://dx.doi.org/10.1021/bi00095a001.
10. Pazy Y, Wollish AC, Thomas SA, Miller PJ, Collins EJ, Bourret RB, Silversmith RE. 2009. Matching biochemical reaction kinetics to the timescales of life: structural determinants that influence the autodephos-phorylation rate of response regulator proteins. J Mol Biol392:1205–1220. http://dx.doi.org/10.1016/j.jmb.2009.07.064.
11. Thomas SA, Brewster JA, Bourret RB.2008. Two variable active site residues modulate response regulator phosphoryl group stability. Mol Mi-crobiol69:453– 465.http://dx.doi.org/10.1111/j.1365-2958.2008.06296.x. 12. Thomas SA, Immormino RM, Bourret RB, Silversmith RE.2013. Non-conserved active site residues modulate CheY autophosphorylation kinet-ics and phosphodonor preference. Biochemistry52:2262–2273.http://dx .doi.org/10.1021/bi301654m.
13. Page SC, Silversmith RE, Collins EJ, Bourret RB.2015. Imidazole as a small molecule analogue in two-component signal transduction. Biochemistry54: 7248 –7260.http://dx.doi.org/10.1021/acs.biochem.5b01082.
14.Creager-Allen RL, Silversmith RE, Bourret RB. 2013. A link between dimerization and autophosphorylation of the response regulator PhoB. J Biol Chem288:21755–21769.http://dx.doi.org/10.1074/jbc.M113.471763. 15. Silversmith RE, Appleby JL, Bourret RB.1997. Catalytic mechanism of
phosphorylation and dephosphorylation of CheY: kinetic characteriza-tion of imidazole phosphates as phosphodonors and the role of acid catal-ysis. Biochemistry36:14965–14974.http://dx.doi.org/10.1021/bi9715573. 16. Finn RD, Bateman A, Clements J, Coggill P, Eberhardt RY, Eddy SR,
Heger A, Hetherington K, Holm L, Mistry J, Sonnhammer EL, Tate J, Punta M.2014. Pfam: the protein families database. Nucleic Acids Res 42:D222–D230.http://dx.doi.org/10.1093/nar/gkt1223.
17. Simonetti FL, Teppa E, Chernomoretz A, Nielsen M, Marino Buslje C. 2013. MISTIC: mutual information server to infer coevolution. Nucleic Acids Res41:W8 –W14.http://dx.doi.org/10.1093/nar/gkt427.
18.Ulrich LE, Zhulin IB. 2010. The MiST2 database: a comprehensive genomics resource on microbial signal transduction. Nucleic Acids Res 38:D401–D407.http://dx.doi.org/10.1093/nar/gkp940.
19. Ulrich LE, Zhulin IB.2014. SeqDepot: streamlined database of biological sequences and precomputed features. Bioinformatics30:295–297.http: //dx.doi.org/10.1093/bioinformatics/btt658.
20. Edgar RC.2010. Search and clustering orders of magnitude faster than BLAST. Bioinformatics 26:2460 –2461. http://dx.doi.org/10.1093 /bioinformatics/btq461.
21. Edgar RC.2004. MUSCLE: multiple sequence alignment with high accu-racy and high throughput. Nucleic Acids Res32:1792–1797.http://dx.doi .org/10.1093/nar/gkh340.
22. Maule AF, Wright DP, Weiner JJ, Han L, Peterson FC, Volkman BF, Silvaggi NR, Ulijasz AT.2015. The aspartate-less receiver (ALR) do-mains: distribution, structure and function. PLoS Pathog11:e1004795. http://dx.doi.org/10.1371/journal.ppat.1004795.
23. Galperin MY.2010. Diversity of structure and function of response reg-ulator output domains. Curr Opin Microbiol13:150 –159.http://dx.doi .org/10.1016/j.mib.2010.01.005.
24. Pao GM, Saier MH, Jr.1995. Response regulators of bacterial signal transduction systems: selective domain shuffling during evolution. J Mol Evol40:136 –154.http://dx.doi.org/10.1007/BF00167109.
25. Grebe TW, Stock JB.1999. The histidine protein kinase superfamily. Adv Microb Physiol 41:139 –227.http://dx.doi.org/10.1016/S0065-2911 (08)60167-8.
26. Mack TR, Gao R, Stock AM.2009. Probing the roles of the two different dimers mediated by the receiver domain of the response regulator PhoB. J Mol Biol389:349 –364.http://dx.doi.org/10.1016/j.jmb.2009.04.014. 27. Immormino RM, Starbird CA, Silversmith RE, Bourret RB. 2015.
Probing mechanistic similarities between response regulator signaling proteins and haloacid dehalogenase phosphatases. Biochemistry54:3514 – 3527.http://dx.doi.org/10.1021/acs.biochem.5b00286.
28. Burroughs AM, Allen KN, Dunaway-Mariano D, Aravind L. 2006. Evolutionary genomics of the HAD superfamily: understanding the struc-tural adaptations and catalytic diversity in a superfamily of phosphoes-terases and allied enzymes. J Mol Biol361:1003–1034.http://dx.doi.org /10.1016/j.jmb.2006.06.049.
29. Segall JE, Manson MD, Berg HC.1982. Signal processing times in bac-terial chemotaxis. Nature296:855– 857. http://dx.doi.org/10.1038 /296855a0.
30. Sourjik V, Schmitt R.1998. Phosphotransfer between CheA, CheY1, and CheY2 in the chemotaxis signal transduction chain ofRhizobium meliloti. Biochemistry37:2327–2335.http://dx.doi.org/10.1021/bi972330a. 31. Freeman JA, Bassler BL.1999. Sequence and function of LuxU: a
two-component phosphorelay protein that regulates quorum sensing inVibrio harveyi. J Bacteriol181:899 –906.
32. Janiak-Spens F, Sparling DP, West AH.2000. Novel role for an HPt domain in stabilizing the phosphorylated state of a response regulator domain. J Bacteriol182:6673– 6678.http://dx.doi.org/10.1128/JB.182.23 .6673-6678.2000.