The esophageal biopsy “pull” sign: a highly specific and
treatment-responsive endoscopic finding in eosinophilic
esophagitis (with video)
Evan S. Dellon, MD MPH1,2, Jessica H. Gebhart, MSHS1, Leana L. Higgins, MS1, Kelly E. Hathorn, BS1, John T. Woosley, MD PhD3, and Nicholas J. Shaheen, MD MPH1,2
1Center for Esophageal Diseases and Swallowing, University of North Carolina School of
Medicine, Chapel Hill, NC
2Center for Gastrointestinal Biology and Disease, Division of Gastroenterology and Hepatology,
Department of Medicine; University of North Carolina School of Medicine, Chapel Hill, NC
3Department of Pathology and Laboratory Medicine; University of North Carolina School of
Medicine, Chapel Hill, NC
Abstract
Background and Aims—Esophageal biopsies in patients with eosinophilic esophagitis (EoE) can feel firm, with resistance appreciated when pulling the forceps to obtain the tissue sample. We aimed to assess the diagnostic utility of the esophageal biopsy pull sign, and determine its
histologic associations and response to treatment.
Methods—This was a prospective cohort study of adults undergoing outpatient upper endoscopy. Cases of EoE were diagnosed per consensus guidelines and were subsequently treated with either topical steroids or dietary elimination. Controls were subjects who did not have EoE. The frequency of the esophageal biopsy pull sign was assessed in EoE cases and controls, and diagnostic metrics were calculated. The pull sign was also reassessed in cases after therapy.
Results—83 EoE cases and 121 controls were included. 63 EoE cases (76%) were pull sign positive compared with just 2 controls (2%; p < 0.001), corresponding to a sensitivity and
specificity of 76% and 98%, positive and negative predictive values of 97% and 86%, and positive and negative likelihood ratios of 45.9 and 0.245. The pull sign was the strongest endoscopic
Corresponding Author: Evan S. Dellon MD, CB#7080, Bioinformatics Building, 130 Mason Farm Rd., UNC-CH, Chapel Hill, NC 27599-7080, Phone: (919) 966-2513, Fax: (919) 843-2508, [email protected].
Publisher's Disclaimer: This is a PDF file of an unedited manuscript that has been accepted for publication. As a service to our
customers we are providing this early version of the manuscript. The manuscript will undergo copyediting, typesetting, and review of the resulting proof before it is published in its final citable form. Please note that during the production process errors may be discovered which could affect the content, and all legal disclaimers that apply to the journal pertain.
AUTHOR CONTRIBUTIONS
Dellon: Project conception, study design, data collection, data interpretation, manuscript drafting, critical revision, final approval Gebhart: Data collection and management, critical revision, final approval
Higgins: Data collection and management, critical revision, final approval Hathorn: Data collection; critical revision; final approval
HHS Public Access
Author manuscript
Gastrointest Endosc. Author manuscript; available in PMC 2017 January 01.
Published in final edited form as:
Gastrointest Endosc. 2016 January ; 83(1): 92–100. doi:10.1016/j.gie.2015.05.046.
Author Manuscript
Author Manuscript
Author Manuscript
predictor of EoE case status at baseline, and was less frequent after successful treatment (20% vs 79%; p < 0.001).
Conclusions—The “pull” sign is highly specific for EoE, and is rarely seen in non-EoE
controls. In patients with EoE who respond to treatment, the pull sign often resolves. The pull sign may be a simple and easily obtained measure of esophageal remodeling.
Keywords
Eosinophilic esophagitis; biopsy; endoscopy; diagnosis; fibrosis
Introduction
Eosinophilic esophagitis (EoE) is a chronic allergic/immune-mediated condition of the esophagus characterized by symptoms of esophageal dysfunction and epithelial infiltration of eosinophils in the esophagus.1, 2 The associated endoscopic features of EoE include esophageal rings, strictures, diffuse narrowing, linear furrows, white plaques, decreased vascularity or edema, and fragile mucosa (“crêpe-paper”).1–3 Although these are increasingly recognized signs of EoE, the findings themselves are not specific to the condition, differ by age of presentation, and therefore are not currently required for diagnosis.4–7
The diverse endoscopic findings of EoE may be related to different aspects of the disease pathogenesis. Some can be attributed to its inflammatory component, for example white plaques are thought to represent eosinophilic microabscess and eosinophilic exudate.8, 9 Others can be attributed to fibrosis and esophageal remodeling, such as the rings, strictures, and narrowing.6, 10, 11 However, regardless of the endoscopic appearance, the current recommendation is that esophageal biopsies are required to demonstrate eosinophilia before diagnosing EoE.1, 2 We have recently observed that when obtaining biopsy specimens in patients with EoE, the mucosa feels firm, and there can be substantial resistance when pulling on the forceps to remove the biopsy sample, particularly when compared with non-EoE patients. Although this has also been noted in a recent series of non-EoE patients,12 it is unknown whether this finding, termed the esophageal biopsy “pull” sign, has diagnostic utility for EoE, whether it represents underlying epithelial fibrosis, or whether it improves after treatment.
The aims of this study were to describe the esophageal biopsy pull sign, assess the diagnostic utility of this finding, and determine histologic associations and response to treatment. We hypothesized that the finding was specific for EoE, that there would be an association with lamina propria fibrosis, and that the sign would resolve with successful treatment.
Methods
Study design and case definitions
We conducted a sub-analysis of a prospective cohort study conducted at University of North Carolina, focusing on patients enrolled from March, 2011, through December, 2013. For the
Author Manuscript
Author Manuscript
Author Manuscript
present study, the pull sign was a pre-specified secondary outcome of interest. For the parent study, consecutive adults (age ≥18 years) referred for outpatient upper endoscopy were recruited if they had symptoms of esophageal dysfunction (ie dysphagia, food impaction, heartburn, reflux, or chest pain). Exclusion criteria were: known diagnosis of EoE; known diagnosis of a non-EoE eosinophilic gastrointestinal disorder (EGID); known esophageal cancer; prior esophageal surgery; GI bleeding; anticoagulation; known esophageal varices; medical instability or multiple comorbidities precluding enrollment in the clinical opinion of the endoscopist; and inability to read or understand the consent form. This study was approved by the UNC Institutional Review Board. Subjects provided informed consent and were enrolled before the endoscopy.
Consensus diagnosis guidelines were used to identify cases of EoE.1, 2, 13 EoE cases had to have a typical symptom of esophageal dysfunction, an esophageal biopsy with at least 15 eosinophils per high-power field (eos/hpf) after an 8 week trial of a proton-pump inhibitor (PPI; 20–40 mg twice daily of any of the available agents, prescribed at the discretion of the clinician), and other causes of esophageal eosinophilia excluded. Therefore, baseline data were obtained for cases after the PPI trial, but before knowledge of the biopsy results or prescription of EoE-specific treatment. Non-EoE controls were subjects who, after endoscopy and biopsy, did not meet clinical and histologic criteria for EoE. Patients with PPI-responsive esophageal eosinophilia (PPI-REE) were not included in this analysis.
Clinical, endoscopic, and histologic data
We recorded all data, including demographics, symptoms, atopic conditions, and endoscopic findings, using standardized case report forms and a prospectively administered patient questionnaire. During endoscopy, esophageal biopsies for research use were obtained (2 from the proximal, one from the mid, and 2 from the distal esophagus) to maximize EoE diagnostic sensitivity.14, 15 Gastric and duodenal biopsy specimens were also collected for research purposes to exclude concomitant eosinophilic gastroenteritis. Additional clinical biopsy specimens were taken as indicated at the discretion of the endoscopist. All specimens were obtained with standard large capacity forceps (RJ4; Boston Scientific; Marlborough, Mass).
At the time that biopsy specimens were obtained, the endoscopist (ESD) reported on whether the pull sign was positive or negative. Pull-sign data were collected prospectively as a pre-specified secondary outcome within the framework of the overall study. A positive pull sign was defined by resistance appreciated when obtaining the biopsy specimen. In particular, increased force had to be applied by pulling on the forceps to remove the sample from the esophageal wall. This was typically associated with the mucosa feeling firm, mucosal tenting when the forceps were pulled, and the biopsy forceps being unable to fully close (Figures 1A–C; Video). A negative pull sign was recorded when these features were not present and there was no resistance when removing the tissue. These definitions are consistent with those used in a prior report.12 All patients in this study were assessed for their baseline examination before the diagnosis of EoE being known. Therefore, although the endoscopist was not formally blinded as to clinical features, case versus control status was not known at the time that the pull sign was determined.
Author Manuscript
Author Manuscript
Author Manuscript
After biopsy specimens were collected, we applied our previously validated methodology to quantify the esophageal eosinophil count.16 In brief, slides were masked to case/control status, digitized, and reviewed with Aperio ImageScope (Aperio Technologies, Vista, Calif). Pathologists also did not have access to clinical findings or endoscopy reports. Five
microscopy fields from each of the 5 biopsies were examined to determine the maximum eosinophil density (eosinophils/mm2). Eosinophil density was then converted to an eosinophil count (eos/hpf) using a hpf size of 0.24 mm2, the most commonly reported field size in the literature,17 in order to compare results with prior studies. We also recorded other histologic findings associated with EoE, including: eosinophilic microabscesses (clusters of ≥ 4 eosinophils); eosinophil degranulation; basal layer hyperplasia; spongiosis; and lamina propria fibrosis (assessed when adequate subepithelial stroma was present).15, 18
Treatment and follow-up
EoE cases who were identified in this study were treated at the discretion of their
gastroenterologist as clinically indicated. Patients could either receive topical corticosteroids (either oral viscous budesonide 1 mg twice daily or fluticasone from a multi-dose inhaler, 880 mcg twice daily for eight weeks),19–21 or dietary therapy with the six-food elimination diet (avoidance of dairy, wheat, egg, soy, nuts, and seafood) for 6 weeks.22, 23 At the end of either treatment period, repeat upper endoscopy was performed. During this follow-up examination, endoscopic findings and the pull sign were recorded, and esophageal biopsy specimens were obtained with a protocol identical to that outlined above. Response to treatment was defined histologically as <15 eos/hpf.24
Statistical analysis
Descriptive statistics were used to summarize the clinical, endoscopic, and histologic features of the EoE cases and non-EoE controls, as well as to characterize the EoE cases who were pull sign positive versus those who were pull sign negative. Means were compared with a 2-sample t-test, and proportions were compared with chi-square. To compare baseline and follow-up characteristics of the EoE cases, paired t-tests were used for continuous variables and chi-square was used for categorical variables.
The frequency of the esophageal pull sign was determined in the EoE cases and non-EoE controls. The frequency was also determined in the EoE treatment responders (<15 eos/hpf) and non-responders. To assess the diagnostic utility of this sign to predict EoE case status (using the consensus diagnostic guidelines as the criterion standard), we calculated the area under the receiver operator characteristic curve (AUC) for a positive pull sign. To further contextualize this result, we calculated the sensitivity, specificity, positive predictive value (PPV), negative predictive value (NPV), and the positive and negative likelihood ratios (LR +; LR−). We also applied the LRs using Bayes Theorem to calculate a range of post-test probabilities corresponding to various pre-test probabilities for EoE. Multivariate logistic regression was used to determine whether a positive pull sign was an independent endoscopic predictor of EoE case status. For this model, all endoscopic findings that distinguished cases vs controls at the p<0.05 level were included. Given the subjective nature of the pull sign, we collected pilot data to assess interobserver agreement data between the corresponding author and 2 additional endoscopists for a subset of patients.
Author Manuscript
Author Manuscript
Author Manuscript
Agreement was calculated with the kappa statistic. All analyses were performed with Stata (version 9.2; StataCorp; College Station, Tex).
Results
Characteristics of the cases and controls
A total of 204 subjects, 83 EoE cases and 121 controls, had esophageal biopsy pull sign data available and were analyzed in this study. Compared with controls, EoE cases were younger (38 vs 51 years; p < 0.001), more likely to be male (65% vs 36%; p < 0.001), white (93% vs 81%; p = 0.02), have dysphagia (96% vs 73%; p < 0.001), and have food allergies (41% vs 15%; p < 0.001) (Table 1). Only 3 EoE cases (4%) had a normal upper endoscopy, and the typical endoscopic findings of EoE were more common in the case group (Table 1). The mean of the maximum eosinophilic counts was 144 eos/hpf in the cases and 2 in the controls (p < 0.001). In the 46 (58%) EoE cases where sub-epithelial stromal tissue was obtained, 18 (39%) had lamina propria fibrosis, a finding seen in only 3 (10%) of the controls (p = 0.004).
Diagnostic utility of the pull sign
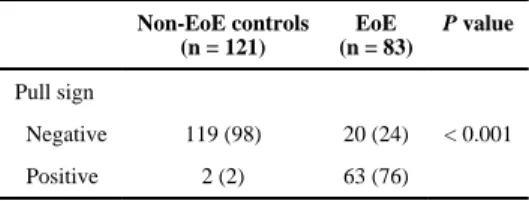
There were 63 EoE cases that were pull sign positive (76%) compared with just 2 controls (2%; p < 0.001) (Table 2). The AUC for this finding was 0.871, corresponding to a
sensitivity of 76%, specificity of 98%, PPV of 97%, NPV of 86%, LR+ of 45.9, and LR− of 0.245. Figure 2 demonstrates how these LRs impact post-test probability for EoE. For a pre-test probability of 6%, 15%, or 23% (the expected prevalence of EoE in all patients undergoing endoscopy,25 and lower and upper bounds of EoE prevalence in patients undergoing endoscopy for an indication of dysphagia26–28), the post-test probabilities are 75%, 89%, and 93%, respectively, with a positive pull sign, and 2%, 4%, and 7% with a negative pull sign. A pre-test probability of 75% would increase to a post-test probability of 99% after a positive pull sign, and decrease to 42% with a negative sign.
After multivariate analysis of a model including endoscopic findings of rings, narrowing, furrows, crêpe-paper mucosa, plaques, decreased vascularity, erosive esophagitis, hiatal hernia, and the pull sign, a positive pull sign was the strongest independent predictor of EoE cases status (OR 45.5; 95% CI, 5.32–339). The other features that remained independent were rings (OR 5.75; 95% CI, 1.09–30.4), furrows (12.8; 2.64–61.7), and lack of a hiatal hernia (0.21; 0.05–0.94).
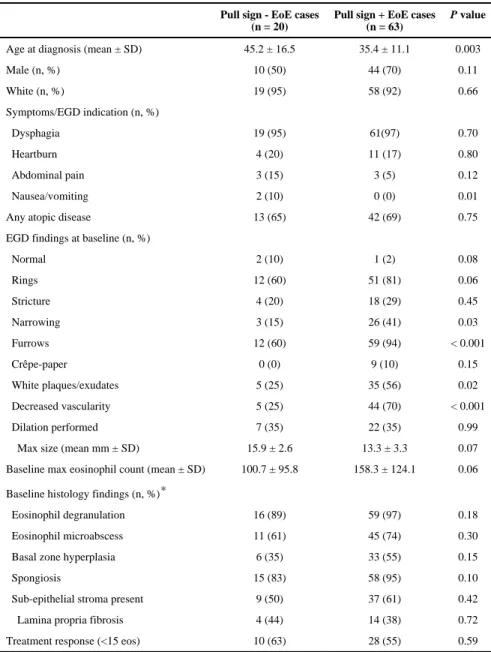
There were few differences in demographics and symptoms between the EoE cases who were pull sign positive and those who were pull sign negative (Table 3). However, endoscopic findings tended to be more common in the pull sign positive cases, including rings (81% vs 60%; p = 0.06), narrowing (41% vs 15%; p = 0.03), furrows (94% vs 60%; p < 0.001), plaques (56% vs 25%; p = 0.02), and decreased vascularity (70% vs 25%; p < 0.001). There was also a trend toward a higher eosinophil count in the EoE cases that were pull sign positive (158 vs 101 eos/hpf; p = 0.06). There were no significant differences in histologic findings, including lamina propria fibrosis (38% vs 44%; p = 0.72) in EoE cases with and without a positive pull sign (Table 3).
Author Manuscript
Author Manuscript
Author Manuscript
We were able to assess interobserver agreement between the corresponding author and 2 additional endoscopists on a total of 21 subjects. The overall agreement was 90%, corresponding to a kappa of 0.81 (p < 0.001). Depending on the endoscopist, agreement ranged from 88% to 92%, corresponding with a kappa of 0.75 to 0.85 (p = 0.01 and 0.001, respectively).
The pull sign and response to treatment
A total of 58 EoE cases had both pull sign and histologic data available after treatment. The vast majority of this cohort (55; 95%) received topical steroid treatment. There were 25 histologic responders (post-treatment max eosinophil count 3 ± 4 eos/hpf) and 33 non-responders (118 ± 100 eos/hpf). Of the non-responders, only 5 (20%) had a positive pull sign on post-therapy EGD, whereas 26 (79%) of the non-responders had a positive pull sign (p < 0.001) (Figure 3A). Of note, a positive pull sign at baseline did not predict treatment response: 28 of the EoE cases with a positive pull sign responded (55%) compared with 10 of the pull sign negative cases (63%; p = 0.59).
A paired analysis showed that of the 41 who were pull sign positive at baseline, 18 (44%) were pull sign negative after treatment (p = 0.01), suggesting that treatment could improve the compliance of the mucosa. This difference was more prominent after stratifying by histologic response and repeating the paired analysis. For the 20 histologic responders who were pull sign positive at baseline, only 5 (25%) remained positive after treatment (p < 0.001). In contrast, of the 21 non-responders who were pull sign positive at baseline, 18 (86%) remained positive after treatment (p < 0.001).
Post-treatment endoscopic findings also correlated with the pull sign (Figure 3B). For example, EoE cases with a positive pull sign after treatment were more likely to have rings (68% vs 40%; p = 0.03), strictures (48% vs 15%; p = 0.006), narrowing (32% vs 9%; p = 0.03), plaques (44% vs 9%; p = 0.002), and decreased vascularity (60% vs 6%; p < 0.001).
Discussion
The typical endoscopic findings of EoE have been shown to be commonly encountered, but are not specific or pathognomonic for EoE.3, 4, 6, 7 A novel endoscopic finding, the
esophageal biopsy “pull” sign, has recently been observed by other investigators,12 but both the diagnostic utility and responsiveness to treatment of this sign were unknown. We used a prospective cohort study to address these questions and found that the pull sign was highly specific for EoE and responsive to retreatment, with resolution of the pull sign after successful therapy. However, in contrast to our hypothesis, we did not find a clear link between the pull sign and the presence of lamina propria fibrosis, though the pull sign was associated with most of the other endoscopic findings of EoE.
This sign has been noted in one other study reported as a letter to the editor.12 Moawad and colleagues prospectively assessed 48 adults with esophageal eosinophilia, 39 of whom had EoE and 9 of whom had PPI-REE. Of the 48, half had resistance appreciated when obtaining an esophageal biopsy specimen. They found very few differences between the positive and negative groups, though patients with a positive sign were younger and more likely to have a
Author Manuscript
Author Manuscript
Author Manuscript
stricture requiring dilation. Our results were similar when comparing EoE cases with and without the pull sign, with younger patients having a positive sign, and with generally few differences otherwise noted between the groups. We did not observe the same increase in stricture rate and dilation in the EoE cases that were pull sign positive, and because their study did not include non-EoE controls or post-treatment data, we cannot directly compare the results of our diagnostic utility or treatment response analyses. We are not aware of any other investigations reporting on this new endoscopic finding in EoE.
Can the known pathogenesis of EoE help to explain the specificity of the positive pull sign in EoE cases? Although EoE is an inflammatory condition, there are also a number of mechanisms that lead to increased fibrosis.10, 29–35 EUS studies show that the esophageal wall is thickened in EoE compared with controls,36, 37 and that this thickening can partially or completely resolve after treatment.38 This is similar to the resolution of lamina propria fibrosis that has been reported after treatment as well.32, 39–42 Based on esophagectomy specimens, both eosinophilic inflammation and fibrosis can be seen transmurally in EoE,33, 43 processes that likely impact the mechanical properties of the esophagus. More recently, reduced esophageal compliance as a consequence of EoE has been shown using a functional luminal impedance probe, and this compliance also improves after treatment.44, 45 Because the typical esophageal biopsy specimens that are obtained to assess histologic disease activity in EoE are largely restricted to the epithelium, it is difficult to determine the extent of transmural esophageal remodeling that is present in routine clinical practice without specialized testing.15, 33, 43 Moreover, subtle esophageal narrowing could be missed at the time of endoscopy,46 which would imply that remodeling adverse events of EoE could also be missed.
We would hypothesize that the pull sign is a potential proxy indicator for this remodeling process, and as such is simple and fast to assess with standard equipment. Although our results do not show an association between the pull sign and lamina propria fibrosis, this is not definitive. Only a sub-set of the EoE cases had subepithelial tissue on biopsy to assess, and mucosal biopsy depth is inadequate to accurately evaluate submucosal levels, so the study may have been underpowered for this analysis. More interesting was the fact that the pull sign resolved in the EoE cases that responded to treatment, both overall and on a paired analysis, and this resolution was also associated with improvement in the other endoscopic features. This could imply that in these patients who responded, the underlying remodeling process has also improved.39–42 In addition, the pull sign was highly specific for EoE and was the strongest independent endoscopic predictor of EoE case status. Therefore, it could have clinical utility in a diagnostic algorithm when present, as it greatly impacts the post-test probability of having EoE.
There are limitations of this study to discuss. First, this study was conducted at a single center and only enrolled adults, so we cannot comment on the generalizability of these findings or whether a pull sign could be appreciated in children. Although lamina propria fibrosis has been described in children,39, 41 overt signs of endoscopic remodeling such as rings, strictures, or narrowing are typically less prevalent in this age range.4, 5 Second, the pull sign is a subjective endoscopic finding. In this study, we attempted to minimize the impact of this by having all patients assessed by the same endoscopist before the
Author Manuscript
Author Manuscript
Author Manuscript
confirmation of the EoE diagnosis and before histologic findings were reported. Given the nature of our study design, we were not able to truly blind the endoscopist from the appearance of the esophagus. Although we acknowledge that the visible presence of other endoscopic findings of EoE could have impacted on the reporting of the pull sign, it was still assessed as an independent sign. Additionally, this sign will be elicited in the setting of available endoscopic findings, so the relevance of the data presented here to the clinical context remains high. We would also note that in practice this sign is not subtle. Indeed, at least anecdotally, both the endoscopy technicians and nurses in our procedure rooms could tell when excess force had to be used to remove esophageal biopsy specimens, although those responses were not formally recorded as part of this study. Our pilot data on interobserver agreement would support this, as we observed very good agreement for the sign. However, larger studies are necessary to confirm this preliminary finding, and future studies could also include efforts to formally measure the pulling force transmitted across the biopsy forceps. Third, the majority of subjects were treated with topical steroids, so we did not have the power to assess whether there was a difference in pull sign frequency after treatment with dietary elimination. Fourth, we only used a single forceps model during this study. Although that allowed a consistent assessment of the pull sign, it is a limitation that multiple forceps models were not tested. Finally, we were not able to correlate the pull sign with objective measures of full thickness esophageal remodeling such as endoscopic ultrasound or functional luminal impedance, or correlate these measures with lamina propria fibrosis, but these are a future direction for research.
There are also a number of strengths to this study. It was a prospective study including a large number of EoE cases and controls, with systematic recording of data and findings, and with post-treatment follow-up. Because we included both cases and controls, we were able to assess the specificity and diagnostic utility of the pull sign, and because we followed patients after treatment, we were able to assess the responsiveness of the sign to therapy. The data presented here, then, are unique in the literature, and we feel the study
methodology lends validity to the findings.
In conclusion, this prospective study showed that a new endoscopic finding, the esophageal biopsy “pull” sign, is highly specific for EoE. A patient with this sign is very likely to have EoE, and this sign is rarely seen in non-EoE controls. Moreover, in patients with EoE who have a histologic response to treatment, the pull sign often resolves. Given that fibrosis is a major consequence of EoE and that transmural assessment of disease activity is difficult, the pull sign may be a simple and easily obtained metric of esophageal remodeling.
Supplementary Material
Refer to Web version on PubMed Central for supplementary material.
Acknowledgments
Grant support: This work was supported, in part, by NIH Awards K23 DK090073 (ESD) and K24DK100548 (NJS), and uses resources from the UNC Center for GI Biology and Disease (P30 DK34987).
Author Manuscript
Author Manuscript
Author Manuscript
References
1. Liacouras CA, Furuta GT, Hirano I, et al. Eosinophilic esophagitis: Updated consensus
recommendations for children and adults. J Allergy Clin Immunol. 2011; 128:3 e6–20.e6. [PubMed: 21477849]
2. Dellon ES, Gonsalves N, Hirano I, et al. ACG Clinical Guideline: Evidence based approach to the diagnosis and management of esophageal eosinophilia and eosinophilic esophagitis. Am J Gastroenterol. 2013; 108:679–692. [PubMed: 23567357]
3. Dellon ES, Liacouras CA. Advances in Clinical Management of Eosinophilic Esophagitis. Gastroenterology. 2014; 147:1238–1254. [PubMed: 25109885]
4. Kim HP, Vance RB, Shaheen NJ, et al. The Prevalence and Diagnostic Utility of Endoscopic Features of Eosinophilic Esophagitis: A Meta-Analysis. Clin Gastroenterol Hepatol. 2012; 10:988 e5–996.e5. [PubMed: 22610003]
5. Dellon ES, Gibbs WB, Fritchie KJ, et al. Clinical, endoscopic, and histologic findings distinguish eosinophilic esophagitis from gastroesophageal reflux disease. Clin Gastroenterol Hepatol. 2009; 7:1305–1313. [PubMed: 19733260]
6. Hirano I, Moy N, Heckman MG, et al. Endoscopic assessment of the oesophageal features of eosinophilic oesophagitis: validation of a novel classification and grading system. Gut. 2013; 62:489–495. [PubMed: 22619364]
7. Peery AF, Cao H, Dominik R, et al. Variable reliability of endoscopic findings with white-light and narrow-band imaging for patients with suspected eosinophilic esophagitis. Clin Gastroenterol Hepatol. 2011; 9:475–480. [PubMed: 21377547]
8. Lim JR, Gupta SK, Croffie JM, et al. White specks in the esophageal mucosa: An endoscopic manifestation of non-reflux eosinophilic esophagitis in children. Gastrointest Endosc. 2004; 59:835–838. [PubMed: 15173797]
9. Straumann A, Spichtin HP, Bucher KA, et al. Eosinophilic esophagitis: red on microscopy, white on endoscopy. Digestion. 2004; 70:109–116. [PubMed: 15383737]
10. Cheng E, Souza RF, Spechler SJ. Tissue remodeling in eosinophilic esophagitis. Am J Physiol Gastrointest Liver Physiol. 2012; 303:G1175–G1187. [PubMed: 23019192]
11. Dellon ES, Kim HP, Sperry SL, et al. A phenotypic analysis shows that eosinophilic esophagitis is a progressive fibrostenotic disease. Gastrointest Endosc. 2014; 79:577 e4–585.e4. [PubMed: 24275329]
12. Moawad FJ, Robinson CL, Veerappan GR, et al. The tug sign: an endoscopic feature of eosinophilic esophagitis. Am J Gastroenterol. 2013; 108:1938–1939. [PubMed: 24300877] 13. Furuta GT, Liacouras CA, Collins MH, et al. Eosinophilic esophagitis in children and adults: a
systematic review and consensus recommendations for diagnosis and treatment. Gastroenterology. 2007; 133:1342–1363. [PubMed: 17919504]
14. Gonsalves N, Policarpio-Nicolas M, Zhang Q, et al. Histopathologic variability and endoscopic correlates in adults with eosinophilic esophagitis. Gastrointest Endosc. 2006; 64:313–319. [PubMed: 16923475]
15. Dellon ES, Speck O, Woodward K, et al. Distribution and variability of esophageal eosinophilia in patients undergoing upper endoscopy. Mod Pathol. 2015; 28:383–390. [PubMed: 25216228] 16. Dellon ES, Fritchie KJ, Rubinas TC, et al. Inter- and intraobserver reliability and validation of a
new method for determination of eosinophil counts in patients with esophageal eosinophilia. Dig Dis Sci. 2010; 55:1940–1949. [PubMed: 19830560]
17. Dellon ES, Aderoju A, Woosley JT, et al. Variability in diagnostic criteria for eosinophilic esophagitis: A systematic review. Am J Gastroenterol. 2007; 102:2300–2313. [PubMed: 17617209]
18. Collins MH. Histopathologic features of eosinophilic esophagitis. Gastrointest Endosc Clin N Am. 2008; 18:59–71. viii–ix. [PubMed: 18061102]
19. Dellon ES, Sheikh A, Speck O, et al. Viscous Topical is More Effective than Nebulized Steroid Therapy for Patients with Eosinophilic Esophagitis. Gastroenterology. 2012; 143:321 e1–324.e1. [PubMed: 22561055]
Author Manuscript
Author Manuscript
Author Manuscript
20. Alexander JA, Jung KW, Arora AS, et al. Swallowed Fluticasone Improves Histologic but Not Symptomatic Responses of Adults with Eosinophilic Esophagitis. Clin Gastroenterol Hepatol. 2012; 10:742 e1–749.e1. [PubMed: 22475741]
21. Butz BK, Wen T, Gleich GJ, et al. Efficacy, Dose Reduction, and Resistance to High-dose Fluticasone in Patients with Eosinophilic Esophagitis. Gastroenterology. 2014; 147:324 e5– 333.e5. [PubMed: 24768678]
22. Gonsalves N, Yang GY, Doerfler B, et al. Elimination Diet Effectively Treats Eosinophilic Esophagitis in Adults; Food Reintroduction Identifies Causative Factors. Gastroenterology. 2012; 142:1451 e1–1459.e1. [PubMed: 22391333]
23. Wolf WA, Jerath MR, Sperry SL, et al. Dietary Elimination Therapy Is an Effective Option for Adults With Eosinophilic Esophagitis. Clin Gastroenterol Hepatol. 2014; 12:1272–1279. [PubMed: 24440337]
24. Wolf WA, Green DJ, Hughes JT, et al. What cut-point should be used to define a histologic response to topical steroid use in eosinophilic esophagitis? A data-driven approach using symptoms and endoscopic findings. Gastroenterology. 2014; 146(Suppl 1):S665–666. (Mo1832). 25. Veerappan GR, Perry JL, Duncan TJ, et al. Prevalence of Eosinophilic Esophagitis in an Adult
Population Undergoing Upper Endoscopy: A Prospective Study. Clin Gastroenterol Hepatol. 2009; 7:420–426. [PubMed: 19162236]
26. Prasad GA, Talley NJ, Romero Y, et al. Prevalence and Predictive Factors of Eosinophilic Esophagitis in Patients Presenting With Dysphagia: A Prospective Study. Am J Gastroenterol. 2007; 102:2627–2632. [PubMed: 17764492]
27. Dellon ES, Speck O, Woodward K, et al. Clinical and Endoscopic Characteristics do Not Reliably Differentiate PPI-Responsive Esophageal Eosinophilia and Eosinophilic Esophagitis in Patients Undergoing Upper Endoscopy: A Prospective Cohort Study. Am J Gastroenterol. 2013; 108:1854– 1860. [PubMed: 24145677]
28. Dellon ES. Epidemiology of eosinophilic esophagitis. Gastroenterol Clin North Am. 2014; 43:201– 218. [PubMed: 24813510]
29. Aceves SS, Newbury RO, Dohil R, et al. Esophageal remodeling in pediatric eosinophilic esophagitis. J Allergy Clin Immunol. 2007; 119:206–212. [PubMed: 17208603]
30. Aceves SS. Tissue remodeling in patients with eosinophilic esophagitis: what lies beneath the surface? J Allergy Clin Immunol. 2011; 128:1047–1049. [PubMed: 22036097]
31. Aceves SS, Chen D, Newbury RO, et al. Mast cells infiltrate the esophageal smooth muscle in patients with eosinophilic esophagitis, express TGF-beta1, and increase esophageal smooth muscle contraction. J Allergy Clin Immunol. 2010; 126:1198 e4–1204 e4. [PubMed: 21047675]
32. Kagalwalla AF, Akhtar N, Woodruff SA, et al. Eosinophilic esophagitis: epithelial mesenchymal transition contributes to esophageal remodeling and reverses with treatment. J Allergy Clin Immunol. 2012; 129:1387 e7–1396 e7. [PubMed: 22465212]
33. Rieder F, Nonevski I, Ma J, et al. T-Helper 2 Cytokines, Transforming Growth Factor beta1, and Eosinophil Products Induce Fibrogenesis and Alter Muscle Motility in Patients With Eosinophilic Esophagitis. Gastroenterology. 2014; 146:1266 e9–1277 e9. [PubMed: 24486052]
34. Beppu LY, Anilkumar AA, Newbury RO, et al. TGF-beta1-induced phospholamban expression alters esophageal smooth muscle cell contraction in patients with eosinophilic esophagitis. J Allergy Clin Immunol. 2014; 134:1100 e4–1107 e4. [PubMed: 24835503]
35. Muir AB, Dods K, Noah Y, et al. Esophageal epithelial cells acquire functional characteristics of activated myofibroblasts after undergoing an epithelial to mesenchymal transition. Exp Cell Res. 2015; 330:102–110. [PubMed: 25183431]
36. Stevoff C, Rao S, Parsons W, et al. EUS and histopathologic correlates in eosinophilic esophagitis. Gastrointest Endosc. 2001; 54:373–377. [PubMed: 11522985]
37. Fox VL, Nurko S, Teitelbaum JE, et al. High-resolution EUS in children with eosinophilic "allergic" esophagitis. Gastrointest Endosc. 2003; 57:30–36. [PubMed: 12518127]
38. Straumann A, Conus S, Degen L, et al. Long-term budesonide maintenance treatment is partially effective for patients with eosinophilic esophagitis. Clin Gastroenterol Hepatol. 2011; 9:400 e1– 409 e1. [PubMed: 21277394]
Author Manuscript
Author Manuscript
Author Manuscript
39. Aceves SS, Newbury RO, Chen D, et al. Resolution of remodeling in eosinophilic esophagitis correlates with epithelial response to topical corticosteroids. Allergy. 2010; 65:109–116. [PubMed: 19796194]
40. Lieberman JA, Morotti RA, Konstantinou GN, et al. Dietary therapy can reverse esophageal subepithelial fibrosis in patients with eosinophilic esophagitis: a historical cohort. Allergy. 2012; 67:1299–1307. [PubMed: 22913672]
41. Chehade M, Sampson HA, Morotti RA, et al. Esophageal subepithelial fibrosis in children with eosinophilic esophagitis. J Pediatr Gastroenterol Nutr. 2007; 45:319–328. [PubMed: 17873744] 42. Lucendo AJ, Arias A, De Rezende LC, et al. Subepithelial collagen deposition, profibrogenic
cytokine gene expression, and changes after prolonged fluticasone propionate treatment in adult eosinophilic esophagitis: a prospective study. J Allergy Clin Immunol. 2011; 128:1037–1046. [PubMed: 21880354]
43. Saffari H, Peterson KA, Fang JC, et al. Patchy eosinophil distributions in an esophagectomy specimen from a patient with eosinophilic esophagitis: Implications for endoscopic biopsy. J Allergy Clin Immunol. 2012; 130:798–800. [PubMed: 22502795]
44. Kwiatek MA, Hirano I, Kahrilas PJ, et al. Mechanical properties of the esophagus in eosinophilic esophagitis. Gastroenterology. 2011; 140:82–90. [PubMed: 20858491]
45. Nicodeme F, Hirano I, Chen J, et al. Esophageal Distensibility as a Measure of Disease Severity in Patients With Eosinophilic Esophagitis. Clin Gastroenterol Hepatol. 2013
46. Gentile N, Katzka D, Ravi K, et al. Oesophageal narrowing is common and frequently under-appreciated at endoscopy in patients with oesophageal eosinophilia. Aliment Pharmacol Ther. 2014; 40:1333–1340. [PubMed: 25287184]
ACRONYMS
AUC area under the curve
CI confidence interval
EGIDs Eosinophilic Gastrointestinal Diseases = EGIDs
EoE Eosinophilic Esophagitis
Eos/hpf eosinophils per high-power field
LR likelihood ratio
NPV negative predictive value
OR odds ratio
PPI proton pump inhibitor
PPI-REE proton pump inhibitor-responsive esophageal eosinophilia
PPV positive predictive value
Author Manuscript
Author Manuscript
Author Manuscript
Author Manuscript
Author Manuscript
Author Manuscript
Author Manuscript
Author Manuscript
Author Manuscript
Figure 1.
Endoscopic examples of a positive pull sign (A–C). In all images, the mucosa tents with pulling and the biopsy forceps are unable to be fully closed. When attempting to remove the biopsy sample, there is noticeable resistance.
Author Manuscript
Author Manuscript
Author Manuscript
Figure 2.
Diagnostic utility of the pull test, as illustrated using likelihood ratios. The pre-test probability (before assessing the pull sign) of having EoE is on the x-axis. The post-test probability (after assess the pull sign) is on the y-axis, and is impacted by whether the pull sign is positive (solid line) or negative (dashed line). Post-test probabilities were calculated using Bayes Theorem.
Author Manuscript
Author Manuscript
Author Manuscript
Author Manuscript
Author Manuscript
Author Manuscript
Figure 3.
(A) The pull sign and response to treatment. Proportion of EoE cases with a positive pull sign at baseline before treatment (black bar), and after treatment with non-responders noted with the light gray bar, and responders noted with the dark gray bar. The proportion of cases with a positive pull sign is significantly reduced in those with histologic response to
treatment, defined as a biopsy with <15 eos/hpf. (B) The pull sign and endoscopic findings after treatment. Endoscopic findings are more common after treatment in the pull sign positive EoE cases (black bars) than in the pull sign negative cases (gray bars).
Author Manuscript
Author Manuscript
Author Manuscript
Author Manuscript
Author Manuscript
Author Manuscript
Author Manuscript
Table 1
Clinical, endoscopic, and histologic characteristics of the EoE cases and non-EoE controls
Non-EoE controls (n = 121)
EoE (n = 83)
P value
Age at diagnosis (mean ± SD) 51.0 ± 13.5 37.7 ± 13.2 < 0.001
Male (n, %) 44 (36) 54 (65) < 0.001
White (n, %) 98 (81) 77 (93) 0.02
Symptoms/EGD indication (n, %)
Dysphagia 88 (73) 80 (96) < 0.001
Heartburn 85 (70) 15 (18) < 0.001
Abdominal pain 10 (8) 6 (7) 0.79
Nausea/vomiting 11 (9) 2 (2) 0.06
Atopic disorders (n, %)
Asthma 30 (25) 21 (26) 0.86
Atopic dermatitis 9 (7) 4 (5) 0.48
Allergic rhinitis/sinusitis 64 (53) 49 (60) 0.29
Food allergies 18 (15) 33 (41) < 0.001
Any atopic disease 72 (60) 55 (68) 0.23
EGD findings at baseline (n, %)
Normal 17 (14) 3 (4) 0.01
Rings 11 (9) 63 (76) < 0.001
Stricture 24 (20) 22 (27) 0.26
Narrowing 5 (4) 29 (35) < 0.001
Furrows 6 (5) 71 (86) < 0.001
Crêpe-paper 2 (2) 6 (7) 0.04
White plaques/exudates 4 (3) 40 (48) < 0.001
Decreased vascularity 5 (4) 49 (59) < 0.001
Erosive esophagitis 18 (15) 2 (2) 0.003
Hiatal hernia 63 (52) 11 (13) < 0.001
Dilation performed 37 (31) 29 (35) 0.51
Baseline max eosinophil count (mean ± SD) 1.9 ± 5.8 144.4 ± 119.9 < 0.001
Baseline histology findings (n, %)*
Eosinophil degranulation 9 (8) 75 (95) < 0.001
Eosinophil microabscess 2 (2) 56 (71) < 0.001
Basal zone hyperplasia 13 (12) 39 (51) < 0.001
Spongiosis 42 (38) 73 (92) < 0.001
Sub-epithelial stroma present 30 (27) 46 (58) < 0.001
Lamina propria fibrosis 3 (10) 18 (39) 0.004
*
Author Manuscript
Author Manuscript
Author Manuscript
Author Manuscript
Table 2
Diagnostic performance of the pull sign for EoE
Non-EoE controls (n = 121)
EoE (n = 83)
P value
Pull sign
Negative 119 (98) 20 (24) < 0.001
Author Manuscript
Author Manuscript
Author Manuscript
Author Manuscript
Table 3
Characteristics of EoE cases stratified by the esophageal pull sign
Pull sign - EoE cases (n = 20)
Pull sign + EoE cases (n = 63)
P value
Age at diagnosis (mean ± SD) 45.2 ± 16.5 35.4 ± 11.1 0.003
Male (n, %) 10 (50) 44 (70) 0.11
White (n, %) 19 (95) 58 (92) 0.66
Symptoms/EGD indication (n, %)
Dysphagia 19 (95) 61(97) 0.70
Heartburn 4 (20) 11 (17) 0.80
Abdominal pain 3 (15) 3 (5) 0.12
Nausea/vomiting 2 (10) 0 (0) 0.01
Any atopic disease 13 (65) 42 (69) 0.75
EGD findings at baseline (n, %)
Normal 2 (10) 1 (2) 0.08
Rings 12 (60) 51 (81) 0.06
Stricture 4 (20) 18 (29) 0.45
Narrowing 3 (15) 26 (41) 0.03
Furrows 12 (60) 59 (94) < 0.001
Crêpe-paper 0 (0) 9 (10) 0.15
White plaques/exudates 5 (25) 35 (56) 0.02
Decreased vascularity 5 (25) 44 (70) < 0.001
Dilation performed 7 (35) 22 (35) 0.99
Max size (mean mm ± SD) 15.9 ± 2.6 13.3 ± 3.3 0.07
Baseline max eosinophil count (mean ± SD) 100.7 ± 95.8 158.3 ± 124.1 0.06
Baseline histology findings (n, %)*
Eosinophil degranulation 16 (89) 59 (97) 0.18
Eosinophil microabscess 11 (61) 45 (74) 0.30
Basal zone hyperplasia 6 (35) 33 (55) 0.15
Spongiosis 15 (83) 58 (95) 0.10
Sub-epithelial stroma present 9 (50) 37 (61) 0.42
Lamina propria fibrosis 4 (44) 14 (38) 0.72
Treatment response (<15 eos) 10 (63) 28 (55) 0.59
*