Saving fuel, saving
costs
Impacts and reduction
potential for corporate
fleets
Bibliographical data:
This report is prepared by:
Sanne Aarnink, Huib van Essen, Arno Schroten, Matthijs Otten Delft, CE Delft, April 2015
Publication code: 15.4E62.23
Carbon dioxide / Standards / Vehicles / Freight transport / Market / Industry / Policy / Decision-making
FT : Options Client: Greenpeace.
CE publications are available fromwww.cedelft.eu
Further information on this study can be obtained from the contact person, Huib van Essen. © copyright, CE Delft, Delft
Saving fuel, saving costs
Impacts and reduction
potential for corporate fleets
CE Delft
Committed to the Environment
Through its independent research and consultancy work CE Delft is helping build a sustainable world. In the fields of energy, transport and resources our expertise is leading-edge. With our wealth of know-how on technologies, policies and economic issues we support government agencies, NGOs and industries in pursuit of structural change. For 35 years now, the skills and enthusiasm of CE Delft’s staff have been devoted to achieving this mission.
Executive summary
This report provides a comprehensive overview of how corporate fleets contribute to global oil consumption and greenhouse gas emissions. It also describes the wide range of practical solutions available to reduce the fuel use and emissions of both passenger and freight fleets. The study shows that there is a large potential of options for reducing fuel use, many with a payback time of several years.
Our reliance on oil is expensive and environmentally damaging
Global oil consumption is causing serious environmental problems, including air pollution and climate change. The hunt for new oil reserves is threatening to destroy sensitive areas of international importance like the Arctic. And our reliance on oil is creating economies that are dependent on foreign oil imports and vulnerable to fluctuating oil prices.Transport represents 64% of global oil demand. As a result, the sector is responsible for a large share – 23% – of global greenhouse gas (GHG) emissions. In the EU this share is lower (20%); in the US and Canada it is higher (28%). Transport emissions are dominated by road transport.
Almost half of domestic transport emissions are from corporate
fleets
A large proportion of a country’s road transport fleet will be made up of company vehicles, and a high percentage of new vehicle sales will be for corporate use. In the EU nearly all heavy goods vehicles (HGVs), most light commercial vehicles (LCVs) and about half of all new passenger cars are purchased by companies or other fleet owners.
These vehicles use a vast amount of fuel. Corporate fleets (company cars + HGVs + LCVs) in Europe spend nearly € 200 billion on fuel every year. The Total Cost of Ownership (TCO) is about € 600 billion per year.
In all, the EU’s entire corporate fleet is responsible for approximately 45% of emissions from road transport, and therefore 8% of total EU GHG emissions. Company cars are often sold on to private buyers after a few years and remain on the road for many more, so the influence of the corporate fleet on
emissions is greater than these figures suggest.
Cleaner corporate passenger fleets can significantly reduce costs
Many companies are searching for ways to bring down fuel use in order to save money and reduce environmental impact. Cutting fuel consumption means lower GHG emissions and less demand for oil. This in turn makes theextraction of alternative, controversial crude – from tar sands or the Arctic, for example – less profitable. Solutions to save fuel include:
Choosing more fuel efficient conventional cars. This has a significant potential for reducing GHG emissions against low or often even negative costs. Furthermore, choosing low resistance tyres for all cars is also a cost effective measure that saves fuel and money.
Adopting alternative powertrains, like full electric or plug-in hybrid cars, can reduce emissions even further. Investment costs are significantly higher, but are often offset by tax benefits or subsidies. In some countries, for vehicles with sufficiently high mileages, the total fuel savings are earned back within the vehicle’s lifetime. Unlike full electric, the driving
range of plug-in hybrids is not limited by battery capacity. They require additional arrangements to make sure that drivers charge as often as possible which is needed for harvesting the full fuel saving potential. Measures encouraging fuel efficient driving behaviour can also be
effective. As well as offering initial eco-driving courses to employees, it is essential to follow-up with monitoring, feedback and additional incentives, like a competition or financial bonus/malus scheme. Such an approach can improve fuel efficiency from 2 to more than 20% per year. Alongside saving fuel, eco-driving can also bring down accident rates and maintenance costs.
Teleworking and teleconferencing can save significant amounts of time and money spent on travel. Teleworking for one day a week reduces CO2
emissions by an average of 14% and can save € 2,000 per employee per year. A modal shift from cars to alternative transport modes in business and commuting travel can be stimulated in various ways, including financial incentives and travel card schemes. For example, offering multimodal business travel cards to employees can reduce company car kilometres by 7%.
Freight fleets can be cleaner, more efficient and cost less
There are many ways to reduce the fuel consumption and emissions of HGVs and LCVs. Just as for cars, using less petrol and diesel will save a company money and reduce its environmental impact. Solutions include:
Choosing the most fuel efficient conventional vehicle. In addition,
retrofitting vehicles, particularly trucks, can make them much more efficient. Emissions from HGVs can be reduced by 1-4% with a single measure to improve aerodynamics, by combing measures much higher reductions can be achieved and many measures have a relatively short payback time.
Purchasing alternative powertrains can reduce emissions even further. The first full electric and plug-in hybrid trucks have entered the market and electric vans are also available. Emissions from HGVs can be reduced by 8-30% with full hybridisation. Purchase costs are much higher than for conventional vehicles but, with significant reductions in fuel costs and subsidies in some countries, the difference in the TCO is decreasing and in some cases becoming (close to) competitive. Other alternatives are CNG or LNG drivetrains, which usually have lower investment costs but also lower emissions reduction potential (up to 20%).
Eco-driving programmes can again have a significant impact for freight vehicles. This kind of behaviour change can produce immediate fuel savings of up to 20% and long-term savings of 5-7%. Monitoring and feedback to drivers is crucial to maintain the positive effects. Various co-benefits can be expected, including lower accident rates and maintenance costs.
Reducing freight vehicle kilometres can also contribute to lower GHG emissions. This can be done by modal shift orincreasing the logistical efficiency. Real world examples show that improved logistical efficiency can reduce emissions by 4-20%. A shift to alternative transport modes (inland navigation or rail transport) can have even much higher GHG reduction potentials, but these are very case specific.
Contents
Contents
5
1
Introduction
7
1.1 Background 7
1.2 Objectives and scope of the project 8
1.3 Approach 8
1.4 Outline of the report 8
2
Greenhouse Gas Emissions and Costs of Corporate Fleets
9
2.1 Introduction 9
2.2 Contribution of transport to climate change 9
2.3 Contribution of corporate fleets to climate change 12
2.4 Costs of corporate fleets and their fuel use 13
3
Potential for Reducing Oil Consumption of Corporate Fleets
15
3.1 Introduction 15
3.2 Passenger transport 16
3.3 Freight transport 25
References
39
Annex A
Estimations company cars in the EU28
47
Annex B
Overview and explanation of technical measures for freight
1
Introduction
1.1
Background
Transport represents a relatively high share of global oil demand. This poses a threat to sensitive areas like the Arctic and causes serious environmental problems such as air pollution and global warming.
Anthropogenic GreenHouse Gas (GHG) emissions currently cause global warming of approximately 1˚C compared to the pre-industrial level, warming that is expected to increase to 2-4˚C in 2100 depending on the chosen reduction scenario (IPCC, 2014a). Politicians aim to limit the global
temperature increase to 2˚C to prevent dangerous climate change. In order to reach this goal, each country and every economic sector will have to
drastically reduce its GHG emissions.
The combustion of fossil fuels (oil, coal and gas) is the main contributor to global warming, in which emissions from oil consumption make up the largest share in the EU28 and USA/Canada (IPCC, 2014a; IEA, 2014a). The demand for crude oil and oil products has grown significantly over the last decades, mainly because of growing transport volumes and the dependency of transport on oil products (IEA, 2014b). Consequently, the transport sector now produces 23% of global GHG emissions (IEA, 2014a) and, therefore, the sector has an important role to play in reducing them.
Company cars and road freight transport are responsible for a large share of the transport sector’s oil consumption and emissions (SULTAN, 2012; EPA, 2014; Environment Canada, 2014). The direct impacts of the fuel used by company fleets is significant. In addition, a significant proportion of new vehicle sales are company cars, which has a large impact on new vehicle technologies and the fuel efficiency of future private fleets, affecting emissions in the longer term.
Many companies are searching for options to reduce the fuel consumption of their fleets and wider transport operations, in order to bring down costs and reduce environmental impact. This reduces GHG emissions and so is a positive development for climate change. It also reduces the demand for crude oil, making the extraction of alternative oil1, e.g. from tar sands or sensitive areas
like the Arctic, less profitable. The main reason for developed countries, such as the USA and Canada, to extract oil from such alternative oil sources is to reduce their dependence on other (unstable) countries for their crude oil supply. However, as became visible again recently, a lower demand for oil results in oversupply and lower oil prices. The counter side of low oil prices is an increase in the cost hurdle for a transition to alternative, low carbon energy sources (IPCC, 2014b).
In this context Greenpeace commissioned CE Delft to conduct an independent study on the potential and costs of reducing oil consumption (and therefore emissions) of corporate fleets.
1.2
Objectives and scope of the project
The overall objective of the study is to show what action can be taken by corporate fleet operators with the aim of greening fleets and reducing costs. In order to do so, the specific objectives of this study are to:
explore the contribution of corporate fleets to worldwide oil consumption and GHG emissions, and the Total Costs of Ownership (TCO) - fuel costs in particular – of corporate fleets;
summarise available (groups of) measures which fleet owners can adopt to reduce the fuel consumption of passenger transport (company car fleets in particular) and freight transport (van and truck fleets in particular), including the reduction potential, monetary savings, and other benefits of these measures.
As there are significant differences between regions and transport modes when considering the specific objectives mentioned above, the scope is mainly limited to:
The EU28 and partly to the USA and Canada. However, the second chapter, which provides a background on emissions from transport and corporate fleets, also covers the rest of the world.
Passenger cars, Light Commercial Vehicles (LCVs) andHeavy Goods Vehicles (HGVs). Buses, motorcycles, rail transport, inland navigation, aviation and maritime shipping are also included, except in Chapter 2.
1.3
Approach
For this study, an extensive literature review has been conducted.
The collected evidence is based on recent and fact-based sources, such as: Databases and reports from the International Energy Agency (IEA). Databases from the European Environment Agency (EEA) and from the EU
GHG transport: Routes from 2050 project (e.g. SULTAN).
National GHG inventories and other studies/data from the European Commission, EPA, and Environment Canada.
Reports from independent research organisations, such as Ricardo-AEA, TNO, the International Panel on Climate Change (IPCC) and CE Delft. Company data (for case studies throughout the report). The inclusion of
case studies ensures that literature findings, especially as regards the reduction potential and costs of measures, are in line with real-world experiences.
CE Delft is an independent research and consultancy company, and this is an independent study.
1.4
Outline of the report
The remainder of this report is structured around the specific objectives outlined in Section 1.2. In Chapter 2 the contribution of (road) transport, and corporate fleets in particular, to oil consumption and GHG emissions is explored. This chapter also provides cost estimates of corporate fleets and their fuel use. The measures that fleet owners can take to reduce fuel costs and emissions are described in Chapter 3. This is done for both corporate passenger and freight transport.
2
Greenhouse Gas Emissions and
Costs of Corporate Fleets
2.1
Introduction
In this chapter background information on the GHG emissions resulting from transport is provided in Section 2.2. Then Section 2.3 highlights the
contribution of corporate fleets to these transport GHG emissions and provides figures on the total (fuel) costs of corporate fleets.
2.2
Contribution of transport to climate change
Several human activities are causing anthropogenic GHG emissions.
The majority of these GHG emissions are CO2 emissions, which mainly result
from fossil fuel combustion (i.e. burning coal, gas and oil), industrial processes (combined 65%) and from deforestation (11%) (IPCC, 2014a). The remainder of the emitted GHGs (24%) comprise of non-CO2 emissions: fluorinated gases
(F-gases), methane (CH4) and nitrous oxide (N2O), which mainly result from
industrial processes and agricultural activities, for example due to the use of fertilisers (IEA, 2014a). Together, human activities caused global
GHG emissions of 49 Gt CO2 equivalent (CO2 eq.) in 2010 (IPCC, 2014a).
Figure 1 Types of anthropogenic GHG emissions and their shares in 2010 global emissions
Source: IPCC, 2014a.
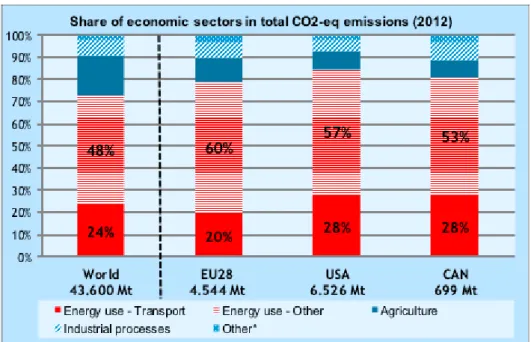
When allocating the total anthropogenic GHG emissions to different economic sectors, it becomes clear that global energy use is the main contributor (69% of global emissions, mainly consisting of CO2), of which energy used by transport is responsible for about one third (33%) of global energy-related GHG emissions (see Figure 2).
Figure 2 also shows that the proportion of emissions resulting from different sectors varies between countries and regions. This is caused by differences in economies, energy sources used, and so on. However, both in the European Union and in North America, total energy use causes the majority of GHG emissions: 80% in the EU28 and 85% in the US. Transport uses a significant amount of fossil fuel energy and so also produces significant emissions. The energy used for transport causes 20% of total GHG emissions in the EU, and 28% in Canada and the USA.
Figure 2 Share of economic sectors in GHG emissions in different regions in 2012
* Other: Emissions from solvent and other product use and waste.
Note: GHG emissions resulting from deforestation are excluded from this figure. Source: IPCC, 2014a (global emissions); IEA, 2014a (shares of sectors in global emissions);
EPA, 2014 (USA); EEA, 2014 (EU28); Environment Canada, 2014 (Canada).
Energy produced by fossil fuels, especially coal (44%) and oil (35%), contribute most to global GHG emissions resulting from energy use (see Figure 3).
When focusing on the EU28 and North American countries, shown in Figure 3, it becomes clear that oil consumption causes most emissions in these regions. The share of oil in total energy emissions ranges from 41 to 50%. This is because these (developed) countries use less coal (and more gas) in their energy production, and consume relatively more oil (e.g. in transport and industrial processes). Therefore, reducing emissions from oil consumption is particularly important for these countries.
Figure 3 Share of fossil fuels in energy emissions in different regions in 2012
Note: Figure only covers emissions from fuel combustion and excludes fugitive emissions. Source: IEA, 2014a.
However, as Figure 4 shows, global final oil consumption increased
significantly by 62% between 1973 and 2012 (IEA, 2014b), in particular due to an increase in oil consumption by transport. This has led to an increase in the total global demand for oil, which in turn has caused developed countries to become increasingly dependent on other countries. The combination of both factors has led to a search for alternatives, such as unconventional crudes (e.g. from tar sands) and/or conventional crudes from alternative locations (e.g. oil reserves in the Arctic).
Figure 4 Development of final oil consumption by sector
* Other: Agriculture, commercial/public services, residential, and non-specified other.
Note: Energy consumption of transport includes iinternational maritime and aviation bunkers. Source: IEA, 2014b.
Transport is the largest consumer of oil, representing 64% of global oil consumption. Transport is still almost fully dependent on oil products: 93% of the transport energy demand is met with oil products and only 4%, 2% and 1% with natural gas, biofuel and electricity, respectively (IEA, 2014b). It is crucial therefore to significantly reduce the oil consumption of transport in order to reduce the emissions of this sector.
2.3
Contribution of corporate fleets to climate change
As highlighted in the previous section, the transport sector is responsible for 23% of total global GHG emissions. Statistics from the IEA (2014a) show that road transport is by far the most significant contributor to these transport emissions, with a share of 72-81%. This increases to 84-95% when only taking into account domestic transport emissions (excluding international maritime and aviation transport). When focusing specifically on road transport emissions (Figure 5), it becomes clear that passenger cars, Light Commercial Vehicles (LCVs) and Heavy Goods Vehicles (HGVs) are responsible for almost all emissions from road transport (93-99%).
Figure 5 Contribution of different vehicles to total GHG emissions from road transport
* In the EU it concerns Light Commercial Vehicles (GVW <3,500 kg) and in the USA/CAN it concerns the category Light Duty Trucks (GVW < 8,500 lbs or 3,855 kg).
** CAN only presents emission for HDVs (HGVs + busses). The share of buses in the HDV emissions is estimated with the share in the USA.
Source: SULTAN, 2012 (EU28); EPA, 2014 (USA); Environment Canada, 2014 (CAN).
The dominance of cars, LCVs and HGVs indicates that corporate fleets represent a large share of total oil consumption and emissions from road transport. Corporate fleets include the entire LCV and HGV fleet, which already causes 33% (EU28) to 65% (CAN) of the road transport emissions. Corporate fleets also cover part of the emissions from the car fleet (i.e. the company cars/leased cars used by employees).
The share of company vs. private cars in the fleet or in the emissions are not known at the global level. However, the European Union (2010) has found that approximately 50% of new car sales in 18 investigated EU countries were company cars in 2008. More recent numbers for specific countries show similar shares (e.g. 54% in the UK (DfT, 2014) in 2013 and 57% in the Netherlands in 2012 (RAI, 2013)). As most company cars are eventually sold on to the private market, and then remain on the road until the end of their vehicle life, it is clear that the types of cars that companies buy has a large impact on the composition of car fleets more widely.
When combining this with some general statistics on the EU car fleet, it is estimated that the share of company cars in the EU28 fleet is 12%. When correcting this share for the fact that company cars have a higher mileage and higher efficiency (g/km) than an average car, it can be estimated that
company cars have a share of 18% in the total passenger car emissions of the EU28. The main assumptions made for this estimate can be found in Annex A. In Figure 6, these findings for passenger cars are combined with previous findings on HGVs and LCVs. As shown, the entire corporate fleet (company cars + HGVs + LCVs) in the EU28 caused approximately 45% of the total emissions from road transport in the EU28 (377 Mt CO2 eq.) in 2012, which is 8% of total
EU28 GHG emissions. As a large proportion of private cars are former company cars, the total influence of company cars on transport’s GHG emissions is even larger.
Figure 6 Contribution of corporate fleets to the road transport emissions of the EU28 in 2012
Source: CE Delft expert estimate based on EEA (2014); European Union (2010) & ACEA (2012).
2.4
Costs of corporate fleets and their fuel use
Due to the significant contribution of the EU28 corporate fleet to total GHG emissions, fleet owners can play an important role in tackling climate change by reducing the emissions of their corporate fleets. In addition, as road transport emissions rise and fall with fuel consumption, any reduction in emissions implies a reduction in fuel consumption. Considering that fuel costs are a significant share of the Total Cost of Ownership (TCO) of corporate fleets, reducing fuel consumption can result in significant monetary savings.
Relatively simple calculations can be used to generate a rough estimate of the total fuel costs of the EU28 corporate fleet in 2012. The emissions presented above can be converted into fuel consumed, which in turn can be multiplied with the average fuel price in 2012. Table 1 shows that corporate fleets consumed approximately 123 billion litres of fuel, at a total cost of almost € 200 billion.
Along with the total fuel costs of each corporate road transport mode, the Total Costs of Ownership (TCO) of the corporate fleet can also be estimated (with the known shares of fuel costs in TCOs). On average, fuel costs represented 32% of the TCO of corporate fleets (excl. wages) in 2012 and therefore the TCO of the corporate fleet were in the order of € 600 billion.
Table 1 Estimation of total emissions, fuel consumed, and costs of the EU28 corporate fleet in 2012 Corporate fleet in 2012 CO2 emissions Fuel consumed (mln litre) Fuel Costs (mln €)* TCO (mln €)** Share of fuel costs in TCO Company cars 97 33,500 53,200 204,600 26% LCVs 74 23,600 34,800 178,200 20% HGVs 206 65,700 96,700 187,500 34% Total of corporate fleets 377 122,800 184,700 570,300 32%
* The average fuel price (incl. taxes and duties) in the EU28 in 2012 was € 1,62/l for petrol and € 1,49/l for diesel. For cars, a share of approximately 70% petrol and 30% diesel has been assumed, shares of gas and biofuels were explicitly taken into account.
** TCO excluding wages, but inclusive of all costs of the vehicles itself; e.g. fuel, maintenance (incl. tyres), taxes, insurance, depreciation, etc.
Source: EEA, 2014b (fuel prices 2012), ACEA, 2012 (share petrol/diesel cars); GE Capital, 2013 (share fuel costs in TCO – passenger cars); ING, 2011 (share fuel costs in TCO - HGVs); MB Tech, 2010 (share fuel costs in TCO – LCVs).
There are several measures that policy makers and corporate fleet owners can adopt to reduce fuel costs (and hence GHG emissions). Policy makers in both the EU and in North America have adopted fuel economy/emission standards for newly sold LDVs for example. T&E (2011) has estimated that, by 2020, this will save approximately € 500 per year for an average car in the EU28
compared to a 2010 baseline vehicle (with 2011 fuel prices). When correcting these savings for the fact that company cars have a more efficient baseline vehicle and a higher annual mileage (see Annex A), the annual fuel cost savings of a company car are in the order of € 8502 per year by 2020. For the
entire corporate fleet, fuel cost savings would then be roughly € 28 billion. These numbers are, of course, highly dependent on future oil prices. Fleet owners also have a wide range of measures at their disposal to reduce the fuel consumption of their fleets, which is the topic of the next chapter.
2
€ 500 [fuel cost savings for an average car in the EU] * 0.93 [correction for a more fuel efficient baseline vehicle] * 1.83 [correction for annual mileage company car vs. average car] = € 850.
3
Potential for Reducing Oil
Consumption of Corporate Fleets
3.1
Introduction
The previous chapter showed the significant contribution of corporate fleets to total transport-related GHG emissions and the significant costs that result. There is a wide range of potential measures available that fleet owners can adopt to reduce the fuel consumption (and therefore GHG emissions) of their corporate fleets. In this chapter, a broad overview of these measures is presented. This shows the potential monetary costs and cost savings, GHG emission reduction potential, and other benefits (e.g. air pollution, health, corporate image), for each group of measures. The description of each
measure is illustrated with real life case studies, describing the experiences of companies that have already successfully implemented such measures.
The reduction potential of the various measures are expressed in GHG emission reduction rates. The relative reductions in fuel use are in most cases roughly the same. The direct CO2 emissions from burning a litre of petrol and diesel
are 2.38 and 2.63 kg of CO2. On a well-to-wheel (WTW) basis – so also taking
account of the emissions from oil extraction, refining and transport – these factors are on average 18 to 20% higher (JRC, 2014). For unconventional oils such as from tar sands or the Arctic, these WTW emission factors are higher again.
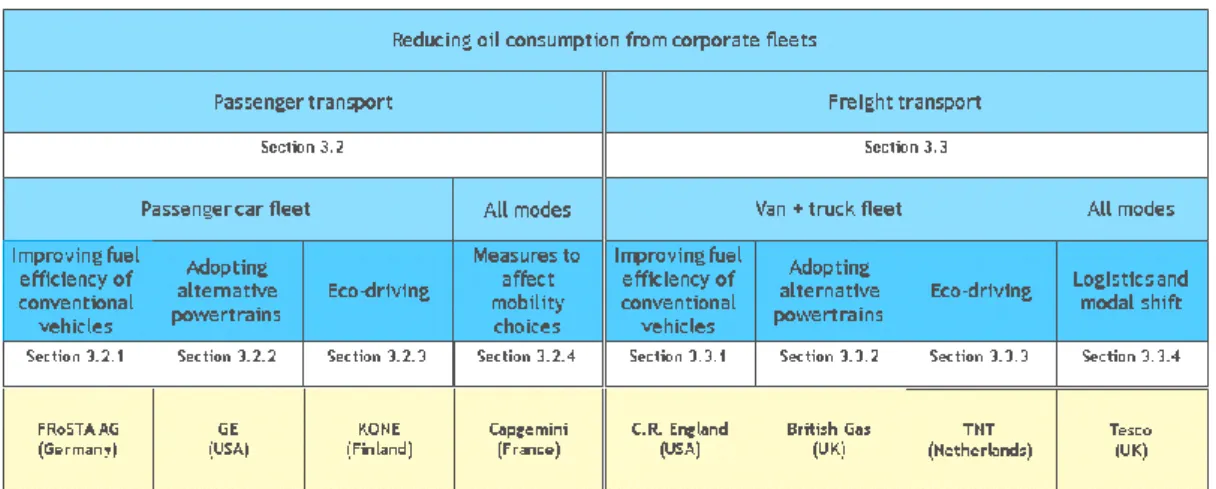
The structure of this chapter is shown graphically in Figure 7. The measures aimed at corporate passenger transport can be found in Section 3.2, while Section 3.3 summarises measures that target corporate freight transport.
3.2
Passenger transport
In this section, the main groups of measures for reducing the oil consumption of the passenger car fleet (Section 3.2.1, 3.2.2 and 3.2.3) and for reducing emissions from commuter and business travel (Section 3.2.4) are presented.
3.2.1
More fuel efficient conventional cars
Main benefit: Significant reduction of fuel consumption and GHG emissions at very low or often even negative costs.
Co-benefits: N/a.
Disadvantages: Real world reduction potential is dependent on the driving patterns and style of employees; it can be experienced as a negative measure by employees.
Lessons learned: To capture the reduction potential, fleet owners will have to implement measures to incentivise employees to choose more efficient cars.
Description of the measure and reduction potential
There is a wide range of technical measures available to reduce emissions from conventional cars. These include retrofitting existing cars, particularly choosing low-resistance tyres. For most other fuel saving options, (e.g. on powertrain or aerodynamics), purchasing policies that favour efficient vehicles are most effective, as retrofitting is not an option. Many countries, including the USA, Canada and the EU, have regulated the CO2 emissions of new cars.
This has resulted in significant fuel efficiency improvements and an increasing supply of (very) fuel efficient vehicles, including hybrid cars . According to CE Delft & TNO (2012), a reduction potential of 35% can be achieved by combining the most cost-effective measures, which costs (from a user perspective) -57 €/tonne CO2, i.e. it actually saves money. For petrol cars,
a reduction of 42% can be achieved when applying cost-effective technologies at a cost of -5 €/tonne CO23. In many countries, fuel efficient cars get tax
benefits, which further improves the cost/benefit ratio.
There are several measures that fleet owners can take to indirectly stimulate or enforce fuel saving technologies for their passenger car fleet. Examples are: Capping the CO2 emissions of new cars by setting a maximum gCO2/km for
employees when they choose a car (this information might be expressed in an energy label). This measure enforces a particular efficiency on the fleet.
Downsizing, where fleet owners enforce a maximum vehicle size. As smaller cars generally consume less fuel than larger ones, this also improves the efficiency of the fleet.
Providing a financial incentive for choosing a more fuel efficient car. Some companies provide a monthly bonus to employees choosing a more efficient car than the company average. This measure stimulates the use of more efficient cars.
Choosing low resistance tyres for all vehicles in the fleet.
Note that, except for the last one, these measures are designed to encourage employees to choose more efficient car types. There is increasing evidence that real world fuel use is much higher than energy labels might suggest and that the gap is increasing. Nevertheless, in almost every case, a lower emission factor on the test cycle corresponds to a lower real world fuel consumption, although the relative difference may be smaller than the energy label suggests.
3 Note that these estimates are sensitive to technological innovation, fuel prices, annual
To capture the full potential of technical measures in real-world driving conditions, other measures are recommended such as eco-driving (Section3.2.3 ) and measures to incentivise employees. An example is to calculate a fuel budget for each employee (e.g. an acceptable real-world fuel consumption per km for a particular car). Employees with higher costs than their budget allows would have to pay (part of) these additional costs, while employees spending less than their budget could receive (part of) these fuel savings in cash. This incentivises the employee to not only drive as efficiently as possible, but also to buy fuel at the cheapest petrol stations.
Monetary costs and savings
The net costs of the measures outlined above for enforcing/stimulating a more fuel efficient car fleet are generally very low or even negative. This is because more fuel efficient variants of a certain car model or tyre often have no or relatively low additional cost, which is quickly earned back by fuel savings. In the case of advanced technology like hybridisation, differences in
investment cost can be somewhat higher, but as the fuel savings are higher too, the payback time is usually still just a few years. The payback time varies with annual mileage and fuel and vehicle taxes. If a fleet manager provides financial incentives, the size of the incentive can be determined in such a way that the incentive paid is equal or lower than the fuel cost savings realised (GE Capital, 2013). Hence, this measure has mostly monetary savings, which result from reduced fuel consumption.
Some of the measures (e.g. setting CO2 limits) may result in reduced
employee benefits, as they are required to use smaller cars or have a more limited choice. This depends on the strictness of the limits that are set.
CASE STUDY: Green company car policy – FRoSTA AG Head Quarters: Germany
‘A market leading company for frozen ready meals in Germany with 69 company cars’
Implemented measure:
FRoSTA’s board of directors has implemented a green company car policy in 2012. With this policy, FRoSTA aims to reduce the average CO2 efficiency (in g/km) of all company cars by 4.5%. To realise this goal, the board has set mandatory CO2 limits for different groups of employees when they choose a new car, as shown in the table below. No exceptions are allowed (FRoSTA, 2013).
GroupGGggggrgrff
ff Group
gCO2/km Limit Annual reduction 2012 2013 2014 2015 2016
Board 175 162 150 139 128 7.50%
Management 162 151 141 132 123 6.50%
Key account managers 136 130 124 118 113 5.50%
Field work 109 107 105 103 101 3%
Entire fleet 137 131 125 119 114 4.50%
The remaining CO2 emissions of the fleet are compensated with a climate protection project, in which the same amount of emissions are saved by replacing coal stoves in China with biomass facilities (FRoSTA, 2013).
Results:
From August 2013 to August 2014, the company car fleet of FRoSTA consumed 14,000 litre of petrol and diesel less compared to 2012-2013, which is a fuel saving of more than 8% (FRoSTA, 2014). This can be translated in a WTW GHG emission reduction of 50 ton CO2 (assuming 50% petrol and 50% diesel).
FRoSTA’s fleet is now CO2 neutral (FRoSTA, 2013).
FRoSTA has won the ‘Deutschen Nachhaltigkeitspreises’ for having the cleanest fleet oft he 165 German companies participating in this initiative (DUH, 2014).
Costs
With average fuel costs of 1.47 €/l (incl. taxes) in the EU in 2014 (50%-50% petrol-diesel EEA, 2014b), the savings of 14,000 litre saved FRoSTA roughly € 20,500.
3.2.2
Adopting alternative powertrains for cars
Main benefit: Significant reduction of oil consumption, GHG emissions and air pollutants. Co-benefits: Noise reduction, lower maintenance costs, fiscal benefits for employees in some EU countries.
Disadvantages: Lower operational costs (e.g. lower fuel costs) only partially compensate the additional investment if no tax incentives/subsidies apply.
Lessons learned: To capture the full potential of the GHG emission reduction of electric vehicles, power generation should be decarbonised; in order to realise the full reduction potential of PHEVs, measures maximising the use of the electric drivetrain are highly recommended.
Description of the measure and reduction potential
Electric and semi-electric vehicles have rapidly gained popularity in corporate fleets as they significantly reduce oil consumption and GHG emissions, and contribute to the ‘green’ image of corporations. There are two main options: − Full electric vehicles (FEVs) have zero tailpipe emissions, but also have a
limited driving range (varying from 80 to 480 km depending on the model) (zerijden.nl, 2015).
− Semi-electric vehicles have both an electric motor and an internal combustion engine, and therefore can drive both on electricity and on petrol or diesel and therefore do not have range limitations. The electric range is significantly smaller (varying from 25 to 80 km, depending on the model) compared to a FEV (zerijden.nl, 2015). There are two main types available on the market: Plug-in hybrid Electric Vehicles (PHEVs)4 and Electric Range Extended Vehicles (E-REVs)5 (CE Delft, 2013). In the remainder of this section, PHEVs are used to refer to all semi-electric vehicles that can be charged from the grid6.
The WTWGHG reduction potential of FEVs/PHEVs is highly dependent on the assumed carbon intensity of the electricity mix. With the EU electricity mix in 2010 (150 g/MJ – AEA, 2012), the WTW GHG emission reduction potential of a FEV is roughly 50% compared to a diesel car (AEA, 2012; TNO & CE Delft, 2013). The emission savings from PHEVs are also highly dependent on the share of electricity in the total mileage, which in turn depends on the frequency of charging the PHEV. The GHG reduction potential varies from about 0 to almost 50%, where 10 or 95% of the mileage is driven in the electric mode,
respectively (TNO & CE Delft, 2013). This reduction potential will increase with the further decarbonisation of the electricity mix in a particular country. In order to actually realise a high GHG emission reduction potential with PHEVs, the fleet owner should take several measures. The two most important measures are the provision of sufficient charging infrastructure (both at the office and at employees’ homes), and the creation of (financial) incentives for good vehicle use (e.g. fees for a high fuel consumption, bonuses for low fuel
4
PHEVs combine an electric motor with an internal combustion engine (ICE). When the battery is empty, the car switches to a combination of the ICE and the electric motor
(CE Delft, 2013). 5
E-REVs always drive on the electric motor. When the battery is empty, the ICE provides power to the electric motor (CE Delft, 2013).
6 Semi-electric vehicles differ from regular hybrid vehicles as the battery of the latter cannot
consumption, internal competitions, etc.) (CE Delft, 2013). If such measures are not taken, the fleet owner risks that some PHEVs in the fleet will have higher emissions (and hence fuel costs) than necessary.
Further benefits from electric vehicles include reduced air pollutants. A FEV reduces WTW NOx emissions by 75% and WTW particulate matter emission from
the engine7 close to 100% (CE Delft et al., 2013). As for CO
2 reduction, the
exact percentages here also depend on the local power mix8, but in all cases
local emissions in urban areas are reduced significantly. Electric cars also create less noise than diesel or petrol cars (CE Delft & ICF, 2011). These benefits also apply to PHEVs, but only when the vehicle operates in the full electric mode. Finally, a disadvantage of electric vehicles is the relatively higher production and disposal GHG emissions (+52% to +60% compared to the production/disposal of a diesel car). This is related to the high energy use of battery production. This erodes some (but not all) of the aforementioned GHG emission savings (TNO & CE Delft, 2013). For a FEV, there is still a 32% reduction in emissions in comparison to a new diesel vehicle if the entire life cycle is considered (WTW emissions9 and vehicle production).
Other alternative energy carriers
There are several other alternative powertrains available for passenger cars, most notably CNG and in the longer term (> 2020) hydrogen. However, the GHG savings of CNG are relatively limited (15-20%) compared to FEVs/PHEVs and hydrogen (with potential WTW savings of 40% or more). Hydrogen driven cars (with fuel cells) are still in a pilot phase
CE Delft et al., 2013). Therefore, this section focusses on FEVs and PHEVs.
Monetary costs and savings
There are several differences in terms of the monetary costs and savings between electric and conventional cars. These are summarised below: Purchase costs of PHEVs and of FEVs in particular are significantly higher
compared to a conventional car. The price of a FEV (€ 31,500-42,500) was roughly twice as high compared to its diesel alternative, and the price of PHEVs (€ 26,500-28,000) was 60 to 70% higher (CE Delft & AEA-Ricardo, 2013; AEA, 2012). In more recent estimates the cost differences are in the same range or slightly lower. However, in many countries tax reductions or subsidies exist for electric vehicles, resulting in a much smaller difference in purchase price. Examples include reduced company car taxes in the Netherlands and vehicle subsidies in Ontario and Quebec. The level of these tax reductions and subsidies differ significantly between countries. In various cities electric vehicles are stimulated by local incentives, e.g. an exemption from parking fees. In addition, part of the remaining price difference can be earned back with two main categories of savings: Fuel cost savings of 40-60% as illustrated in Table 2.
Maintenance costs are 34% (FEV) and 17% (PHEV) lower compared to a diesel car (CE Delft & AEA-Ricardo, 2013).
The extent to which the Total Cost of Ownership (TCO) increases also depends on the lifetime of the car, residual value, annual mileage, and so on.
However, in most countries, these are higher for both PHEVs and FEVs in
7 The impact on the PM emissions from wear and tear (e.g. brakes and tyres, which are less
harmful than emissions from the engine) are not included in this study of CE Delft et al., 2013. These emissions are likely to be comparable or could even higher compared to those of diesel cars.
8
The numbers mentioned are based on the power mix in the Netherlands.
9
particular than for diesel cars (CE Delft & Ricardo-AEA, 2013). This difference is likely to reduce in the future, when battery and production costs decrease (ibid.). In some countries, the TCO of a FEV and/or PHEV is already
competitive, due to tax breaks and subsidies. This is the case in Norway for example, where the TCO of a BEV (Renault Zoe) is 9% lower with a lifetime of 4 years than the TCO of a comparable conventional car (Renault Clio) (ICCT, 2014). However in other countries, like Germany, the same calculation results in a TCO of the BEV that is 45% higher (ICCT, 2014). These examples illustrate the large differences between countries, and highlight the importance of fiscal incentives. In many countries online cost calculators are available for
comparing the TCO of a electric vehicle with a conventional one, in a specific situation (e.g. annual mileage)10.
Table 2 Fuel cost savings of electric cars compared to petrol cars Petrol (14 km/l) FEV (0.7 MJ/km) PHEV (30% of km electric) Petrol 14 km/l Electricity 0.7 MJ/km Average EU28 energy price in
2013-2014 (incl. taxes and duties)
1.54/l 0.2/kWh 1.54/l 0.2/kWh
Energy cost per km € 0.11 € 0.04 € 0.09
Energy cost compared to petrol 100% 36% 82%
Total fuel cost savings over lifetime* 0 € 7,000 € 2,000 * Assuming a company car lifetime of 4 years with 25,000 km/y.
Sources: AEA, 2012, adjusted by CE Delft(energy use per km); EEA, 2014b (average petrol price in the EU28 in 2014) ; EC, 2014 (average electricity price in the EU28 in 2013).
CASE STUDY: Commitment to buy 25.000 electric vehicles – GE Head Quarters: USA Technology, electronics and service multinational with a corporate fleet of 30.000 vehicles Implemented measure:
− GE has made the commitment to purchase 25,000 (semi-)electric vehicles between 2010 and
2015. The own corporate fleet comprises of 30,000 vehicles, of which at least half will be replaced with (semi-)electric vehicles by 2015. The remainder of the 25,000 purchased EVs will be deployed at some of GE’s fleet customers (GreenBiz.com, 2010).
− In May 2013, more than 4,000 electric vehicles had entered GE’s own fleet and in total about
11,000 alternatively powered vehicles were purchased (mainly plug-in hybrids). Since then the ambition has been broadened and now also includes natural gas powered vehicles. In addition, GE has created an EV learning centre and partners with many companies to realize its ambition (e.g. GM and Ford) (Greencarreport, 2013).
Results:
− GE: ‘By electrifying our own fleet, we will accelerate the adoption curve, drive scale, and move electric vehicles from anticipation to action’ (GreenBiz.com, 2010).
− With an average PHEV annual mileage of 25,000 km/per year and an average WTW GHG emission reduction of about 20%, the total WTW GHG emission reduction of 25,000 plug-in hybrid vehicles is about 25,000 ton of CO2 per year.
Costs
− Purchase cost of a Chevrolet Volt are € 42,000 (excl. tax credits) (zerijden.nl, 2015). However, with the large amount of vehicles purchased, GE may have received some a discount.
− Fuel cost savings per PHEV in the USA are roughly € 300 per year (25,000 km). With 25,000
10 E.g. http://driveclean.ca.gov/pev/Costs/Calculate_Your_Costs.php or tools provided by car
vehicles, fuel costs savings are roughly €7 million per year. With an average lifetime of 4 years for a company car, the fuel cost savings over the lifetime are € 1,200 per vehicle and € 30 million for 25,000 PHEVs.
3.2.3
Eco-driving with passenger cars
Main benefit: Reduces fuel consumption/CO2 emissions per kilometre by 5-25%.
Co-benefits: Lower number of accidents and associated costs, lower maintenance costs (e.g. fewer flat tyres), reduced noise.
Disadvantages: n/a.
Lessonslearned: Some sort of monitoring and feedback to employees is crucial to maintain the positive effects of the driving course.
Description of the measure and reduction potential
The use of fuel-efficient driving styles is a very popular measure to reduce the fuel consumption of corporate fleets. So-called ‘eco-driving’ can involve several driving techniques that drivers can use to improve the fuel economy of their car (CE Delft & TNO, 2012; AEA et al., 2010):
ensuring that the engine is used efficiently, for example by using a higher gear and limiting fast acceleration;
an anticipating driving style, minimising unnecessary braking;
minimising redundant energy use, e.g. by minimising idling and by limiting unnecessary energy use;
maintaining tyre pressure at specified levels. Most estimates available in literature indicate that
eco-driving techniques result in an average emission reduction of 10 to 15% (CE Delft, 2012).
The starting point for encouraging employees to adopt this eco-driving style is often to implement a driving course, which immediately results in significant fuel savings of 5 to 25% (CE Delft, 2009). However, it is well known that the savings reduce rapidly if driving courses are not regularly repeated and/or if no follow-up measures are taken by the company to motivate employees. In this case, the reduction potential that is obtained a year or more after the course has been estimated at 3% (CE Delft, 2009; TNO et al., 2006; McKinsey & Company, 2009).
With follow-up measures, corporate fleet owners can obtain a higher reduction potential in the longer term as well. Such follow-up measures are therefore equally as important (if not more) as the driving course itself. This can entail: Monitoring the performance of individual drivers and offering feedback,
e.g. in a periodic meeting, on the employees’ pay slips, by sending monthly reports to employees about their performance, and so on. Providing immediate feedback to drivers, e.g. by gear shift indicators (GSI)
or with smart phone apps. Kurani et al. (2013) measured a reduction in fuel consumption of approximately 2.8% due to the use of in-car feedback devices with a sample of 118 cars. TNO et al. (2006) estimates a slightly lower reduction potential of 1.5% (without feedback via smart phones at that time).
Internal eco-driving competitions. Companies increasingly publish the best performing drivers and/or reward the winning drivers with a prize. FLEAT performed a pilot with 6 corporate fleets (643 LDVs, including vans). The participating fleet owners implemented a driving course and some sort of monitoring and feedback. They measured a yearly reduction of 2.2 to 21.8% (FLEAT, 2014). One company did not implement the driving course itself, but
only the monitoring and feedback, and actually obtained a relatively large reduction, which shows the importance of implementing a follow-up system (ibid.).
Monetary costs and savings
The cost of applying the full eco-driving package outlined above include: The trainer fee for the driving course and loss in man hours when
employees are in training. TNO et al. (2006) estimated the costs of the driving course at € 50-100, which does not cover the loss in man hours. FLEAT (2010) does include this loss of man hours, which results in costs of € 300 to 1,000 per driver.
Purchase costs of ICT tools to assist drivers: € 15 for gear shift indicators (TNO et al., 2006); in many cars these are standard.
Setting up a monitoring and feedback system, and the FTEs spend on the actual execution the system. Costs are highly dependent on the complexity of the monitoring and feedback, wages, etc.
The monetary fuel savings of eco-driving can be calculated by multiplying the absolute reduction in fuel consumption (in l/km) with the fuel price and mileage of the company car. Other monetary benefits are cost reductions from
fewer accidents and lower maintenance, which are often not quantified in literature but can be significant. Despite the fact that only fuel cost savings are taken into account, most studies estimate that eco-driving has negative abatement costs (i.e. higher benefits in terms of fuel savings than costs), with abatement costs ranging from -€ 315 to € 15 per tonne (CE Delft, 2008, cited in CE Delft & TNO, 2012; TNO et al., 2006; FLEAT, 2010).
Finally, eco-driving can result in societal benefits, such as reducing traffic noise and improving road safety (which in turn positively impacts congestion, reduces medical costs and improves health) (CE Delft, 2012).
Eco-driving itself has no effect on air pollution.
CASE STUDY: ECO-SAFE DRIVING PROGRAM - KONE Head Quarters: Finland
A globally leading company in the elevator and escalator industry with a fleet of 14,000 vehicles
Implemented measure: An eco-safe driving programme to reduce fuel consumption/CO2 and
accidents with: A driving course.
Follow-up programme with an in-vehicle handbook with handy tips (e.g. closing windows to reduce drag, changing gears, and buckling up before leaving), posters throughout the office, and so on.
An internal competition (Jeu Roule Habile eco-safe driving challenge), which rewards the best driver with a prize (Knight, 2010; KONE, 2012).
Results
Reduction in accident rate: 13% in two years after implementation (Knight, 2010). Reduction in KONE’s fuel consumption/emissions of 576 cars and small vans monitored in
the FLEAT project (FLEAT, 2010):
• reduction in fuel consumption: 6% (from 7 l/100 km to 6.6 l/100 km);
• CO2 savings per year per vehicle: 400 kg/year/vehicle.
Costs
Costs numbers are not provided by KONE, but have been estimated in the FLEAT monitoring project mentioned above. They estimate a cost of € 300-1,000 for the driving course itself, loss of man hours, setting up a feedback scheme and for monitoring (FLEAT, 2010).
With average fuel costs of 1.47 €/l (incl. taxes) in the EU in 2014 (50%-50% petrol-diesel EEA, 2014b) and KONE’s annual mileage of nearly 36,000 km per car/van, the fuel savings of 6% per
year result in:
A payback period of 1.3 years (costs of € 300) to 4.4 years (costs of € 1,000).
Abatement costs of -€ 340 to € 55/tonne CO2 over the average lifetime of a company car (4 years).
3.2.4
Measures to affect mobility choices
Main benefit: Reduced CO2 emissions due to reduced travel resulting from teleworking and virtual meetings (one day a week reduces emissions by 14%), and a modal shift from cars to alternative modes.
Co-benefits: Less air pollutant and noise emissions, lower congestion levels, improved road safety, increased productivity of employees, and increased (perceived) quality of life of employees (only teleworking).
Disadvantages: Less human interaction (teleworking and virtual meetings), less control for managers (teleworking).
Lessons learned: Communication with employees and customers is crucial to successfully implement teleworking and the application of virtual meetings.
Description of the measure and reduction potential
Mobility choices can be affected by a broad range of measures. Two main categories can be distinguished that have been implemented by front runners:
reducing travel by implementing teleworking and virtual meetings and
stimulating modal shift, e.g. by providing business travel cards.
Over the last decade employees have increasingly been given the opportunity to telework. In the Netherlands, about 60% of companies currently provide this opportunity to employees, compared to 25% in 2003 (CBS, 2013).
In Europe, the share of companies providing teleworking opportunities is 60% on average, ranging from 80% (in Finland) to 37% (in Hungary).
Teleworking can be applied in several ways (Gareis, 2003). The most traditional type of teleworking is working from home. However, mobile working during business trips, at customers’ premises and/or at dedicated telework offices are other options. Successful implementation of teleworking requires intensive communication between the employer and employees and a more performance based management style (Peters en Den Dulk, 2003). Teleworking leads to a net reduction in CO2 emissions. The impact of reduction
in kilometres travelled can however be partly off-set by an increase in energy use at home (for heating and ICT) and some additional car use for
non-commuting reasons (rebound effect). Most recent evidence suggests that teleworking will result in a net reduction of CO2 emissions (CE Delft, 2012;
CE Delft et al., 2014). The application of teleworking for one day a week results in 14% reduction of CO2 emissions on average. This estimate does not
include second order (rebound) effects (e.g. people moving farther away from work if they have the opportunity to work at home).
Another option to reduce employees’ travel is to adopt virtual meetings
instead of face-to-face meetings, e.g. audio conferencing, video-conferencing or web-conferencing (CE Delft, 2012). Virtual meetings reduce the amount of business kilometres travelled, and hence reduce CO2 emissions. A small part of
this reduction will be eroded with the additional energy use from virtual meeting equipment. However, this effect is small: the net impact of replacing 20% of the face-to-face meetings by virtual meetings is a 17% reduction of meeting-related travel CO2 emissions (CE Delft et al., 2014).
A modal shift from cars to alternative transport modes in business and commuting travel can be stimulated by various means such as financial
incentives, facilities or, for example, offering multimodal business travel cards to employees. Most of these cards can also be used for payment in car parks or to easily book flex work stations. Business travel cards can particularly affect car use by company car owners. Currently, these people have no incentive to make use of other transport modes, as they can use their car for free while they have to pay for other modes. Evidence from Dutch cases show a reduction in car kilometres of 7% when this group is provided with a travel card
(CE Delft, 2010).
Monetary costs and savings
Teleworking results in various cost savings for companies, in particular lower travel costs and lower energy costs for heating, air conditioning and electricity in offices. In some cases it can also lead to cost savings from reducing the amount of office space and parking places needed. Last but not least, teleworking can have a positive impact on the productivity of employees (Ecofys, 2009; Sustel, 2004). This is due to lower absenteeism, longer working hours (which are not claimed), and higher concentration levels at home. CE Delft (2008) estimates that these cost savings can amount to more than € 2,000 per employee per year. Using virtual meetings has the same types of benefits as teleworking (CE Delft, 2012), but no cost estimates are available. Finally, both teleworking and virtual meetings can result in societal benefits (CE Delft, 2012). The reduction of vehicle kilometres results in a reduction of traffic noise, air pollution and congestion levels and may improve road safety. Additionally, teleworking may improve (experienced) quality of life and employees’ work-life balance (Sustel,2004).
Increased use of public transport or cycling can result in various cost savings for employers, such as higher productivity of employees (as employees
travelling with public transport have the opportunity to work while travelling) or, in the case of cycling, better health. Multimodal business travel cards can reduce administrative costs. The impacts on the mobility costs of measures aimed at modal shift are very case specific; no quantitative evidence is available on the overall cost savings that could be realised. Modal shifts can result in several societal benefits, e.g. less noise and air pollutant emissions, lower congestion levels and improved road safety.
CASE STUDY: NEW WAY OF WORKING - CAPGEMINI NL Head Quarters: France
A globally operating agency providing consultancy, technology and outsourcing services
Implemented measure:
The New Way of Working programme enables (some) employees of Capgemini Netherlands to work in a variety of locations at a time that suits them best. It consists of four pillars: Accommodation: in order to enable employees to work at the most efficient locations,
Capgemini provides them with all kinds of mobile devices and has opened small offices in several locations (Meeting Points), while scaling down the main premises of Capgemini. Mobility: travelling in the most efficient way by providing alternative lease concepts and
public transport cards.
Travel portal: online communication platform, showing where and when all employees are working and which facilities (e.g. conference rooms) are available.
Communication: intensive communication with the relevant employees and customers. Additionally, it requires managers to switch to a performance based management style.
Results
A reduction of vehicle kilometres and CO2 emissions in the range of 20–25% is expected. Less congestion, since commuting levels decrease.
Due to the higher level of flexibility provided to employees, average productivity is expected to improve. In addition, the work-life balance of employees will likely increase.
Costs
Implementation of the programme required substantial investments which have not been specified. However, there are also large financial benefits; by reducing the overall required office floor area by 30%, about € 5.5 million per year could be saved by Capgemini. The payback period of the programme is estimated at 1 to 1.5 years.
3.3
Freight transport
In this section, the main groups of measures for reducing the oil consumption of the LCV and HGV fleet (Section 3.3.1, 3.3.2 and 3.3.3) and for reducing emissions from freight transport operations in general (Section 3.3.4) are presented.
3.3.1
Improving the fuel efficiency of conventional vans and trucks
Main benefit: Reduction of fuel consumption and CO2 emissions. Potential varies between technologies, but ranges from 1-4% (e.g. a single measure for improving aerodynamics) to 8-30% (hybridisation).Co-benefits: Fewer flat tyres with tyre pressure monitoring technologies.
Disadvantages: Some technologies (e.g. hybridisation) require significant upfront investments. Lessons learned: Benefits of technologies differ between vehicle segments (e.g. aerodynamics has the largest benefits in regional/long haul transport, and hybridisation for lighter vehicles in urban conditions).
Description of the measure and reduction potential
There is a wide range of (retrofit) technologies available which companies can apply to reduce the fuel consumption of conventional vans and trucks.
Most technologies aim to reduce fuel consumption by reducing aerodynamic drag, rolling resistance, vehicle weight or by improving the efficiency of the engine and transmission. Table 3 summarises some of the measures available and their reduction potential. As the actual savings will differ between companies, due to different driving patterns and vehicles, the last column
specifies the mission profiles which are most appropriate for that particular technology. A more detailed description of these technologies can be found in Annex B.
Table 3 Overview of possible measures to increase energy efficiency of trucks
Type Technology Fuel savings (%) Segments*
Aerodynamics Trailer rear end (aft box) taper 1.5 - 3% U
Boat tail 2% - 4% R/L
Trailer (box) skirts 2% - 3% U
Cab side extension or gap fairings 0.5% - 1% U
Full gap fairing 1% - 2% R/L
Full skirts 2% - 3% R/L
Roof deflector 2% - 3% U
Streamlining 2% - 3% S
Light-weighting Material substitution 0.5% - 1.5% (C/S/M) 2% - 5% (U/R/L)
all
Tyres Automatic tyre inflation 0,5% R/L/C
Low rolling resistance tyres 1% - 2% (S) 2% - 4% (U/M)
S/U/M Next generation low rolling resistance
tyres (aluminium wheels)
9-12% U/R/L /C
Transmission and driveline
Aggressive shift logic & early lockup 0.5% - 1% (M) 1.5% -2.5% (S)
S/M
Increased transmission gears 2% - 4% S/M
Transmission friction reduction 1% - 1.5% All except U Engine
efficiency
Improved diesel engine** 9.5% - 12% U/M/R/ C
Improved diesel engine*** 14.5%-18% L
Improved diesel engine**** 4% -5% S
Hybridisation Dual-mode hybrid 20 - 30% (S)
8% - 12% (R/L)
S/R/L
Parallel (hydraulic) hybrid 25% - 35% U/M/C
U = Urban: GVW 7.5-14 t 40,000 km; S = Service, GVW 3, 5 t-7.5 t 35,000 km;
M = Municipal utility, GVW 7.5 t–28 t 25,000 km; R = Regional: GVW 7.5-16 t 60,000 km; L = Long haul: GVW 16 t-40> 130,000 km; C = Construction: GVW 7.5 t-40 t 50,000 km. ** Advanced 6-9 L 2020 engine (220 to 230 bar cylinder pressure, 3,000 bar fuel injection,
electrically boosted dual-stage variable geometry turbocharger, improved closed-loop engine controls, electric accessories, peak thermal efficiency 46 to 49%).
*** Advanced 11-15 l engine (240 bar cylinder pressure, 4,000 bar supercritical atomisation fuel injection, electrically boosted variable geometry turbocharger, improved closed loop engine controls, bottoming cycle, electric accessories, peak thermal efficiency 51 to 53%).
**** Improved diesel engine (higher fuel injection, increased cylinder pressure, improved controls & turbocharging).
The total combined reduction potential between 2015 and 2020 if all the measures shown in Table 3 were adopted is 35% for Service and Regional, 45% for Urban and Construction, and 40%11 for Long Haul Vehicles (TIAX, 2011). The
technical measures that can be applied to large vans are largely similar to those that can be applied to service vehicles, and those of small vans to the measures described for passenger cars (Section 3.2.1). Annex B summarises these measures for small, medium and large vans.
Monetary costs and savings
Table 4 shows the payback periods of the different technical measures covered by TIAX (2011). These payback periods are calculated with the annual mileages of the respective mission profile, the savings as shown in Table 3 , and the investment costs of each technology (see Annex B). As indicated with the green boxes (payback period of ≤ 3 years), many of the available technologies break even within 3 years and, from then on, these technologies start to reduce costs. Therefore, if the vehicle lifetime is longer than 3 years, these technologies have negative CO2 abatement costs (i.e. they save more money
than they cost).
The orange boxes (payback period of >3–7 years) and red boxes (payback period of ≥7 years) show technologies with longer break even periods, such as light-weighting (due to high investment costs and relatively small savings). Hybridisation also has moderate to long payback times, but also results in significant savings thereafter, especially for vehicles used in urban conditions.
11 The cumulative technical reduction potential of long haul freight as calculated in TIAX (2011)
Table 4 Payback periods of different technical measures (in years)
Technology Service* Urban* Municipal* Regional* Long
haul*
Construction*
Trailer rear end (aft box) taper 2
Boat tail 2 1
Trailer (box) skirts 3
Cab side extension or gap fairings 5
Full gap fairing 3 1
Full skirts 4 2
Roof deflector 2
Streamlining 0,5
Material substitution 8 8 14 5 2 6
Automatic tyre inflation (truck) 29 11 33
Automatic tyre inflation (trailer) 2 1
Low rolling resistance tyres 0,1 1
Next generation low rolling resistance tyres (aluminium wheels)
1 0,2 0,1 0,2
Aggressive shift logic & early lockup 0,3 1
Increased transmission gears 3 4
Transmission friction reduction 1 1
Improved diesel engine 4 3 2 2 1 2
Dual-mode hybrid 13 4 5
Parallel (hydraulic) hybrid 5 6 3
* Urban: GVW 7.5-14 t 40,000 km; Service, GVW 3.5 t-7.5 t 35,000 km; Municipal utility, GVW 7.5 t–28 t 25,000 km; Regional: GVW 7.5-16 t 60,000 km; Long haul: GVW 16 t-40> 130,000 km; Construction: GVW 7.5 t-40 t 50,000 km.
Note: TIAX (2011) has assumed a diesel price of 1.30 €/l in their estimates. Source: TIAX (2011).
CASE STUDY: Transporting the Smartway - C.R. England Head Quarters: USA “The largest temperature-controlled carrier in the world with 4,100 tractors and 6,200 trailers”
Implemented measure:
C.R. England participates in the SmartWay Transport Partner programme, a national public-private partnership in the USA that aims to reduce emissions of freight transport. The company has implemented many technical measures on all tractors and trailers: Aerodynamics:
on all tractors: aero kits, aluminium wheels, low rolling resistant tyres and wheel covers;
on all trailers: side skirts, low rolling resistant tyres with aluminium wheels to reduce weight.
Idling reduction: vehicles are equipped with economical bunk heaters that prevent idling for heat during winter, and with ambient sensors and computer programming which prevent idling if the temperature is between -6 to 20 degrees Fahrenheit.
Speed reduction: New trucks are set to 100 km/h.
Several operational measures: e.g. training, route optimisation, increasing loads, etc. (C.R. England, 2015).
Results
Due to the implementation of this wide range of technologies on conventional trucks (in addition to operational measures), C.R England has the highest rank possible (1 on a scale from 1-5) in the SmartWay database which shippers can use to select carriers (SmartWay, 2015).
Several awards for environmental excellence, e.g. SmartWay Excellence Award (2009, 2012) and the Food Logistics Top Green Supply Chain Partners Award (2013, 2012) (C.R. England, 2015).
In 2014, the g/mile performance of C.R. England was 1,550, while the average of all participating companies with refrigerated trucks (2,500+) was 1,686. The efficiency of C.R. England is therefore 8% better (SmartWay, 2015). When comparing this to the total average truck fleet of the USA this will be even higher, as the companies participating in SmartWay are likely to be more focused on GHG emissions compared to non-participants. In one year, C.R England has saved 0.07 MPG, which saved over 3 million litres of fuel in
total. This was due to rolling out trailer tails, wheel covers, fuel coaching and idle air technology (PRNewswire, 2014).
Costs
Investment costs are not publicly available. However, the saving of 0.07 MPG that resulted in a reduced fuel consumption of over 3 million litres of diesel, resulted in a cost saving of € 2.5 million (PRNewswire, 2014). A saving of 3 million litres would result in even higher fuel cost savings with EU28 average prices (1.40/l) of roughly € 4.2 million.
3.3.2
Adopting alternative powertrains for vans and trucks
Main benefit: Significant reduction of oil consumption, GHG emissions and air pollution. Co-benefits: Noise reduction, lower maintenance costs (EVs).
Disadvantages: Requires large upfront investments, which are only partially earned back with lower operational costs (e.g. lower energy costs, taxes, etc.).
Lessons learned: To capture the full potential of the GHG emission reduction of electric vehicles, power generation should be decarbonised.