Research Article
Research on Channel Model and Price Dispersion of E-Commerce
Market Based on Blockchain Technology
Qifeng Zhang
1and Fei Liu
1,21The Graduate School, Woosuk University, Wanju, Republic of Korea 2School of Economics, Hebei GEO University, Shijiazhuang 050030, China Correspondence should be addressed to Fei Liu; [email protected]
Received 10 September 2020; Revised 10 November 2020; Accepted 7 December 2020; Published 19 December 2020 Academic Editor: Hongju Cheng
Copyright © 2020 Qifeng Zhang and Fei Liu. This is an open access article distributed under the Creative Commons Attribution License, which permits unrestricted use, distribution, and reproduction in any medium, provided the original work is properly cited.
In order to accurately predict the channels and prices of the e-commerce market, and thereby control the cost of the e-commerce market, this paper studies the channel model and price dispersion of the e-commerce market from the perspective of suppliers. First, this paper establishes a model to analyze the price dispersion structure under different proportions of informed consumers and theoretically analyzes the objective reasons for continued price dispersion in the e-commerce market where search costs have fallen sharply. Then, this article combines theoretical models with empirical research to study the price and price differences between the two types of retailers. The results show that as consumers’interest in retailers changes, prices will also change, and the degree of price dispersion in the e-commerce market has not yet converged. This research result has a good predictive effect on the pricing and market estimation of the e-commerce market and can control the cost of e-commerce operation and improve the competitiveness of the e-commerce market.
1. Introduction
The chain business is to instantaneously distribute through smart contracts, omitting the intermediate retention and transfer links, and there is no Party B and Party C, all of which are Party A, realizing direct value distribution. In the early stage of the Internet economy, based on the grasp of the characteristics of network information technology, scholars have generally believed that the application of e-commerce will have the following impact on both the supply and demand sides of the market. On the one hand, the scope
of consumer search has been significantly expanded, and the
search cost has been significantly reduced, which will
pro-mote the rationalization of consumer behavior [1, 2]. On the other hand, retailers will face a wider range of interindus-try competition. Although direct price competition can be partially avoided by means of bundling sales, the aggravation of competition will still lead to a considerable decline in the pricing power of manufacturers and make prices more trans-parent, which is undoubtedly conducive to consumer pur-chases [3–5]. In short, the e-commerce market is more
efficient than the traditional offline trading market. This view
is generalized as the “frictionless trading hypothesis”of the
network economy and is widely accepted.
The reason why this paper studies the price dispersion in China’s e-commerce market is mainly based on the following three considerations [4, 5]: (1) Price dispersion is an
impor-tant index to test the efficiency of the market. Therefore,
the study of price dispersion in the e-commerce market is
the premise of investigating the efficiency of emerging
mar-kets and analyzing the behavior of manufacturers and con-sumers in the network economy [6]. It is of great
significance to understand the current economic situation
and future development. (2) Because it is very difficult to
obtain the selling price of the same commodity and different
merchants in the traditional market at the same time, most of the previous research on price dispersion is limited to theo-retical research, and there is little empirical analysis. (3) The existing relevant research and conclusions are made based on the markets of developed countries such as Europe
and the United States and are expanded and tested in China’s
market during the economic transition period [7, 8]. https://doi.org/10.1155/2020/8824754
Compared with the traditional market, it is easier for us to obtain cross-sectional price data of homogeneous goods, observable characteristic data of enterprises, and market
characteristic data of products from the website [9–12].
Based on the above background, this paper analyzes the price level and price dispersion in the e-commerce market from the empirical point of view and analyzes the factors
that affect the price level and price dispersion. This study
has important theoretical significance for testing the effi
-ciency of the network economy market and investigating its operation mechanism, and it also has extensive applica-tion value for the management and market competiapplica-tion of e-commerce enterprises.
The rest of this paper is organized as follows. Section 2
discusses the development foundation of China’s agriculture,
followed by agricultural industry chain reconstruction analy-sis and suggestions designed in Section 3. Relationship model and empirical research on network consumer behavior and e-commerce service quality is discussed in Section 4. Section 5 concludes the paper with a summary and future research directions.
2. The Development Trend of E-Commerce
2.1. The Development of E-Commerce Industry.In view of the unreasonable industrial structure and the inconsistency between supply and demand in macroeconomy, GeneralSecretary Xi Jinping proposed to push forward the“
supply-side structural reform”in macroeconomy in 2015. The policy
objective of supply-side structural reform is to start from the supply side of economic development, eliminate backward production capacity, reduce enterprise operating costs,
reduce excess inventory, and reduce excessive financial
leverage. The shortcomings of enterprise operation quality
and efficiency are completed, and a new mode of production
with“innovation, coordination, green, open, and sharing”as
the basic concept was established, to achieve the sustainable stability of the national economy and the transformation and upgrading of the development model [13–16].
The new concept of“supply-side structural reform”put
forward by the state is to start with the supply-side factors of production to promote economic development, strengthen the top-level design, change the unreasonable industrial structure, and take the road of economic development of innovation, development, optimization, and upgrading. Gen-eral Secretary Xi Jinping especially emphasized at the expert forum on economic situation held in July 2016 that the current national economic development has entered a new normal stage. Only by unswervingly pushing forward the structural reform on the supply side can we provide a new source of impetus for the healthy development of the national economy. Cross-border e-commerce is considered a strategic emerging industry under the new normal of China’s economy and the macrobackground of supply-side structural reform.
Cross-border e-commerce refers to the various trading
entities in different frontiers, each other through a
cross-border e-commerce platform to achieve transaction match-ing, the use of cross-border logistics network to transport
goods, through a variety of cross-border financial channels
to complete payment and settlement of goods, and ultimately conclude the transaction. Compared with the traditional international trade, cross-border e-commerce, as an Internet-based operation mode, has the characteristics of strong transaction convenience, information transparency,
and diversification. Cross-border e-commerce makes foreign
trade activities no longer limited by material, time and space, and other factors, breaking through the time and space con-straints of traditional foreign trade and gradually becoming a new way of international trade transactions. The supply-side structural reform puts forward that traditional industries should be transformed and upgraded and new and
advanta-geous industries should be created through scientific and
technological innovation [17, 18]. The combination of China’s traditional industries and cross-border e-business
can create a new operation mode of“Internet plus traditional
industries” and realize the integration of the real economy
and the network economy. The advantages of science and technology were utilized to break through the gap between consumption demand and production supply, get rid of the dependence on traditional sales channels, and establish a brand new production and manufacturing response model to balance supply and demand [19]. The e-business supply chain model can be represented in Figure 1. At the same time, cross-border e-commerce breaks through the space-time constraints faced by traditional international trade by virtue
of scientific and technological advantages, promotes global
economic integration, and brings new impacts to the world economic and trade pattern [20]. Cross-border e-commerce
can build a more open and diversified international
eco-nomic and trade cooperation environment, which is
condu-cive to China’s foreign export enterprises to avoid trade
barriers, expand export channels, and achieve optimal alloca-tion of resources in various countries, which is of great
importance to the realization of the national “one belt and
one way” strategy [21]. China’s cross-border e-commerce
export industry, as a product of the close combination of
tra-ditional industry and Internet economy, can effectively solve
the problem of mismatch between supply and demand in the foreign trade industry. The use of technological innovation for global consumers and suppliers of high-quality goods in
China to build an effective trading platform to help China’s
traditional industries effectively releases capacity worldwide
and removes inventory. The development of cross-border e-commerce conforms to the strategic plan of national supply-side reform and can provide a new grasp and impetus
for deepening the supply-side reform in thefield of foreign
trade [22].
2.2. The Development of Cross-Border E-Commerce. The policy objective of the supply-side structural reform is to eliminate backward production capacity, reduce operating costs, reduce excess inventory, reduce excessive leverage of
financial liabilities, and make up for the shortcomings of
enterprise operating quality and efficiency. Due to the change
of the international economic environment and the shrink-age of market demand, China’s traditional foreign trade export industry is facing the situation of excess production
capacity, product backlog, and difficult operation of
enter-prises. To deepen the supply-side reform in thefield of
for-eign trade, the cross-border e-commerce industry provides a good solution path and examples [23].
In recent years, China’s cross-border e-commerce
indus-try has sprung up; benefiting from scientific and
technologi-cal innovation and policy support, cross-border e-commerce can break through the constraints of the relatively weak international economic environment, develop rapidly, and
become a highlight and hot spot of China’s foreign trade
development. In the process of supply-side structural reform, cross-border e-commerce can balance the contradiction between supply and demand worldwide through a market mechanism, digest excess capacity, and optimize product structure. With the advantages of Internet information tech-nology, the foreign trade industry can realize the timely transmission of product supply and demand information through the cross-border e-commerce platform. Through the monitoring and analysis of the large-scale trading data, the foreign trade industry can timely screen and optimize
the allocation of resources,find out the elimination of
back-ward products, sort out the changing trend of product supply and demand structure, and provide a decision-making basis for the government to reduce production capacity, optimize the industrial layout, and implement all-round structural adjustment and transformation and upgrading [24]. Cross-border e-commerce provides more opportunities for small-and medium-sized enterprises to open up international mar-kets and provide consumers with more personalized prod-ucts and services [25]. The operation mode conforms to the changing trend of global consumption habits, breaks through the restrictions of time and geographical location, realizes the
accurate matching of supply and demand in the global scope, releases the potential purchasing power, and improves the utilization rate of resources, thus promoting the growth of
foreign trade volume and effectively eliminating the surplus
stock in the foreign trade industry [26]. For example, in the
“flash purchase”mode in cross-border e-commerce,
enter-prises with the advantages of scientific and technological
information accurately grasp consumer psychology and
behavior, in a specific time to focus on discount promotional
activities for specified brand goods, in a short period of time
to complete the cleaning of massive inventory. From the
“deleveraging” point of view, cross-border e-commerce
leverages the technological advantages of the Internet, open-ing up the cross-border demand and trade chain made in China, through high-frequency small fragmentation of the order operation mode to enhance trade volume, thereby
alle-viating thefinancial pressure of enterprises and reducing the
tendency of enterprises to use excessive leverage. From the
point of view of“cost reduction,”cross-border e-commerce
optimizes the supply and demand links between enterprises and consumers; reduces the information screening costs, transaction costs, and procurement costs of market
partici-pants; helps enterprises to improve operational efficiency;
and opens up international markets at a lower cost. From
the perspective of “complement board,” cross-border
e-commerce can use digital information technology to elimi-nate the widespread information mismatch, space-time mis-match, capacity mismis-match, and other situations in foreign trade enterprises and promote high-quality production
capacity “go out” by means of the Internet to promote
China’s foreign trade enterprises to expand the supply of
high-end products, in order to increase the added value of
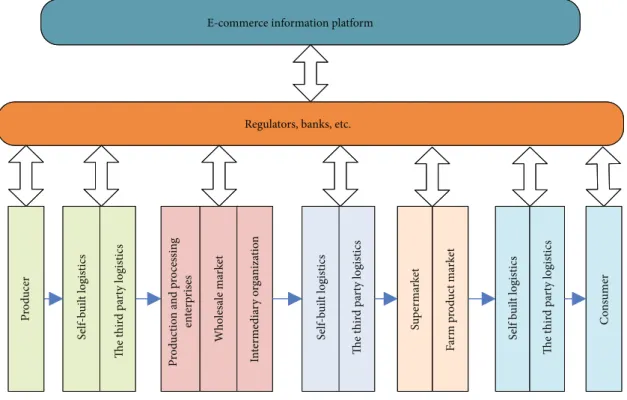
E-commerce information platform
P ro d ucer S elf-b uil t logistics The t hir d pa rt y logistics P ro d uc tio n a n d p ro ces sin g en ter p ri ses W h o les ale ma rk et In te rm edia ry o rga niza tio n C o n sumer S elf-b uil t logistics The t hir d pa rt y logistics Sup er m arke t F ar m p ro d uc t ma rk et S elf b u il t logistics The t hir d pa rt y logistics
Regulators, banks, etc.
products, to make up for the lack of high-end products made
in China’s short board for economic innovation and
develop-ment to open a new channel [27].
2.3. Cross-Border E-Commerce in the Context of Lateral Reform.China traditionally relies on resources, environment, demographic dividends, and other factors to accumulate for-eign trade development advantages, but the current supply-side structural reform more emphasizes improving the qual-ity of foreign trade supply from the system and innovation. The reform on the supply side of foreign trade emphasizes that the government should optimize the system supply and guarantee. The government should optimize the supply of public goods and services, reduce the institutional transac-tion costs of enterprises, and provide a driving force for cross-border e-commerce exports. At present, the develop-ment of cross-border e-commerce export has entered the stage of innovation-driven [28]. Enterprise performance
must rely on all kinds of innovation, especially scientific
and technological innovation to promote and achieve foreign trade economic growth. Innovation drive can give full play to the endogenous growth advantage of foreign trade and break the predicament of foreign trade from the supply side. Enter-prises use the Internet platform to optimize social resources to carry out cross-border e-commerce; can stimulate the
market entrepreneurs to innovate, through an innovative management mode, product design, and marketing services to drive upstream and downstream industrial chain to
improve quality; cultivate brand; and tap China’s foreign
trade supply potential to create new supply. It is noteworthy that in addition to improving the quality of supply, cross-border e-commerce has also promoted the development of cross-border logistics, overseas warehousing, online pay-ment, network marketing, and other emerging industries, changing the operation structure of traditional industries and realizing the transformation and upgrading of foreign
trade. Cross-border e-commerce can also serve the country’s
“one belt and one road”strategic initiatives and build a new
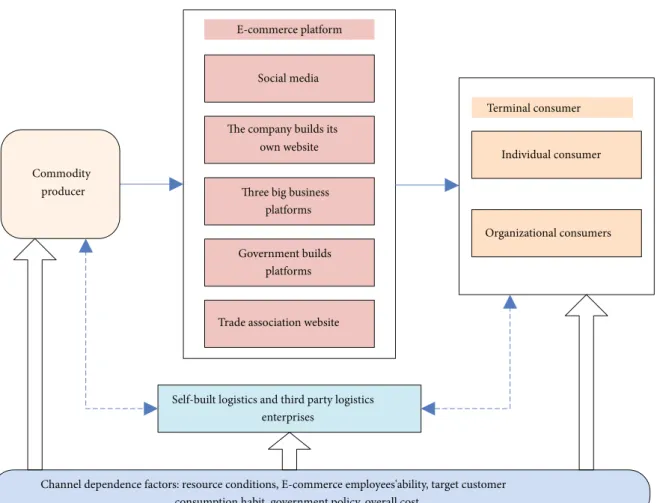
focus on the supply-side reform and expand the supply-side reform path and channel. Product producers establish business links with end-users through e-commerce plat-forms, such as social media, e-commerce companies, and industry websites. With the support of modern logistics, they have greatly met the demand of both suppliers and
buyers for “selling” and “buying.” Focusing on the
struc-tural elements of producers, consumers, e-commerce plat-forms, and logistics enterprises in the product upstream
channel, five channels for developing product upstream
e-commerce are constructed; the channel pattern chart is shown in Figure 2.
Commodity producer
Social media
The company builds its own website
Three big business platforms
Government builds platforms
Trade association website
Individual consumer
Organizational consumers
Self-built logistics and third party logistics enterprises
Channel dependence factors: resource conditions, E-commerce employees'ability, target customer consumption habit, government policy, overall cost
E-commerce platform
Terminal consumer
In an economic environment with obvious personal needs, cross-border e-commerce orders show a trend of high frequency and fragmentation. The scattered orders
reflect the diversification and individualization of current
consumer needs. The key to maintaining a competitive advantage in cross-border e-commerce lies in the
integra-tion of supply chain costs, flexible production
arrange-ments, scientific inventory management, and ensured
effectiveflow of funds, thereby reducing thefinancial risks
faced by foreign trade companies through accurate supply. For demand matching, secondly, the use of social network platforms to carry out online marketing is a new trend for foreign trade companies to broaden the export channels of cross-border e-commerce, and cross-border e-commerce with the help of social platforms can play a gathering role. Third, the global promotion of mobile Internet and smart-phones has promoted the intelligence and mobility of cross-border e-commerce operations. The mobile APP cli-ent of cross-border e-commerce can make it easy for con-sumers to shop, and it can also enable foreign trade companies to timely grasp supply and demand information and collect valuable data. Fourth, by improving the infra-structure of cross-border payment, overseas warehousing, and logistics, the cost of cross-border e-commerce can be controlled.
3. Theoretical Analysis of Discrete
Structure of Price
Suppose there are two retailers selling the same commodity in a product market. One retailer has a high degree of sumer concern; the other has a low degree of consumer
con-cern. Suppose that the unit marginal cost isC, and the reserve
price is R, and R>C in the market; suppose that the
con-sumer buys a unit product at most.
Not only the difference of consumers themselves will lead
to different search costs, but the difference of retailers will
also lead to the difference in search costs. Assuming that
the cost of searching unknown retailers is not less than that
of searching famous retailers, the difference of search costs
between retailers will lead to different degrees of concern of
consumers. In order to reflect the different levels of concern
that businesses receive, assume that all consumers are
con-cerned about retailer 1; only some people can focus on retailer 2 through more patient search. Assuming that the number of retailers who can search for both types of retailers
is A, Areflects market transparency and the proportion of
informed consumers.
In addition, the difference in search costs between
retailers will lead to brand sensitivity (e.g., consumers may think that retailers without reputation are uncertain about the quality of the products they sell). Even if they sell homo-geneous products, consumers are willing to pay a certain fee
for famous retailers. Suppose that consumers have different
brand preferences for retailers; that is, some consumers are reluctant to pay for the brand, while others are willing to buy from famous-brand retailers because they are more risk-averse or because of higher search costs. The same
distri-bution from 0 to Zreflects the sensitivity of consumers to
retailers’brands.
In Figure 3(a), when the price of retailer 1 is lower than that of retailer 2, retailer 1 will win all consumers; when the price of retailer 1 is much higher than that of retailer 2 and the amount exceeds the maximum possible brand payment, retailer 1 will lose all consumers who know retailer 2. When the price of retailer 1 is higher than that of retailer 2, but it does not exceed the consumer’s brand willingness to pay, retailer 1 can get all consumers who do not know retailer 2, and also those who have high brand payment. For retailer 2, as shown in Figure 3(b), if the set price is much lower than that of retailer 1 and the spread exceeds the consumer’s max-imum brand willingness to pay, retailer 2 can get all the con-sumers who know it. When the price of retailer 2 is lower
than that of retailer 1, but the price difference between
retailer 2 and retailer 1 does not exceed the consumer’s
max-imum brand willingness to pay, the market share decreases with the increase of the price until it loses all the market share at the same price as retailer 1. The pricing of retailers is shown in Figure 3.
Assuming that retailers cannot distinguish consumers
with different levels of concern and brand sensitivity and
implement price discrimination strategy, refer to the Lal (1990) or Raju et al. (1990) demand model. The given price
ðp1,p2Þand exogenous variables (a,z,r, andc), the demand
ðq1,q2Þ, and profitðπ1,π2Þ functions of two retailers are
expressed as follows:
O p r
2 p2+ z p1
1
1-𝛼
(a) Retailer 1 pricing
O 𝛼 p2 p1 p1 – z (b) Retailer 2 pricing
q1= 1, p1≤p2, 1−α+α⋅ p2+z−p1 z , p2≤p1≤p2+z, 1−α, p2+z≤p1≤r, 8 > > > < > > > : π1= p1−c, p1≤p2, 1−α+α⋅p2+z−p1 z ⋅ðp1−cÞ, p2≤p1≤p2+z, 1−α ð Þðp1−cÞ, p2+z≤p1≤r, 8 > > > < > > > : q2= α, p2≤p1‐z, α⋅ p1−p2 z , p1‐z≤p2≤p1, 0, p1≤p2≤r, 8 > > > < > > > : π2= αðp2−cÞ, p2≤p1‐z, α⋅p1−p2 z ⋅ðp2−cÞ, p1−z≤p2≤p1, 0, p1≤p2≤r: 8 > > > < > > > : ð1Þ
According to the optimization problem and
Kuhn-Tucker sufficient and necessary conditions, it is known that
retailer 1 and retailer 2 only exist pure strategy Nash equilib-rium in three cases. For an interval in which there is no pure Nash equilibrium, there is at least one mixed strategy
equilib-rium. According to the necessary and sufficient conditions of
mixed strategy equilibrium, two (continuous) distribution
functionsðF1ðp1Þ,F2ðp2ÞÞare obtained to represent the
equi-librium of a mixed strategy, such as the following formulas
(2) and (3). These two distribution functions reflect the
prob-ability that the retailer’s price is equal to or below a certain
value:
In which,ðF1ðp1Þ,F2ðp2ÞÞcan be used to test a retailer’s
price behavior under various conditions by reflecting the
com-plex price behavior characteristics, pure strategy, and Nash equilibrium of mixed strategy. It can be seen clearly that brand
sensitivity affects the distribution of the price level. In order to
study the variation of market price dispersion with the propor-tion of informed consumers, the equilibrium distribupropor-tion function of mixed strategy formulas (2) and (3) are given
z= 0, at which timep= maxfc,ð1−αÞr+αcg:
F1ð Þp1 = 1ðf1ð Þp1 = 1ð −αÞÞ, p1=r, F1ð Þp1 = 1− ðr−pcÞð1−αÞ 1−c ð Þ , p1∈½ð1−αÞr+αc,r, F1ð Þp1 = 0, p1∈½0, 1ð −αÞr+αc, 8 > > > > < > > > > : ð5Þ F2ð Þp2 = 1ðf2ð Þp2 = 0Þ, p2=r, F2ð Þp2 = 1 α − r−c ð Þð1−αÞ p2−c ð Þα , p2∈½ð1−αÞr+αc,r, F2ð Þp2 = 0, p2∈½0, 1ð −αÞr+αc: 8 > > > > < > > > > : 6Þ
The assumption that consumer brand sensitivity z= 0
means that consumers in the market are reluctant to pay
for the retailer’s brand. This is an extreme scenario, but
because the various search tools provided by the Internet can constantly provide product/service quality information for the retailers covered, it is possible to reduce the uncer-tainty of online consumers buying goods from nonbranded retailers. Under this assumption, we can independently F1ð Þr = 1, p2−c ð Þαð1−F1ðP2+zÞÞ+ ðp2+z p2 p2−c ð Þαp1−p2 z f1ð Þp1 dp1=ðp−z−cÞα, ∀p2∈½p−z,r−z, F1ð Þp = 0, 8 > > > > < > > > > : ð2Þ F2ðr‐ZÞ= 1, p1−c ð Þð1−αÞF2ðP1−zÞ+ ðp1 p1−z p1−c ð Þ⋅ 1−α+αp2+z−p1 z h i ⋅f2ð Þp2 dp2+ðp1−cÞð1−F2ð Þp1 Þ=ðr−cÞð1−αÞ, ∀p1∈½p,r, F2ðp−zÞ= 0, 8 > > > > < > > > > : p1=½p,r, p2=½p−z,r−z, ð3Þ p= max c+ ffiffiffiffiffiffiffiffiffiffiffiffiffiffiffiffiffiffiffiffiffiffiffiffiffiffiffiffiffiffi az rð −cÞð1−aÞ p a , 1ð −αÞr+ac ( ) : ð4Þ
analyze the price dispersion of consumers under different
attentionα. The variance of p1 and p2 difference is further
calculated:
Varðp1−p2Þ= Varð Þp1 + Varð Þp2 =ðr−cÞ2ð1−αÞ 2α+ 2 1ð −αÞln 1ð −αÞ −ð1−αÞ 1 + 1 a2 ln2ð1−αÞ+ 1: ð7Þ
The variance of the price difference set by the two
retailers is a measure of the dispersion of the two retail
prices. Looking at the right side as a function of α, you
can see that the size of R and C only changes the size of
the function, not the shape of the function. Let us set up
c= 0,r= 1, get the following Eq. (8). The convergence and
expansion of price divergence are shown in Figure 4:
Varðp1−p2Þ= 1ð −αÞ 2α+ 2 1ð −αÞln 1ð −αÞ −ð1−αÞ 1 + 1 a2 ln2ð1−αÞ+ 1 : ð8Þ
It can be seen that the price dispersion will increase with the increase of consumer attention until the consumer
attention reaches a very high value (α≈0:83); that is, when
all consumers become informed consumers, the price dis-persion reaches the maximum value, and then, the increase of consumer attention sharply reduces to the marginal cost. The conclusion seems counterintuitive, but it properly explains the objective phenomenon that the price disper-sion of the e-commerce market does not converge or even expand, which is consistent with the international research results in recent years. With the popularization and use of information technology such as search engines, price dis-persion still exists when the cost of information search is
significantly reduced and more consumers become insiders:
α= 1in formula (5) and (6) can be obtained:
F1ð Þc =F2ð Þc = 1: ð9Þ
That is, when the consumer brand is insensitive (z= 0),
and the market information is sufficient, all consumers know
all the retailers (α= 1), then achieve complete competition in
the Bertand model; the retailer must price at marginal costc;
otherwise, there is no consumer. On the other hand,
con-sumer brand insensitivity (z= 0) and full market information
(α= 1) are necessary conditions for pure price competition.
As long as consumers have brand loyalty, or not all
con-sumers know all retailers, enterprises will make extra profits.
0.02 0.04 0.06 0.08 0.1 0.12 0.11 0.21 0.31 0.41 0.51 0.61 0.71 0.81 0.91 Proportion of informed consumers
0
Pr
ice va
ria
nce
Figure4: Convergence and expansion of price dispersion.
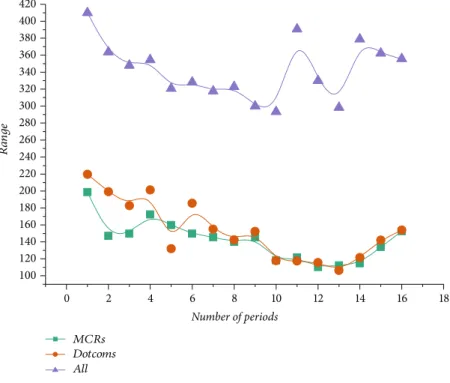
Table1: Range comparison table.
Number of periods MCRs Dotcoms All
1 198.55 219.67 409.96 2 146.98 199.14 363.57 3 149.69 182.78 347.86 4 172.31 201.21 354.44 5 159.778 131.88 320.73 6 149.78 185.47 328.19 7 145.449 154.96 317.47 8 139.98 142.39 322.83 9 145.37 152.39 299.88 10 118.16 117.98 293.24 11 121.55 117.42 390.65 12 110.21 115.65 329.88 13 112.21 106.38 298.32 14 114.78 121.58 378.88 15 133.98 141.93 362.26 16 152.59 153.87 355.63
In summary, price dispersion will persist if the two
con-ditionsz= 0andα= 1hold for different levels of consumer
concern or consumers are sensitive to the seller’s brand.
4. Empirical Analysis of Retailer Price
Dispersion in E-Commerce Market
Based on the grasp of the characteristics of network
informa-tion technology, the “frictionless transaction hypothesis” of
the network economy has been widely accepted by scholars.
E-commerce will effectively reduce the market price and price
deviation. In addition, more and more traditional offline
retailers recognize the importance of online channels and
begin to dabble in online sales, which can be called
“multichan-nel retailers” (MCRs) or “pure online retailers” (Dotcoms).
Therefore, this paper adopts the method of combining the the-oretical model with empirical research to study the price and price dispersion between the above two types of retailers and compares whether the price and price deviation of the same
product between different online retailers in the e-commerce
environment are significantly reduced.
4.1. Statistical Analysis of the Extreme Price Difference of Commodities.The definition of the extreme difference is the
difference between the maximum and minimum values of
goods. In this paper, the price range is “the difference
between the maximum and the minimum of the same
com-modity price of different retailers of the same type at the same
time.”The expression is as follows:
R= Maximum value−Minimum value: ð10Þ
Based on the statistical analysis of the data, it is concluded
that the difference between the two types of retailers’sales of
all mobile phone products varies with time as shown in Table 1.
According to the above table, the time trend chart for plotting range variation is shown in Figure 5.
The range comparison table and the extreme time trend table of the two types of retailers can be obtained; the average price range for Dotcoms retailers is 152.79, while the average price range for MCR retailers is 141.96. Dotcoms retailers
have greater pricefluctuations than MCR retailers. The price
ranges of both retailers have shown a downward trend. The
0 2 4 6 8 10 12 14 16 18 100 120 140 160 180 200 220 240 260 280 300 320 340 360 380 400 420 Number of periods R ange MCRs Dotcoms All
Figure5: Extreme time trend chart.
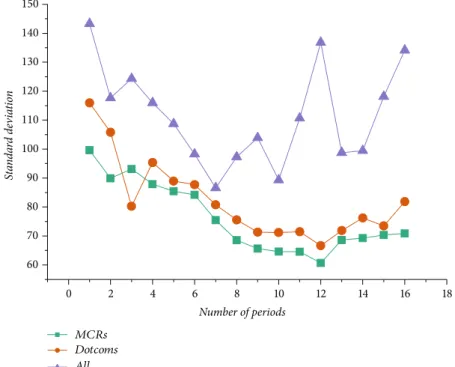
Table2: Standard deviation comparison table.
Number of periods MCRs Dotcoms All
1 99.64 115.98 143.28 2 89.88 105.83 117.65 3 93.12 80.21 124.32 4 87.87 95.38 115.98 5 85.43 88.96 108.69 6 84.24 87.72 98.25 7 75.48 80.77 86.59 8 68.54 75.57 97.28 9 65.62 71.35 103.89 10 64.62 71.21 89.31 11 64.58 71.48 110.66 12 60.64 66.68 136.82 13 68.61 71.86 98.76 14 69.22 76.21 99.43 15 70.35 73.47 118.12 16 70.83 81.87 134.12
reason is that with the advent of the peak sales season,
retailers have shown higher efficiency in their pricing
strate-gies, so the price range between the two types of retailers tends to shrink.
4.2. Statistical Analysis of Commodity Price Standard Deviation. The price standard deviation is the square root
of the ratio of the sum of squares of the difference between
the price and the mean value of the price (n−1):
SD = ffiffiffiffiffiffiffiffiffiffiffiffiffiffiffiffiffiffiffiffiffiffiffiffiffiffiffiffiffiffiffiffiffi 1 n−1〠 n i=1 xi−x ð Þ2 s : ð11Þ
The trend of price deviation of all two types of retailers is shown in Table 2.
The trend chart of the change in price standard deviation is shown in Figure 6.
It can be seen from Table 2 and Figure 6, in addition to the third issue, that the price standard deviation of Dotcoms is higher than that of MCRs. The average price standard deviation of Dotcoms is 82.16, while that of MCRs is 76.17.
This is consistent with the conclusion of extreme difference
analysis. The price dispersion of Dotcoms is greater than that of MCRs.
In the early period, the price standard deviation between
the two is obviously different, and in the sixth and seventh
periods, the price standard deviation of the two is consistent;
the difference is not significant, which also reflects the“
holi-day effect”of retailer pricing.
4.3. Statistical Analysis of Price Dispersion Rate. Generally speaking, the discrete rate is the ratio of the standard
devia-tion to the mean. Therefore, in this paper, the price discrete rate refers to the degree of deviation of the price distribution of the same commodity relative to a central price distribution in the market. This paper adopts the ratio of price standard deviation to average price to measure the price dispersion rate. That is,
DR = SD average Priceð Þ: ð12Þ 0 2 4 6 8 10 12 14 16 18 60 70 80 90 100 110 120 130 140 150 St an da rd de vi at io n Number of periods MCRs Dotcoms All
Figure6: Price standard deviation time trend chart.
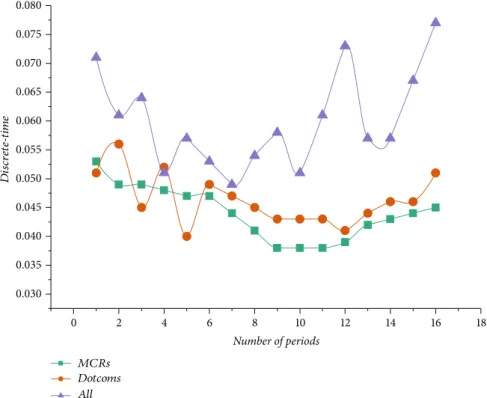
Table3: Price dispersion rate comparison table.
Number of periods MCRs Dotcoms All
1 0.053 0.051 0.071 2 0.049 0.056 0.061 3 0.049 0.045 0.064 4 0.048 0.052 0.051 5 0.047 0.04 0.057 6 0.047 0.049 0.053 7 0.044 0.047 0.049 8 0.041 0.045 0.054 9 0.038 0.043 0.058 10 0.038 0.043 0.051 11 0.038 0.043 0.061 12 0.039 0.041 0.073 13 0.042 0.044 0.057 14 0.043 0.046 0.057 15 0.044 0.046 0.067 16 0.045 0.051 0.077
The price dispersion rate of all two types of retailers vary-ing with time is shown in Table 3.
The trend of the price dispersion rate is shown in Figure 7.
It can be seen from Table 3 and Figure 7 that the average price dispersion rate of Dotcoms retailers is 0.046, and that of MCR retailers is 0.043. Dotcoms retailers are higher than MCR retailers. The trend of the price dispersion rate of the two retailers is roughly the same as the trend of the price standard deviation. By comparing and analyzing the price range, standard deviation, and price dispersion rate of all mobile phone products sold by the two retailers, we can draw the following conclusions: Dotcoms retailer’s extreme devia-tion, standard deviadevia-tion, and dispersion rate average are higher than MCR retail. In most periods, the three trends of the two types of sellers are almost the same.
5. Conclusion
The results show that the price dispersion of the e-commerce market is not convergent, and the price dispersion is not a temporary phenomenon of the immature e-commerce mar-ket. It will be universal and persistent: as long as consumers are brand sensitive or not all consumers are concerned about
all retailers, prices vary between retailers with different levels
of attention. When using the price dispersion index to
mea-sure the market efficiency, it is necessary to determine the
proportion of informed consumers in the market, because when the proportion of informed consumers is lower than a fairly high proportion, the price dispersion will actually increase with the proportion of informed consumers. Price dispersion is a common phenomenon in the products studied
in this paper. The price dispersion of cosmetics, audiovisual products, gifts, and books is greater. The characteristics of
retailers have a significant impact on prices. The study shows
that there are three types of e-commerce retailers in China’s
e-commerce market which are aimed at different consumer
groups, and their pricing bases are different. No matter what
type of retailer, the provision of quality service does not nec-essarily mark a higher price. The net sellers who enter the online market earlier will have lower prices.
Data Availability
All data is true and reliable and can be obtained by contacting the corresponding author.
Conflicts of Interest
We declare that there is no conflict of interest regarding the
publication of this paper.
References
[1] L. Wang, Q. Wu, J. Elliot, F. R. Fiedler, and S. Lapin,“Linear diffusion-wave channel routing using a discrete Hayami convolution method,” Journal of Hydrology, vol. 509, no. 2, pp. 282–294, 2014.
[2] J. Sha, W. Wu, T. Lv, and W. Wu,“Coordination of advertising free riding in hybrid channel supply chain,”Discrete Dynamics in Nature and Society, vol. 2016, Article ID 7423043, 9 pages, 2016.
[3] R. Wang, P. Wang, G. Xiao, and S. Gong,“Power demand and supply management in microgrids with uncertainties of
0 2 4 6 8 10 12 14 16 18 0.030 0.035 0.040 0.045 0.050 0.055 0.060 0.065 0.070 0.075 0.080 Dis cr et e-time Number of periods MCRs Dotcoms All
renewable energies,”International Journal of Electrical Power & Energy Systems, vol. 63, no. 12, pp. 260–269, 2014. [4] M. Gümüş, S. Li, W. Oh, and S. Ray,“Shipping fees or shipping
free? A tale of two price partitioning strategies in online retail-ing,” Production & Operations Management, vol. 22, no. 4, pp. 758–776, 2013.
[5] A. J. Heitmann and R. S. Gardiner-Garden,“A robust feature extraction and parameterizedfitting algorithm for bottom-side oblique and vertical incidence ionograms,” Radio Science, vol. 54, no. 1, pp. 115–134, 2019.
[6] X. Nie, T. Boyacı, M. Gümüş, S. Ray, and D. Zhang,“Joint procurement and demand-side bidding strategies under price volatility,”Annals of Operations Research, vol. 257, no. 1-2, pp. 121–165, 2017.
[7] X. K. Xie, R. Verma, and C. K. Anderson,“Demand growth in services: a discrete choice analysis of customer preferences and online selling,”Decision Sciences, vol. 47, no. 3, pp. 1450–1462, 2016.
[8] L. Xia and B. Shihada,“A Jackson network model and thresh-old policy for joint optimization of energy and delay in multi-hop wireless networks,” European Journal of Operational Research, vol. 242, no. 3, pp. 778–787, 2015.
[9] Q. Pang, Y. Chen, and Y. Hu,“Three-level supply chain coor-dination under disruptions based on revenue-sharing contract with price dependent demand,”Discrete Dynamics in Nature and Society, vol. 2014, Article ID 464612, 11 pages, 2014. [10] S. Hurkens and Á. L. López, “Mobile termination, network
externalities and consumer expectations,”Economic Journal, vol. 124, no. 579, pp. 1005–1039, 2014.
[11] D. Gao, N. Wang, and Z. He,“The bullwhip effect in an online retail supply chain: a perspective of price-sensitive demand based on the price discount in e-commerce,”IEEE Transac-tions on Engineering Management, vol. 64, no. 2, pp. 134– 148, 2017.
[12] A. Paciorek,“Supply constraints and housing market dynam-ics,” Journal of Urban Economics, vol. 77, no. 1, pp. 11–26, 2013.
[13] J. Brandts, S. S. Reynolds, and A. Schram,“Pivotal suppliers and market power in experimental supply function competi-tion,”Economic Journal, vol. 124, no. 579, pp. 887–916, 2014. [14] I. Kim and A. Petrin,“Tests for price endogeneity in diff eren-tiated product models,” Journal of Econometric Methods, vol. 4, no. 1, pp. 47–69, 2015.
[15] S. Rezapour, J. K. Allen, and F. Mistree,“Uncertainty propaga-tion in a supply chain or supply network,” Transportation Research Part E Logistics & Transportation Review, vol. 73, pp. 185–206, 2015.
[16] T. Berry and A. Haile,“Identification in differentiated prod-ucts markets using market level data,”Econometrica, vol. 82, no. 5, pp. 1749–1797, 2014.
[17] J. Venables, “Depletion and development: natural resource supply with endogenousfield opening,”Journal of the Associa-tion of Environmental & Resource Economists, vol. 1, no. 3, pp. 313–336, 2014.
[18] W. Chung, S. Talluri, and R. Narasimhan,“Optimal pricing and inventory strategies with multiple price markdowns over time,” European Journal of Operational Research, vol. 243, no. 1, pp. 130–141, 2015.
[19] E. Adida and G. Perakis,“The effect of supplier capacity on the supply chain profit,”Annals of Operations Research, vol. 223, no. 1, pp. 1–52, 2014.
[20] Y. Fan,“Ownership consolidation and product characteristics: a study of the US daily newspaper market,” American Eco-nomic Review, vol. 103, no. 5, pp. 1598–1628, 2013.
[21] H. Liang, J. Zou, K. Zuo, and M. J. Khan,“An improved genetic algorithm optimization fuzzy controller applied to the well-head back pressure control system,”Mechanical Systems and Signal Processing, vol. 142, article 106708, 2020.
[22] H. Zheng, W. Guo, and N. Xiong,“A kernel-based compres-sive sensing approach for mobile data gathering in wireless sensor network systems,” IEEE Transactions on Systems, Man, and Cybernetics: Systems, vol. 48, no. 12, pp. 2315– 2327, 2017.
[23] Z. Huang, X. Xu, J. Ni, H. Zhu, and C. Wang, “Multimodal representation learning for recommendation in Internet of Things,” IEEE Internet of Things Journal, vol. 6, no. 6, pp. 10675–10685, 2019.
[24] H. Liang, J. Zou, Z. Li, M. J. Khan, and Y. Lu, “Dynamic evaluation of drilling leakage risk based on fuzzy theory and PSO-SVR algorithm,” Future Generation Computer Systems, vol. 95, pp. 454–466, 2019.
[25] Z. Liu, B. Hu, B. Huang, L. Lang, H. Guo, and Y. Zhao, “Deci-sion optimization of low-carbon dual-channel supply chain of auto parts based on smart city architecture,” Complexity, vol. 2020, Article ID 2145951, 14 pages, 2020.
[26] Y. Zhang, R. Zhu, Z. Chen, J. Gao, and D. Xia,“Evaluating and selecting features via information theoretic lower bounds of feature inner correlations for high-dimensional data,” Euro-pean Journal of Operational Research, vol. 11, 2020.
[27] H. Liang, A. Xian, M. Min Mao, P. Ni, and H. Wu,“A research on remote fracturing monitoring and decision-making method supporting smart city,”Sustainable Cities and Society, vol. 62, article 102414, 2020.
[28] Y. Zhou, D. Zhang, and N. Xiong, “Post-cloud computing paradigms: a survey and comparison,”Tsinghua Science and Technology, vol. 22, no. 6, pp. 714–732, 2017.