An Investigation of
Medicare Advantage
Dual Eligible Member-
Level Performance
on CMS Five-Star
Quality Measures
An In
v
es
tigation o
f Medic
ar
e A
dv
an
tage Dual Eligible Member
-L
ev
el
P
erf
ormanc
e on CMS Fiv
e-S
tar Qualit
y Me
asur
About Inovalon
Inovalon is a leading technology company that combines advanced cloud-based data analytics and data-driven intervention platforms to achieve meaningful insight and impact in clinical and quality outcomes, utilization, and financial performance across the healthcare landscape. Inovalon’s unique achievement of value is delivered through the effective progression of Turning Data into Insight, and Insight into Action®. Large proprietary datasets, advanced integration technologies, sophisticated predictive analytics, data-driven intervention platforms, and deep subject matter expertise deliver a seamless, end-to-end capability that brings the benefits of big data and large-scale analytics to the point of care. Driven by data, Inovalon uniquely identifies gaps in care, quality, data integrity, and financial performance – while bringing to bear the unique capabilities to resolve them. Providing technology that supports hundreds of healthcare organizations in 98.2% of U.S. counties and Puerto Rico, Inovalon’s cloud-based analytical and data-driven intervention platforms are informed by data pertaining to more than 754,000 physicians, 248,000 clinical facilities, and more than 120 million Americans providing a powerful solution suite that drives high-value impact, improving quality and economics for health plans, ACOs, hospitals, physicians, consumers and pharma/life-sciences researchers. For more information, visit www.inovalon.com.
3
TABLE OF CONTENTS
Executive Summary ...5
Background ...11
Objective ...16
Methods ...16
Study Population and Data Sources ...17
Plan-Level Analyses ...18
Multivariate Analyses ...27
Appendix A—Variable Descriptions ...40
Appendix B—Measure Definitions for Selected
CMS Five-Star Quality and Display Measures ...46
Appendix C—Plan Benefit Package Level Analyses:
Technical Notes ...52
Appendix D—Plan Benefit Package Level Analyses:
Detailed Results ...54
Appendix E—Analysis: Technical Notes
...63
Appendix F—Multivariate Decomposition Analyses:
Detailed Results ...66
Dual Eligible Study Advisory Panel ...85
Inovalon Project Team ...86
4
ACKNOWLEDGEMENTS
This study was independently conducted by Inovalon’s Division of Statistical Research, with additional funding provided by Cigna HealthSpring, WellCare, Healthfirst, Gateway Health, Blue Cross Blue Shield Minnesota and Blue Plus, and Health Care Service Corporation (HCSC). We would like to extend our appreciation and thanks to the staff of the Centers for Medicare and Medicaid Services for their technical comments on the methodologies used in this report, and to the Special Needs Plan (SNP) Alliance, Medicaid Health Plans of America (MHPA) and Pharmacy Quality Alliance (PQA) for their feedback on the analyses and findings.
If you have any questions, or would like to request more information on the study, please contact Inovalon via email: inquiries@inovalon.com
5
EXECUTIVE SUMMARY
The Centers for Medicare and Medicaid Services (CMS) evaluates Medicare Advantage (MA) health plan performance using a Five-Star Rating System based on a wide range of quality measures. MA Star Ratings are published annually, and thus influence health plan member recruitment and retention. Since 2012, the Star Ratings affect MA health plan reimbursement through quality-bonus payments made to plans that achieve higher ratings. A 2013 Inovalon study investigated the association of dual eligible populations—Medicare beneficiaries who are eligible for both Medicare and Medicaid—and the performance of MA health plans and found that dual eligible members had significantly lower scores compared to non-dual eligible members on nine of the 10 Star Measures evaluated. The objective of this follow-up investigation was to identify the factors associated with the lower Star Ratings among dual eligible members. To our knowledge, this is the first study to use a large-scale claims database comprised of more than 2.2 million MA beneficiaries, supplemented with new detailed sources of sociodemographic and community resource data at the member-level in conjunction with monthly data on dual eligible status. This unique database enables a statistically valid evaluation of the influence of clinical, sociodemographic and community resource risk factors on Star Measure outcomes at the individual beneficiary level.
This is also the first study to leverage a database large enough to evaluate Star Measure outcomes of dual eligible members compared to non-dual eligible members enrolled in the same “plan benefit package.” MA health plans have contracts with CMS to offer Medicare covered benefits in defined geographic areas, and within those contracts, plans can offer different plan benefit packages. Research to date has compared MA health plan quality at the contract level, which can confound results because contracts often aggregate beneficiaries across different plan benefit packages and provider networks. Analyses at the plan benefit package level allow analyses to answer the question, “To what degree are MA beneficiary outcomes related to the dual eligible status of individual plan members versus the quality of care provided by the plan?”
Key Findings
1. Dual eligible beneficiaries have significantly worse outcomes than non-dual eligible members who are enrolled in the same plan benefit package for five of the eight current Star Measures analyzed.
2. Worse outcomes of dual eligible members are not statistically related to the proportion of dual eligible members enrolled in the plan. Dual eligible members have worse outcomes no matter how large or how small the number of dual eligible beneficiaries in the plan.
3. Worse outcomes of dual eligible members are not statistically associated with enrollment in lower-performing plans, but appear to be related to a higher prevalence of risk factors among dual eligible members.
6
4. Clinical and sociodemographic risk factors affect outcomes in all MA members, but the impact is magnified for MA health plans serving more dual eligible members due to (1) the higher prevalence of these risk factors in the dual eligible population; and (2) the differential impact of these factors on dual eligible members.
5. Clinical, sociodemographic and community resource factors are significantly associated with worse outcomes among dual eligible members accounting for at least 70% of the observed disparities in outcomes between dual eligible and non-dual eligible members for seven Star Measures analyzed using a multivariate technique.
6. Differences in sociodemographic characteristics were consistently a main contributor to the differences in outcomes between dual eligible and non-dual eligible members, accounting for at least 30% of the observed disparities in outcomes of dual eligible members compared to non-dual eligible members.
7. If MA Star Measures were adjusted to control for characteristics statistically associated with higher risk for the outcomes evaluated, the observed performance gaps between dual eligible and non-dual eligible members would be reduced by 70% or more based on this research.
Summary of Study Findings
The first series of analyses were designed to evaluate the impact of a member’s dual
eligible status on Star Measure scores within individual plan benefit packages (plans). These analyses assess whether the observed worse outcomes among dual eligible plan members are related to enrollment in poor-performing plans or whether they are related to higher risk profiles of dual eligible beneficiaries. For this study, dual eligible members were defined broadly as those who were dual eligible for at least one month during the study period (2013), including those in Dual Eligible Special Needs plans (D-SNPs). The effect of dual eligible status on individual member outcomes was negative for five of eight current Star Measures evaluated, indicating that dual eligible members have worse outcomes than non-dual eligible members within the same plan. In general, there was no relationship between individual plan member outcomes and the proportion of dual eligible members served by the plan.
7
An important illustration of the negative impact of dual status on outcomes is “Plan All-Cause Readmissions,” a quality measure that is given triple weight in calculating
MA Plan Five-Star Ratings. Hospital readmissions have received significant attention
in recent years due to the high cost and the effect on individuals’ quality of life. This is the only measure among those studied that is currently statistically adjusted for clinical and demographic risk factors associated with higher rates of readmission. The analysis found that dual eligible members are more likely to be readmitted to hospitals than non-dual eligible members in the same plan, even after accounting for the measure’s existing adjustment factors. The percent of dual eligible members enrolled in the plan was not associated with higher readmissions of individual plan members.
This finding suggests that the current adjustments to this measure for age, gender and chronic clinical conditions do not fully correct MA Plan Five-Star Rating scores for the impact of dual eligible status. Simply put, a dual eligible member is at higher risk for hospital readmission compared to a non-dual eligible member with the same clinical characteristics, and this added risk is not accounted for in the current Star Ratings.
In summary, the first series of analyses found that the lower performance of dual eligible
members does not appear to be associated with the quality of care provided by the plan. If the disparities were due to the quality of care provided by the plan, the analysis would have shown similar results between dual eligible and non-dual eligible members within the same plan benefit package (i.e., the “dual status effect” would not have been significant). If the disparities were associated with plans serving a larger proportion of dual eligible members, the analysis would have shown a significant effect related to this plan characteristic (i.e., the “contextual effect” would have been significant). Neither of these results was found in this study. In other words, this research indicates that lower performance of dual eligible members does not appear to be due to enrollment in lower-performing plans.
The second series of analyses focused on identifying the specific clinical, sociodemographic
and community resource factors contributing to the disparities in seven current Star Measures evaluated using a multivariate approach (“decomposition analysis”).
Differences in clinical, sociodemographic and community resource characteristics between dual eligible and non-dual eligible members accounted for 70% or more of the performance gaps observed in the seven Star Measures analyzed. Sociodemographic characteristics were consistently a main contributor to the disparity between dual eligible and non-dual eligible MA plan members, explaining 30% or more of the observed differences in outcomes.
8
Using the Plan All-Cause Readmissions measure to illustrate these findings, the decomposition of factors contributing to the disparity in readmission rates between dual eligible and non-dual eligible beneficiaries found that 81.8% of the disparity in readmission rates was attributed to differences in the prevalence of clinical, sociodemographic and community resource factors associated with higher risk of
readmission. If dual eligible and non-dual eligible members had similar characteristics—
or if the measure was statistically adjusted to account for these factors—82% of the observed disparity could be mitigated. The 18% of the disparity in rates not explained by these factors can be attributed to the differential impact of the risk factors on dual eligible members.
Of the 81.8% of the disparity explained by the risk factors identified, over half— 54.3%—was attributed to 17 chronic conditions associated with higher rates of readmission; 27.5% of the disparity was attributed to 3 sociodemographic factors. Living in a neighborhood with a high poverty rate (greater than 23% of households) contributed more than any other risk factor to the likelihood of readmission. This sociodemographic factor explained 18.1% of the disparity in readmission rates. Being poor increases the risk of readmission among all MA members, but the dual eligible population is impacted disproportionately because 41.2% lived in a high poverty neighborhood compared to only 15.8% of non-dual eligible members.
Renal disease contributed the most of any chronic condition to the performance gap—14.9%—due to the higher prevalence of the disease among dual eligible
members (50.7% vs. 43.9%). Dementia is also more prevalent in dual eligible members
(42.8% vs. 35.9%) and explained 14.5% of the gap.
Living in a county designated as having a physician shortage (less than 50 physicians
per 10,000 people) explained 11.9% of the disparity in readmission rates. This
result substantiates recent studies reporting that a lack of social- and community-based supports leads to higher rates of readmission.
Three Medication Adherence measures included in the Five-Star Rating System were evaluated. The decomposition analyses found that if these measures were statistically adjusted for factors associated with non-adherence, MA plans would score better on medication adherence among their dual eligible members compared to non-dual eligible members with similar risk profiles. Early results of this study released in October 2014 showed that dual eligible members have more outpatient visits on average compared to non-dual eligible members, and that more office visits are associated with better adherence. Since these measures have no statistical adjustments for any of the risk factors associated with lower adherence, and these factors are more prevalent in dual eligible members, reported Star Ratings do not reflect this quality-of-care difference. Because these three
9
measures are triple-weighted in the Star Rating System, the failure to adjust for these risk factors has three times the impact on Star Ratings of MA plans serving a large proportion of dual eligible members.
In summary, the second series of analyses found that 70% or more of the observed
disparities in outcomes between dual eligible and non-dual eligible members were attributable to differences in the prevalence of clinical, sociodemographic and community resource factors associated with higher risk of a worse outcome and not under the control of the health plan. If these Star Measures were statistically adjusted for the risk factors associated with worse performance, the observed disparities in scores could be reduced by 70% or more.
Conclusions
This study demonstrates that dual eligible members have significantly worse outcomes on a majority of MA Star Rating measures evaluated. The worse outcomes are statistically associated with dual eligible status, and are not associated with the proportion of dual eligible members in the plan.
Longstanding social epidemiological research suggests that patient sociodemographic and community resource factors influence health utilization and outcomes just as clinical risk factors influence health utilization and outcomes. This study affirms that these factors significantly affect outcomes in all MA members, but have a larger impact on the dual eligible population and on MA plans serving larger proportions of dual eligible members due to (1) the higher prevalence of these risk factors in dual eligible members; and (2) the differential impact of these factors on dual eligible members.
The findings of this investigation suggest that under the current Star Rating System, MA plans serving disadvantaged members—such as those who are dual eligible—may be providing a higher quality of care than they appear to provide based on the current Star Rating system. The issue of accurate evaluation of the quality of care provided by health plans and providers extends more broadly to a wide range of existing quality measures, which prompted the National Quality Forum (NQF) to amend their longstanding policy against risk adjustment for sociodemographic factors in 2014. Beginning in January 2015, the NQF implemented a “robust trial period” to allow measure developers to test the feasibility of adding sociodemographic factors to the risk adjustment of measures meeting specified criteria.1
The results of this study support the need for adjustment to measures in the MA Five-Star Rating System that account for clinical, sociodemographic and community resource factors in order to ensure a fair evaluation of the actual performance of MA plans. These adjustments would provide a more accurate comparison of quality across all MA plans by accounting for factors statistically associated with higher risk of worse outcomes. While
10
the appropriateness of risk adjusting for clinical risk factors is well accepted in quality measurement, the majority of clinical Star Measures still have no such adjustments. The appropriateness of adjusting quality measures for sociodemographic factors is still under debate, but the results of this study demonstrate that these factors are important contributors to disparities in outcomes and affect all MA members with those characteristics. The appropriateness of adjusting for community resource availability is less controversial, but no Star Measures include adjustments for such factors.
The contribution of clinical, sociodemographic and community resource factors varies by measure—a characteristic may impact one outcome but not another and a characteristic can serve to reduce the disparity for one measure but increase the disparity for another. Thus, the argument that adjusting for these factors would allow a lower standard of care for members with these characteristics is not supported by the results of this investigation. With risk adjustment, plans doing a relatively worse job at achieving good outcomes among members with high-risk characteristics will still have lower performance scores relative to plans doing a relatively better job at achieving good outcomes among members with similar risk profiles. The adjustments provide a more level playing field to allow fair comparisons of quality of care across health plans serving different populations.
Future measurement development efforts should account for factors that affect health plan performance and that are outside the control of the health plan in order to have valid and useful measures that support health plan evaluation and ongoing quality-improvement efforts.
11
BACKGROUND
A 2013 Inovalon study titled “The Impact of Dual Eligible Populations on CMS Five-Star
Quality Measures and Member Outcomes in Medicare Advantage Health Plans” 2presented
new quantitative evidence—based on member-level analysis of 1.6 million Medicare Advantage (MA) plan beneficiaries—that dual eligible members performed significantly worse on nine of 10 Star Measures examined. Consumers are increasingly using Star Ratings to select a health plan, and thus the ratings impact the plan’s ability to recruit and retain members. Since 2012, the ratings also affect health plan reimbursement through quality-bonus payments made to MA plans based on Star Ratings. There is evidence of large shifts of members from low Star to higher Star MA plans, primarily attributed to the better benefits high Star plans are able to provide due to higher reimbursement.3
Research over the last 25 years has demonstrated the role of social determinants of health, such as income, education, occupation and social supports as significant contributors to health outcomes.4 The 2002 Institute of Medicine report titled “The Future of the Public’s
Health in the 21st Century” observed that “research has increasingly demonstrated the
important contributions to health of factors beyond the physical environment, medical care, and health behaviors, e.g., socioeconomic position, race and ethnicity, social networks and social support, and work conditions, as well as economic inequality and social capital.”5 A large meta-analysis seeking to assign weights to determinants of health
found that, on average, access and quality of clinical care contribute about 20% to health outcomes, while social and economic factors such as education, income and family/social supports contribute 40%. Health behaviors such as alcohol and drug abuse contribute 30% to health outcomes.6
In 2014, the National Quality Forum (NQF) released recommendations that pointed to the need for risk adjustment of some quality measures to account for the impact of sociodemographic risk factors—defined as inclusive of socioeconomic status and other social risk factors—on health outcomes in order to make correct and fair inferences about quality and improve outcomes in vulnerable populations with these characteristics.7
The NQF expert panel recommended a measure-by-measure determination of the appropriateness of sociodemographic adjustment based on two criteria: (1) there should be a conceptual relationship between the factor and the outcome or process reflected in the measure; and (2) there should be empirical evidence that the sociodemographic factor affects the measure.8
The NQF report noted that a lack of available data on sociodemographic factors has limited the ability to scientifically test the validity and feasibility of these factors as potential risk adjustors to the quality measures. This study used new data sources to enable testing the impact of various sociodemographic and community resource, clinical, and demographic factors on outcomes at the member-level.
12
On Sept. 9, 2014, CMS issued a request for information (RFI), “Data on Differences in Medicare Advantage (MA) and Part D Star Rating Quality Measurements for Dual-Eligible versus Non-Dual-Dual-Eligible Enrollees.”9 The RFI specifically requested “[a]nalysis
of the difference in measurement scores between dual and non-dual … enrollees in the same contract or plan for all contracts under a parent organization for the Star Ratings measures. Analyses would be more helpful if all enrollees from all contracts under a parent organization are included in the analysis.” The RFI further requested “[i]n-depth analyses using a multivariate
modeling approach to explore the relationship between dual status and measure scores.” The
analysis that CMS requested was addressed in this report.10
Phase one of this follow-up study was to update and expand upon the 2013 Inovalon report. The “Member-Level Analyses” results were published in October 2014 in a preliminary study report in order to provide MA health plans additional information and data needed to respond to the CMS RFI.11 The Member-Level Analyses evaluated how
clinical, sociodemographic and community resource factors differ for dual eligible and non-dual eligible members and how quality measure scores differ between dual eligible and non-dual eligible MA members by those factors for a subset of 18 quality measures; eight current Star Measures and 10 Star Display measures (see Table 1). The Star Display measures are reported but not factored into the Five-Star Rating System. These 18 measures were selected because they can be readily calculated using available claims data. Other Star Rating Measures are derived from beneficiary surveys, medical record reviews, and other sources not readily available for analysis. Detailed definitions of the measures are included
13
The Member-Level Analyses provided new and detailed evidence that dual eligible MA beneficiaries have different clinical and sociodemographic profiles compared to non-dual eligible beneficiaries, and that many of these characteristics are associated with worse performance on a majority of measures evaluated.
Dual eligible members are younger, more likely to be female, and more ethnically/racially diverse. They are more likely to have chronic conditions that impact health outcomes, such as alcohol/drug/substance abuse, anxiety, dementia, and bipolar/major depression. Dual eligible members comprise 75% of MA beneficiaries with HIV and schizophrenia, more than 80% of members with inadequate/lack of housing, 86% of members with intellectual disability, and more than 50% of MA members using a wheelchair.
MEASURE ACRONYM
STAR
MEASURE MEASURE NAME
RISK ADJUSTMENT
HIGHER SCORE
ART Yes Rheumatoid Arthritis Management None Better
BPD Yes Diabetes Treatment None Better
HRM Yes High Risk Medication None Worse
MA-C Yes Medication Adherence for Cholesterol (Statins) None Better MA-D Yes Medication Adherence for Diabetes Medications None Better MA-H Yes Medication Adherence for Hypertension (RAS Antagonists) None Better
OMW Yes Osteoporosis Management in Women Who Had a Fracture None Better
PCR Yes Plan All-Cause Readmissions chronic conditionsAge, gender, Worse
AAP No Access to Primary Care Doctor Visits None Better
AMM No Antidepressant Medication Management None Better
BCS No* Breast Cancer Screening None Better
DDI No Drug-Drug Interactions None Worse
IET-E No Engagement of Alcohol or other Drug Treatment None Better
IET-I No Initiation of Alcohol or other Drug Treatment None Better
PBH No Continuous Beta-Blocker Treatment None Better
PCE-B No Pharmacotherapy Management of COPD Exacerbation-Bronchodilator None Better
PCE-S No Pharmacotherapy Management of COPD Exacerbation-Systemic Corticosteroid None Better
SPR No Testing to Confirm Chronic Obstructive Pulmonary Disease None Better
*will be included in 2016 Star Rating System pursuant to the CMS 2016 call letter issued Nov. 21, 2014
14
Dual eligible members are more likely to live in areas designated as shortage areas for primary care physicians and mental health professionals. They have more emergency room visits, more hospitalizations and readmissions within 30 days of hospitalization, and are more likely to take seven or more different medications. They are more likely to live in an urban neighborhood with a median income less than $20,000, and 75% of the population lives in a high-poverty neighborhood. In addition, few are married or own their own home, and they are more likely to live in a neighborhood where more than 40% are single-person households.
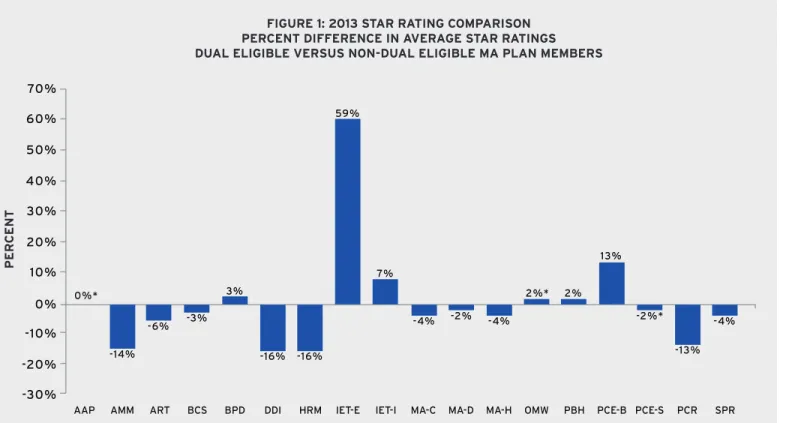
Measure rates were calculated separately for all dual eligible and non-dual eligible members in the study population for the 18 measures analyzed. Results comparing the differences in rates are shown in Figure 1. The bars in the graph represent the percentage difference in rates between dual eligible and non-dual eligible members. A bar below 0% indicates dual eligible members perform worse than non-dual eligible members, while a bar above 0% indicates dual eligible members perform better.
Results showed that dual eligible members had significantly worse outcomes on six of the eight current Star Measures (75%) and on 10 of the 18 measures overall (56%) (see Figure 1). Dual eligible members performed significantly better on one current Star Measure— Diabetes Treatment (BPD)—but that measure was retired by the measure developer in late 2014. Dual eligible members also performed better on four Star Display measures related to drug treatment, including two measures related to initiation and engagement of alcohol/drug/substance abuse treatment.
Dual eligible members performed similar to non-dual eligible members on three of 18 measures, including access to primary care visits (AAP) and two other measures.
15
The large member-level database allowed for calculation of rates for the 18 measures further stratified by a large number of member clinical, sociodemographic and community resource characteristics. The stratified rates identify specific groups of members experiencing the worst outcomes for the measures evaluated. For example, dual eligible members are far more likely to have disability as the original reason for entitlement (46.3% versus 16.9%), underscoring a major difference in this population. The stratified measure rates were worse for dual eligible members who qualified for Medicare based on disability compared to members who qualified for Medicare based on the traditional criteria of age for a majority of measures evaluated. These findings address the often-voiced fears that adjustment of the quality measures for sociodemographic factors would mask disparities. Reporting the stratified measure results as recommended by the NQF will make the disparities more transparent. These results can be tied to meaningful quality-improvement programs and changes in service delivery that can improve overall plan performance and impact outcomes in the most vulnerable members. As noted by the NQF, disparities currently exist by reporting unadjusted scores that do not accurately reflect the quality of care being provided by MA plans, particularly those serving large, disadvantaged populations, such as dual eligible beneficiaries.
0%*
-30% -10% -20% 10% 30% 20%
0% 50% 40% 60% 70%
FIGURE 1: 2013 STAR RATING COMPARISON PERCENT DIFFERENCE IN AVERAGE STAR RATINGS DUAL ELIGIBLE VERSUS NON-DUAL ELIGIBLE MA PLAN MEMBERS
NOTE 1: *not statistically significantly different (AAP, OMW, PCE-S)
NOTE 2: The signs of the inverse measures where a higher rate indicates worse performance—Drug-Drug Interactions (DDI), High Risk Medications (HRM) and Plan All-Cause Readmissions (PCR)—were reversed so that a bar below 0% always indicates worse performance by dual eligible members.
NOTE 3: The percent difference in rates for the engagement measure (IET-E) stands out as relatively large because outcome rates for that measure are so low compared to other measures in the chart (5.4% for dual eligible members and 3.4% for non-dual eligible members, resulting in a 59% difference in rates).
-14% -16% -16% -13%
-6% -3% -4% -2% -4% -2%* -4%
3% 2%* 2%
13% 7%
59%
16
OBJECTIVE
The objective of phase one of this study was to evaluate how clinical, sociodemographic and community resource factors differ for dual eligible and non-dual eligible members and how stratified quality-measure scores differ by those factors. These results were published in October 2014 and summarized above.
The objective of phase two of this study was twofold: (1) conduct a series of complex statistical analyses to better understand the impact of a member’s dual eligible status on Star Measure scores for MA members enrolled in the same plan benefit package; and (2) identify specific clinical, sociodemographic and community resource characteristics underlying observed disparities in Star Measure scores between dual eligible and non-dual eligible members and quantify the relative contribution of these factors to the performance gaps.
METHODS
Findings from two separate analyses designed to support the two main objectives are included in this report:
1. The first series of analyses were designed to evaluate the impact of dual eligible member status on Star Measure scores for members within the same plan. This is the first study to leverage a sufficiently large database to evaluate performance of MA members within the same plan benefit package in order to weigh the effect of plan characteristics versus the effect of dual eligible status on member outcomes. This approach allows researchers to answer the question, “To what degree are MA beneficiary outcomes related to the dual eligible status of individual plan members versus the quality of care provided by the plan?”
2. The second series of analyses focused on identifying and quantifying the specific clinical, sociodemographic and community resource factors contributing to the disparities in seven Star Measures evaluated using a multivariate decomposition approach.
Detailed methodologies for each analysis are included below, with additional technical notes included in the Appendices.
The study protocol was reviewed by the Chesapeake Institutional Review Board (IRB) and determined not to require IRB oversight as per Department of Health and Human Services regulations 45 CFR 46.
17
STUDY POPULATION AND
DATA SOURCES
A base population of 2,207,940 MA members in 81 separate MA contracts with 364 individual plan benefit packages in 2013 was utilized in this study. The study utilized member-level data including age, gender, race/ethnicity, and comprehensive information on diseases/diagnoses, chronic conditions, and medical and pharmacy utilization. These data were supplemented with dual eligible status, low-income subsidy status, and institutional status. All dual eligible members were included in this study, including those enrolled in Dual Eligible Special Needs Plans (D-SNPs). These member-level data were linked with sociodemographic characteristics (such as income, education, household size) and data on availability of community resources (such as shortage of physicians or mental health professionals). Previous research has demonstrated that sociodemographic and community resource characteristics of the neighborhood where the individual member resides can serve as close proxies for these characteristics at the member-level (e.g., income, education).12
The main data source for this study was member-level MA data extracted from Inovalon’s MORE² Registry® (Medical Outcomes Research for Effectiveness and Economics Registry referred to as MORE2). MORE² is a large, nationally representative and statistically
de-identified administrative claims database. The database includes longitudinal patient-level data for more than 120 million individual eligible members from a broad range of sources across all payer types (Commercial, Medicare and Medicaid), geographic regions (capturing virtually all U.S. counties), healthcare settings (inpatient and outpatient services), and provider specialties.
CMS monthly membership reports (MMR) were utilized to identify members’ Medicaid dual eligible status, original reason for entitlement, amount of low-income drug subsidy received, and institutional status. Dual eligible beneficiaries are members who are eligible for Medicare and Medicaid. Dual eligible members with incomes below 150% of the federal poverty level qualify for the Part D Low-Income Subsidy (LIS).
The key source of data on sociodemographic characteristics in this study was from Acxiom’s Market Indices ACS data, which is an aggregation of the American Community Survey (ACS) and Acxiom’s InfoBase® Geo files. The files include data aggregated from multiple, comprehensive individual and household databases (e.g., public records such as government information, self-reported data, buying activity, financial behavior).13
18
These sources result in roughly 30 million discrete data points based on Zip+4 areas, which include an average of eight households. The files include a broad range of data elements on sociodemographic factors at the member’s near neighborhood level, including financial information, education levels, mean household size, and other social, economic, and demographic characteristics. Previous studies examining sociodemographic characteristics have generally utilized data available at the Census 5-digit ZIP code level that cover only about 40,000 discrete data points, or U.S. Census Bureau ACS area block group data that cover about 250,000 areas. These sources provide information averaged across multiple disparate neighborhoods, resulting in a relatively imprecise assignment of characteristics to individual members compared to the 30 million discrete neighborhoods utilized in this study.
The area health resource file (AHRF) was used to provide information on community resource availability at the county level.14 This file contains information such as primary
care and mental health professional shortage areas, number of physicians per 10,000 people, and hospital admissions per 10,000 people.
A detailed description of the key variables used in the study is included in Appendix A.
PLAN-LEVEL ANALYSES
Objective
The purpose of these analyses was to use the large study sample of MA members to examine variation in Star Measure scores between dual eligible members and non-dual eligible members after controlling for variations in performance of beneficiaries enrolled in the same plan benefit package within an individual MA health plan contract. MA health plans have contracts with CMS to offer Medicare covered benefits in defined geographic areas, and within those contracts, plans can offer different plan benefit packages. However, CMS reports MA Five-Star Ratings at the contract level only. While some previous studies have examined the association of the percentage of dual eligible members in a contract and contract Five-Star Ratings using available published data, this is the first large-scale study to evaluate Star Measure performance at the individual MA member-level, and the first to compare outcomes of dual eligible and non-dual eligible members enrolled in the same plan benefit package.
The specific objective of these analyses was to investigate systematic differences in Star Measure scores in dual eligible versus non-dual eligible members (referred to as the “within”
effect) after controlling for the effect of the individual plan benefit package and for the percent of dual eligible members in the plan benefit package (referred to as the “contextual”
19
Methods
The observations in these analyses are individual members of MA plan benefit packages. Both members and health plans are characterized in terms of dual eligible status; that is, members are categorized as dual eligible or not, and plans benefit packages are categorized by the percent of dual eligible membership.
The analyses employ a set of statistical approaches that seek to estimate the relative impact of both individual member and group characteristics on the 18 quality measures evaluated. The premise of these approaches is that members of a group are more similar to members of the same group—such as employees within the same company or students within the same school—and these within-group inter-correlations must be taken into account.15
These statistical techniques are used when individuals are nested within different groups (in this case, members enrolled in a specific MA plan benefit package).16
Three different specifications were tested using the generalized linear mixed-model approach.i All three models included a “random effects” variable to account for the
non-independence of data from members of the same plan benefit package. This controls for the different characteristics of the separate benefit packages.
1. Model 1 examined the effect of the member’s dual eligible status on outcomes. The question addressed by this model was, “After controlling for the effect of the plan benefit package the members were enrolled in, do dual eligible and non-dual eligible members differ on the outcome measure?”
2. Model 2 examined the effect of the member’s dual eligible status on outcomes after adding the effect of the proportion of dual eligible members in the plan benefit package. The question addressed by this model is, “After controlling for the effect of the plan benefit package and controlling for the effect of the percent of dual eligible members in the plan benefit package (the “contextual effect”), do outcomes of dual eligible and non-dual eligible members differ?”
3. Model 3 is a specific form of Model 2, which is used when the group variable is derived from the individual variable (in this case, the group variable “percent of dual eligible members in the plan benefit package” is derived from the individual members’ dual eligible status). It is specified so that the effect of the two explanatory variables can be estimated independent of one another.11
Detailed technical specifications for the three models are presented in Appendix C.
i These models are known by different names depending on discipline (e.g., multilevel models, random effects models, generalized linear mixed models, hierarchi-cal linear models).
20
Sample Selection
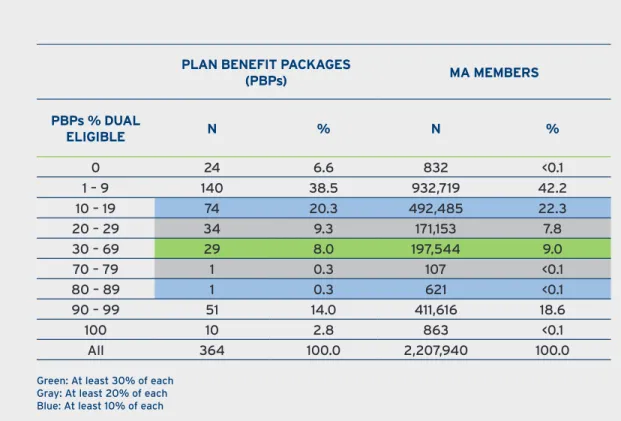
The number of plan benefit packages and MA members grouped by the percent of dual eligible membership is shown in Table 2. Since most plans have either relatively few dual eligible members or a large portion of dual eligible members (i.e., they tend to be clustered at the ends of the distribution), using the sample of plan benefit packages with at least 30% of both dual eligible and non-dual eligible members eliminated over 90% of the data and was dropped from the analyses. Analyses for the 18 quality measures were completed using three different samples that included (1) the subset of plan benefit packages with at least 20% of each group; (2) the subset of plan benefit packages with at least 10% of each group; and (3) all MA members in all plan benefit packages in the study population.
PLAN BENEFIT PACKAGES
(PBPs) MA MEMBERS
PBPs % DUAL
ELIGIBLE N % N %
0 24 6.6 832 <0.1
1 – 9 140 38.5 932,719 42.2
10 – 19 74 20.3 492,485 22.3
20 – 29 34 9.3 171,153 7.8
30 – 69 29 8.0 197,544 9.0
70 – 79 1 0.3 107 <0.1
80 – 89 1 0.3 621 <0.1
90 – 99 51 14.0 411,616 18.6
100 10 2.8 863 <0.1
All 364 100.0 2,207,940 100.0
Green: At least 30% of each Gray: At least 20% of each Blue: At least 10% of each
NOTE: Adding in the highlighted plan benefit packages tends to add non-dual eligible members disproportionately.
21
Outcome Measures (Dependent Variables)
The dependent variables in the models were the individual outcome for each member for each measure—we are seeking to explain outcomes at the member-level. The number of members included in the analysis for any given measure changes based on the measure definition that determines whether or not an individual member qualifies for inclusion in measure calculation. Detailed definitions for the 18 measures—including denominator criteria, numerator criteria, and any exclusions or risk adjustments—are included in
Appendix B.
Explanatory Variables (Independent Variables)
The dual eligible status of each individual MA member was used as an explanatory variable in the models in order to estimate the effect of dual status on the outcomes evaluated. Each member was categorized as dual eligible or non-dual eligible during each month of the measurement year of 2013 using the CMS MMR files. A member was categorized as dual eligible for this study—based on exploratory analyses—if they qualified for Medicaid for at least one month during the year. The study population included all dual eligible members, regardless of whether they were enrolled in a D-SNP or not.
The percentage of dual eligible members in the plan benefit package was also used as an explanatory variable. For each plan benefit package, the number of dual eligible members was divided by the total membership to calculate the “plan percent dual eligible.” This variable estimates the effect of the proportion of dual eligible members served by the plan benefit package on Star Ratings (i.e., is the percent of dual eligible members in a plan significantly related to the outcomes of individual members of the plan?). The effect of the percent of dual eligible members in the plan benefit package is referred to as the “contextual effect.” The plan percent dual eligible variable is a plan characteristic and thus does not change from one measure to another.
22
Results
As described above, these analyses were conducted using three different study populations and three different generalized linear mixed models. The separate analyses yielded remarkably consistent results, regardless of sampling method and regardless of modeling approach, which greatly strengthens the generalizability of the findings.
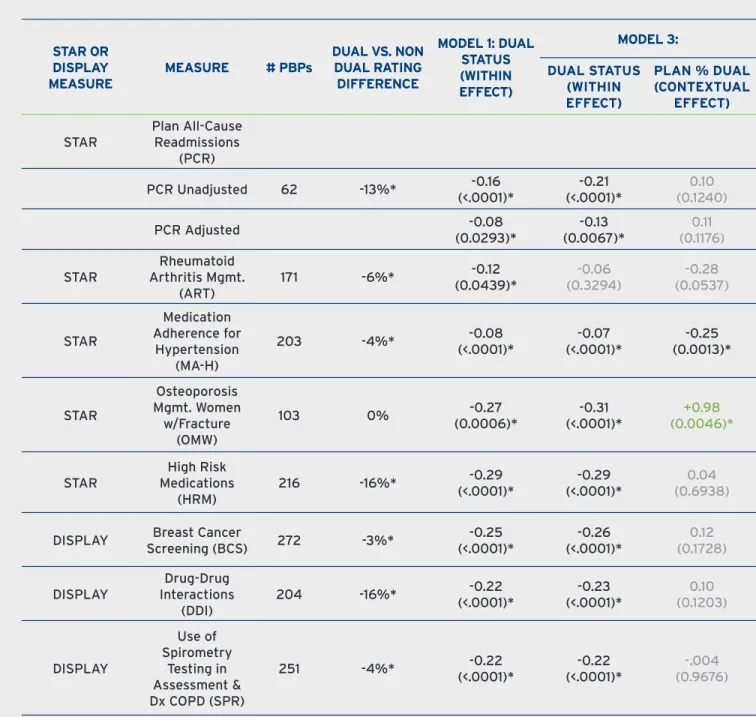
Summary results are presented in Table 3 and Table 4 below. Due to the large volume and similarity of findings across samples, results are shown only for the most inclusive sample of all MA members in all plan benefit packages in the study population (i.e., closest to the real-world Star Rating System). Similarly, because results for Models 2 and 3 were statistically equivalent in this study, we present only results for Model 1 and Model 3 in this section. Complete results for all models and samples are included in Appendix D. The effect of dual eligible status was significant and negative for five Star Measures and three Star Display Measures after controlling for plan benefit package (Model 1), and after controlling for both plan benefit package and the percent of dual eligible members in the plan (Model 3) (Table 3). For these measures, dual eligible members perform worse than non-dual eligible members within the same plan benefit package (“plan”), regardless of the percent of dual eligible members served by the plan. The measures with a significant negative dual status effect include five of the eight current Star Measures and three of the Star Display Measures, including the Breast Cancer Screening measure that is expected to be returned to the Five-Star Rating System in 2016. For one measure—Rheumatoid Arthritis Management—dual eligible status was no longer significant when plan percent dual eligible was added to the model, but the effect of plan percent dual eligible was also insignificant (Model 3).
The effect of plan percent dual eligible (the “contextual effect”) was insignificant in most cases, indicating no relationship between the proportion of dual eligible members served by the plan and individual member outcomes on the measure. The effect of plan percent dual eligible was significant in only two of the measures with a significant dual status effect, and in those cases the contextual effect was inconsistent. In one case, there was a positive relationship between the percent of dual eligible members in the plan and the outcomes of members of the plan. In the other case, the relationship was negative, indicating that as the percent of dual eligible members in the plan increased, member outcomes were more likely to be worse. These results indicate that, in general, the worse outcomes observed in dual eligible members were not statistically related to the percentage of dual eligible members in the plan, i.e., dual eligible members had worse outcomes than non-dual eligible members in plans with a small number of dual beneficiaries, as well as in plans with a large number of dual eligible beneficiaries.
23
This means that we generally cannot attribute worse outcomes of dual eligible members on these eight measures to the quality of care provided by the plan. If the disparity was related to plan performance, we would observe similar results between dual eligible members and non-dual eligible members within the same plan (i.e., the dual status effect would not be significant). If the disparity was related to the higher population of dual eligible members in the plan, we would see a significant contextual effect, which was not observed in the majority of measures evaluated.
The most compelling illustration of these findings is the “Plan All-Cause Readmissions” (PCR) measure because it is the only measure among the 18 measures evaluated that has been statistically adjusted for clinical and demographic characteristics associated with higher risk for re-hospitalization. The measure is defined as the percentage of MA members 65 years or older discharged from an acute care hospital and readmitted for any diagnosis within 30 days of discharge. The measure was analyzed two different ways to provide maximum insight into the performance gap between dual eligible and non-dual eligible plan members.
In the unadjusted model, the outcome (dependent) variable was an indicator of whether the member was readmitted or not. Dual eligible status was negative and significant in both Model 1 and Model 3, indicating that dual eligible members have higher rates of readmission compared to non-dual eligible members within the same plan. There was no contextual effect related to the percent of dual eligible members in the plan; in fact, the dual eligible status effect was even stronger after controlling for the percent of dual eligible members in the plan. This indicates that within the same plan dual eligible members are more likely to be readmitted than non-dual eligible members, regardless of the percent of dual eligible members in the plan.
In the adjusted model, the outcome variable was the same, but an explanatory variable representing the individual member’s likelihood of readmission (based on the adjusted readmissions measure) was included as an additional covariate in the model. Dual eligible status was still negative and significant in both Model 1 and Model 3, though the effect was slightly smaller as expected after adjusting for some risk factors (i.e., the coefficient values are slightly lower). This indicates that dual eligible members have higher rates of readmission compared to non-dual eligible members after controlling for the risk factors included in the adjusted Star Measure (i.e., age, gender and clinical risk factors) as well as controlling for the members’ plan benefit package and the percent of dual eligible members in the plan. There was again no relationship of individual plan member outcomes to the percent of dual eligible members enrolled in the plan.
24
These results suggest that the adjustments applied to the reported readmission rates do not fully capture all of the risk factors associated with higher likelihood of
readmission among dual eligible members. The multivariate analysis for the Plan
All-Cause Readmissions measure presented in the next section of this report explores additional factors beyond clinical and demographic characteristics contributing to the disparity in readmission rates between dual eligible and non-dual eligible MA plan members.
STAR OR DISPLAY MEASURE
MEASURE # PBPs
DUAL VS. NON DUAL RATING DIFFERENCE
MODEL 1: DUAL STATUS (WITHIN EFFECT)
MODEL 3: DUAL STATUS
(WITHIN EFFECT)
PLAN % DUAL (CONTEXTUAL
EFFECT) STAR
Plan All-Cause Readmissions
(PCR)
PCR Unadjusted 62 -13%* (<.0001)* -0.16 (<.0001)*-0.21 (0.1240)0.10
PCR Adjusted (0.0293)*-0.08 (0.0067)*-0.13 (0.1176)0.11
STAR
Rheumatoid Arthritis Mgmt.
(ART)
171 -6%* (0.0439)*-0.12 (0.3294)-0.06 (0.0537)-0.28
STAR
Medication
Adherence for
Hypertension
(MA-H)
203 -4%* (<.0001)*-0.08 (<.0001)*-0.07 (0.0013)*-0.25
STAR
Osteoporosis Mgmt. Women
w/Fracture
(OMW)
103 0% (0.0006)*-0.27 (<.0001)*-0.31 (0.0046)*+0.98
STAR
High Risk Medications
(HRM)
216 -16%* (<.0001)*-0.29 (<.0001)*-0.29 (0.6938)0.04
DISPLAY Screening (BCS)Breast Cancer 272 -3%* (<.0001)*-0.25 (<.0001)*-0.26 (0.1728)0.12
DISPLAY
Drug-Drug Interactions
(DDI)
204 -16%* (<.0001)*-0.22 (<.0001)*-0.23 (0.1203)0.10
DISPLAY
Use of
Spirometry Testing in Assessment &
Dx COPD (SPR)
251 -4%* -0.22
(<.0001)*
-0.22
(<.0001)*
-.004 (0.9676)
* Statistically significant at 95% confidence level (p-value in parenthesis).
25
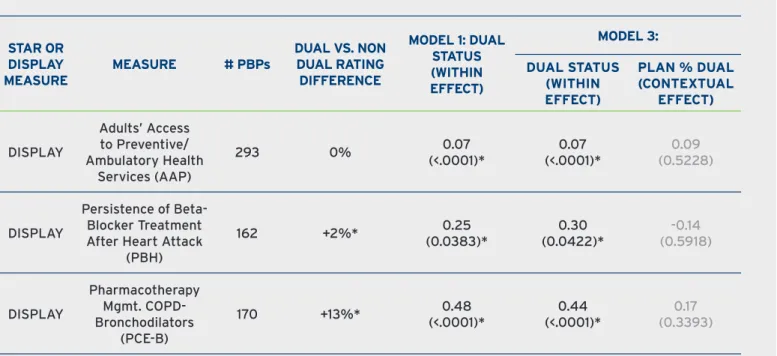
The dual status effect was positive and significant for three Star Display Measures in both Model 1 and Model 3 (see Table 4). The positive relationship indicates that these outcomes were better for dual eligible members than for non-dual eligible members within the same plan benefit package, regardless of the percent of dual eligible members in the plan. The aggregate results shown in Figure 1 showed no significant difference in overall rates between dual eligible members and non-dual eligible members on the access-to-care measure, “Access to Preventive/Ambulatory Health Services (AAP)”. The results of this analysis show that within the same plan benefit package, dual eligible members performed better on the access to care measure, indicating that dual eligible members have similar or better access to care as non-dual eligible members within the same plan. Dual eligible members also had better outcomes both overall and within the same plan benefit package on two other treatment measures (see Figure 1 and Table 4). The contextual effect was insignificant for all three measures.
STAR OR DISPLAY MEASURE
MEASURE # PBPs
DUAL VS. NON DUAL RATING
DIFFERENCE
MODEL 1: DUAL STATUS (WITHIN EFFECT)
MODEL 3: DUAL STATUS
(WITHIN EFFECT)
PLAN % DUAL (CONTEXTUAL
EFFECT)
DISPLAY
Adults’ Access to Preventive/ Ambulatory Health
Services (AAP)
293 0% 0.07
(<.0001)*
0.07
(<.0001)*
0.09 (0.5228)
DISPLAY
Persistence of
Beta-Blocker Treatment
After Heart Attack (PBH)
162 +2%* 0.25
(0.0383)*
0.30
(0.0422)*
-0.14 (0.5918)
DISPLAY
Pharmacotherapy Mgmt. COPD-Bronchodilators
(PCE-B)
170 +13%* 0.48 (<.0001)*
0.44
(<.0001)*
0.17 (0.3393)
* Statistically significant at 95% confidence level (p-value in parenthesis).
26
Conclusions
Across three sampling methods and three statistical models, five of eight Star Measures and three Star Display Measures show a consistent statistically significant negative effect of member dual status on outcomes. Dual eligible members have worse outcomes on these measures than non-dual eligible members within the same plan benefit package, regardless of the percent of dual eligible members in the plan.
These results indicate that worse performance of dual eligible members on these measures cannot be attributed to the quality of care provided by the plan. If the disparity was related to individual plan benefit package performance, we would have observed similar results between dual eligible members and non-dual eligible members within the same plan (i.e., the dual status effect would not be significant). If the disparity in member outcomes was related to the higher population of dual eligible members in the plan, we would have observed a significant contextual effect, which was not found in the majority of measures evaluated. Thus, in these analyses, lower performance of dual eligible members was not statistically related to enrollment in lower-performing plans.
These findings are especially important for Plan All-Cause Readmission rates, where the existing risk adjustments for age, gender and chronic conditions do not fully correct for the effect of dual status—a dual eligible member is at higher risk for readmission compared to a non-dual eligible member with the same demographic characteristics and same chronic conditions. This suggests that the adjustments included in the readmission rates reported for MA plans do not fully capture all of the risk factors associated with dual eligible members having a greater likelihood of readmission. Moreover, the likelihood of readmission was not statistically associated with the percent of dual eligible members in the plan indicating that having a higher proportion of dual eligible members in a plan benefit package does not impact outcomes in dual eligible members differentially.
27
MULTIVARIATE ANALYSES
Objective
The objective of this large-scale member-level multivariate analysis was to identify patient clinical, sociodemographic, and community resource factors underlying the observed disparity in quality-of-care outcomes between dual eligible and non-dual eligible members of MA plans. Using new sources of data on sociodemographic and community resource availability, these analyses uniquely explore the degree to which identified risk factors contribute to the performance gaps identified in the Inovalon 2013 and 2014 reports.
Methods
The differences in quality measure rates between dual eligible members and non-dual eligible members were analyzed using the Blinder-Oaxaca decomposition technique.17,18
This technique has been used in previous research-investigating disparities in healthcare.19,20,21,22,23 The decomposition approach breaks down the difference in measure
rates into two components that include (1) the “explained” proportion of the gap attributed to differences in the prevalence of characteristics associated with a higher likelihood of a worse outcome (e.g., to what degree does the higher prevalence of disabled individuals in the dual eligible population contribute to the difference in outcomes between the two groups?); and (2) the “unexplained” proportion of the gap attributed to the differential impact of the characteristic on dual eligible members compared to non-dual eligible members. A detailed technical description of the methodological approach is included in Appendix E.
Outcome Measures (Dependent Variables)
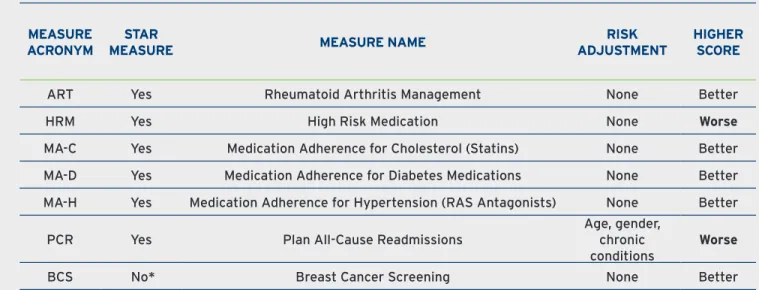
The multivariate analyses focused on six of the eight current Star Measures included in earlier analyses. Two Star Measures were not analyzed due to technical issues.ii 2A multivariate model was also developed for one additional Star Display Measure—Breast Cancer Screening—because this measure is expected to be returned to the Five-Star Rating System in 2016. Thus a total of seven measures were evaluated using a comprehensive multivariate decomposition approach (see Table 5; detailed definitions for the measures are included in Appendix B).
ii We did not attempt to model Diabetes Treatment (BPD) as this measure was retired in 2014 by the measure developer, the Pharmacy Quality Alliance (PQA), due to changes in evidence-based practice guidelines. We did not model Osteoporosis Management in Women Who Had a Fracture (OMW) due to the instability of this measure and sensitivity to small changes in the denominator population.
28
Member-level outcome scores for each of these measures were calculated and used as the dependent outcome variables in the models.
Explanatory Variables (Independent Variables)
All member characteristics in the study database deemed potentially associated with the measure outcome (including clinical, sociodemographic, geographic, and community resource factors) were examined. First, bivariate analyses were conducted to test which potential explanatory variables were independently associated with the outcome. Second, variables found to be statistically significant (p-value ≤ 0.05) were then included and tested in the multivariate regression model. Finally, the variables in the final model were reviewed for clinical relevance or a conceptual relationship to the outcome (consistent with National Quality Forum criteria).
Results
Differences in clinical, sociodemographic and community resource characteristics between dual eligible and non-dual eligible members accounted for 70% or more of the performance gap observed in the seven Star Measures analyzed. Sociodemographic characteristics were consistently a main contributor to the performance gaps, explaining at least 30% or more of the observed disparities in outcomes. These results indicate that if these Star Measures were statistically adjusted for the risk factors found to be significantly associated with worse outcomes, the observed disparities in Star Measure scores could be reduced by 70% or more.
MEASURE ACRONYM
STAR
MEASURE MEASURE NAME
RISK ADJUSTMENT
HIGHER SCORE
ART Yes Rheumatoid Arthritis Management None Better
HRM Yes High Risk Medication None Worse
MA-C Yes Medication Adherence for Cholesterol (Statins) None Better MA-D Yes Medication Adherence for Diabetes Medications None Better MA-H Yes Medication Adherence for Hypertension (RAS Antagonists) None Better
PCR Yes Plan All-Cause Readmissions
Age, gender, chronic conditions
Worse
BCS No* Breast Cancer Screening None Better
*Will be included in 2016 Star Rating System per CMS 2016 Call Letter issued Nov. 21, 2014.
29
The proportion of the disparity explained was less than 100% for four measures—Plan All-Cause Readmissions (PCR), rheumatoid arthritis management (ART), high risk medications (HRM) and breast cancer screening (BCS). An explained proportion less than 100% indicates that while 70% or more of the disparity observed for these measures was attributed directly to the difference in the prevalence of risk factors associated with the outcome, there was a remaining “unexplained” portion of the gap attributable to the differential impact of the risk factor on dual eligible members.
The explained proportion of the disparity was greater than 100% for the three Medication Adherence Measures analyzed—Cholesterol (MA-C), Diabetes (MA-D), and Hypertension (MA-H). An explained proportion greater than 100% indicates that, after controlling for risk factors associated with higher likelihood of non-adherence, MA plans do a better job achieving compliance with medication adherence in dual eligible members than in non-dual eligible members with similar risk profiles. This is due in part to the fact that non-dual eligible members have more outpatient visits on average compared to non-dual eligible members, and more office visits are associated with better medication adherence as shown in the Member-Level Analysis published by Inovalon in 2014.
These results indicate that if the three Medication Adherence measures were statistically adjusted to control for the differences in characteristics associated with non-adherence, the adjusted rates for MA plans with a high proportion of members with those characteristics would be higher (better) and adjusted rates for MA plans with relatively fewer members with these risk factors would be lower (worse) compared to currently reported rates. Since these Medication Adherence measures have no statistical adjustments for factors associated with lower adherence scores, and these factors are more prevalent in dual eligible members, reported Star Ratings do not reflect this quality-of-care difference. Because these measures are triple-weighted in the Star Rating System, the failure to adjust for these differences has three times the impact on Star Ratings of MA plans serving a large proportion of dual eligible members.
Results of the decomposition analyses are summarized below; complete results are presented in Appendix F.
Plan All-Cause Readmissions (PCR) is defined as the percentage of MA members 65
years or older discharged from an acute care hospital and readmitted for any diagnosis within 30 days of discharge. A total of 32,563 index discharges in 2013 (28.9% dual; 71.1% non-dual) were included in the analysis. The unadjusted readmission rate was 13.4% higher in dual eligible members compared to non-dual eligible members (16.9% vs. 14.9%).iii
30
The decomposition analysis found that differences in the prevalence of risk factors for readmission accounted for 81.8% of the disparity in readmission rates between dual
eligible and non-dual eligible members (see Figure 2). If dual eligible and non-dual
eligible members had similar characteristics—or if the measure was statistically adjusted to account for these factors—82% of the observed disparity could be mitigated. The 18% of the disparity in rates not explained by these factors can be attributed to the differential impact of the risk factors on dual eligible members. These risk factors affect risk of readmission for all MA members, but the dual eligible population and MA plans serving a relatively larger proportion of members with these characteristics will be impacted more overall.
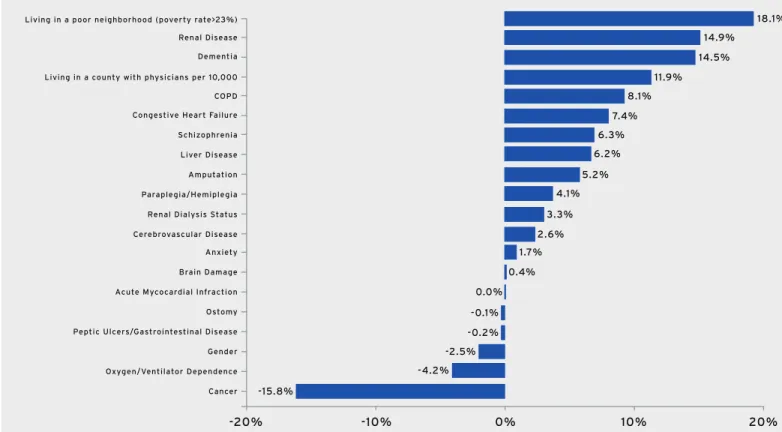
Contribution of Factors Associated with Risk of Readmission:
• Differences in the prevalence of 17 chronic conditions explained 54.3% of
the disparity (see Figure 3). These conditions were significantly associated with
readmission after controlling for other patient characteristics.
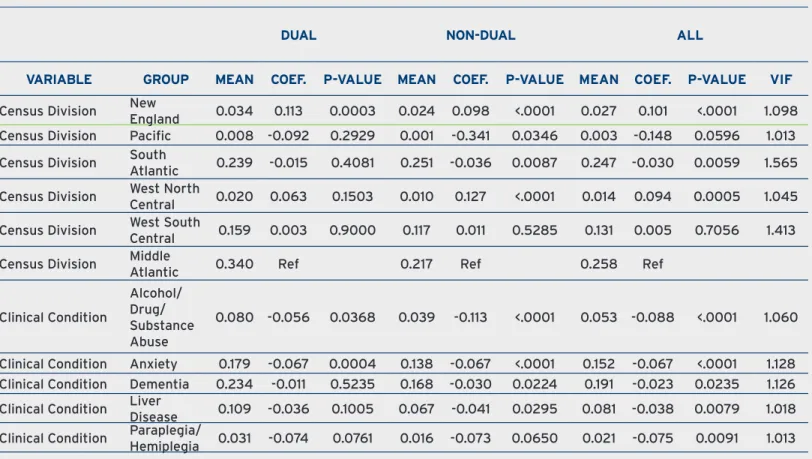
• Differences in the prevalence of three sociodemographic factors explained 27.5%
of the disparity (see Figure 4). Two sociodemographic factors explained 30.0% of
the gap—living in a county with a physician shortage and living in a high-poverty neighborhood—but differences in gender composition reduced the gap by 2.5% since fewer dual eligible members are male, and males have a higher risk of readmission. Importantly, one sociodemographic factor—living in a poor neighborhood—contributed more than any other risk factor to the disparity in readmission rates. This characteristic explained 18.1% of the observed performance gap between dual eligible members and non-dual eligible members (see Figure 2). This is attributed to the difference in prevalence—41.2% of dual members live in a poor neighborhood compared to only 15.8% of non-dual eligible members (see Figure 5).
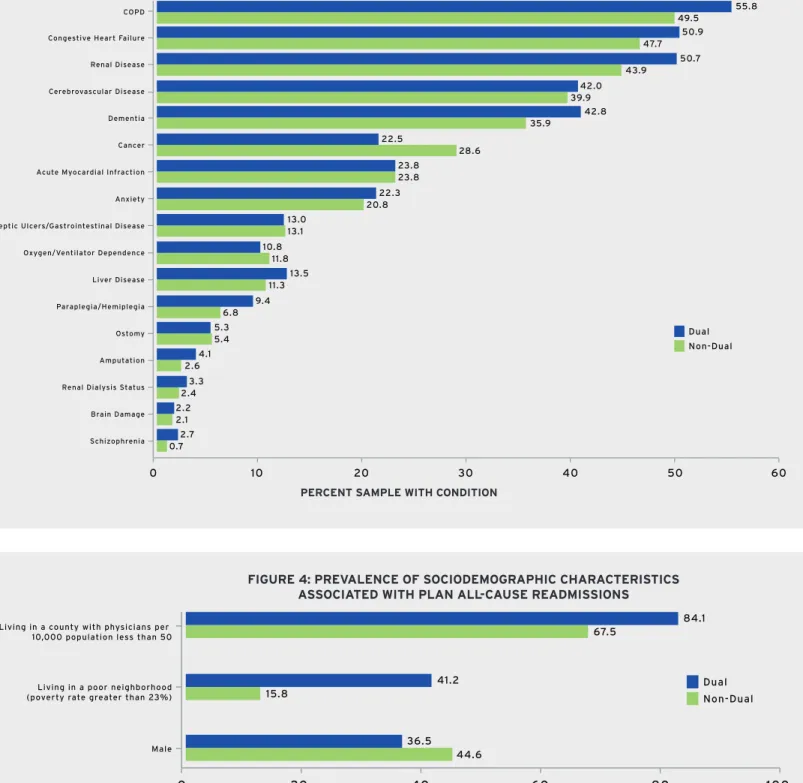
The chronic condition contributing most to the disparity in readmission rates was renal disease. Renal disease is more prevalent in dual eligible members (50.7% vs. 43.9%), and the difference in prevalence explained 14.9% of the performance gap. Dementia was the next most important chronic condition associated with readmission likelihood. Dementia is more prevalent in dual members (42.8% vs. 35.9%) and explained 14.5% of the gap. A second sociodemographic factor—living in a county designated as having a physician shortage (i.e., less than 50 physicians per 10,000 people)—explained 11.9% of the gap. A higher percentage of dual eligible members live in these areas compared to non-dual eligible members (84.1% vs. 67.5%). This community resource factor impacts likelihood of MA members being re-hospitalized and is out of the control of the health plan.
31
Several factors tend to reduce the readmission rates gap. Having a diagnosis of cancer is associated with higher risk of hospital readmission, but cancer is more prevalent in non-dual eligible members (28.6% vs. 22.5%) (see Figure 3). The decomposition results show that statistically adjusting readmission rates for cancer would increase the performance gap by 15.8%. The lower prevalence of males among dual eligible members also reduces the gap (36.5% vs. 44.6%).
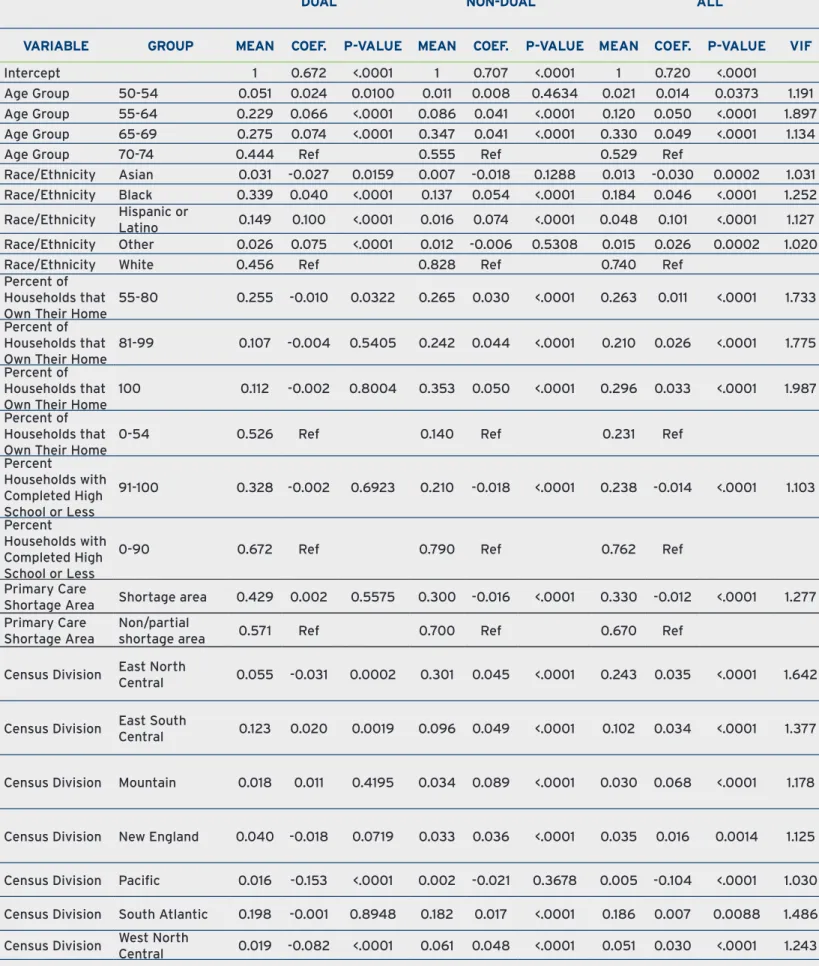
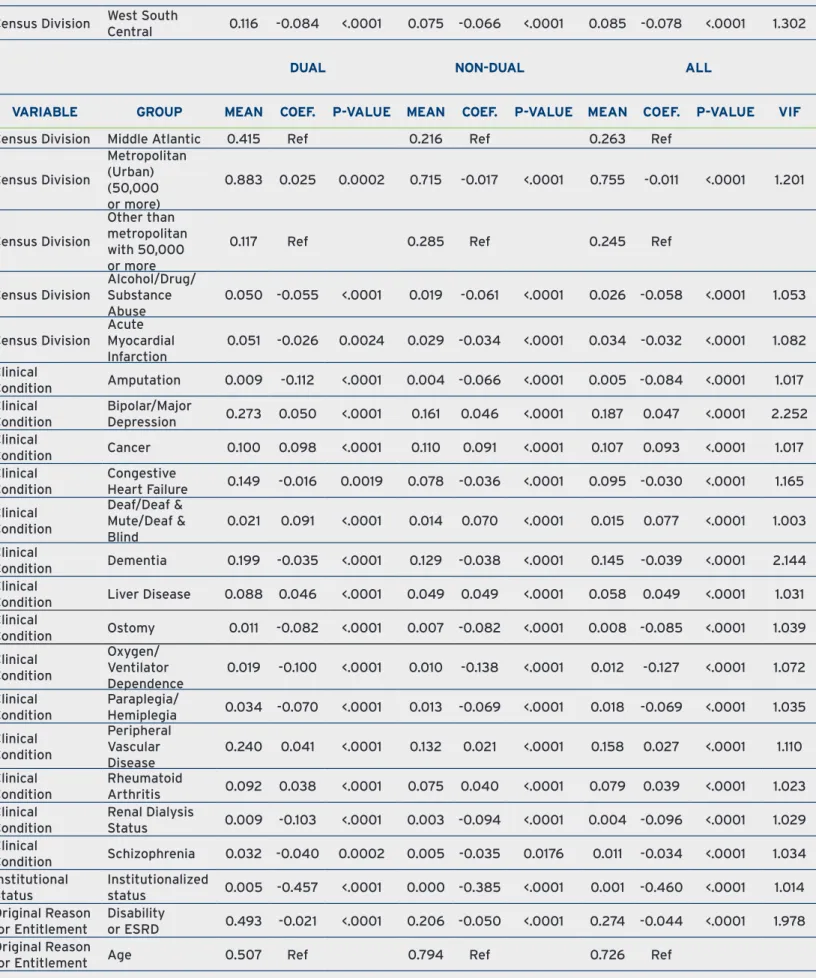
The detailed analytic results for the covariates associated with higher rates of readmission are presented in Table 13 in Appendix F. The means represent the prevalence of the factor within each group; for example, 36.5% of dual eligible members are male compared to 44.6% of non-dual eligible members. The difference in prevalence of these covariates between dual eligible members and non-dual eligible members result in the explained component of the disparity in the decomposition analysis.
The coefficient estimates quantify the differential impact of the covariates on dual eligible members compared to non-dual eligible members. This comprises the unexplained component of the disparity in the decomposition analysis. The interpretation of the coefficient within a cohort group (e.g., among dual eligible members) shows the increased risk for a member with the characteristic to have the outcome compared to a member in the same group who does not have the characteristic, after controlling for other risk factors. For example, within dual eligible members, the probability of readmission was 0.052 points higher for a dual member with dementia than for a similar dual member who did not have dementia (see Table 13).
Comparing the coefficients between the two cohort groups, the difference in coefficient values measures the differential impact of the covariate on dual eligible members compared to non-dual eligible members. For example, the section above indicated that the coefficient estimate for dementia for dual eligible members was 5.2% (0.052). The coefficient estimate for dementia for non-dual eligible members was 4.0% (0.040), indicating that a non-dual eligible member with dementia is also more likely to be readmitted, but is 1.2% percentage points less likely than a dual eligible member with dementia to be admitted (0.040 minus 0.052 = -0.012 differential impact of dementia on dual eligible members compared to non-dual eligible members), holding all other characteristics constant.
The summary of the explained and unexplained contributions of the various risk factors to the performance gap for readmissions is shown in Table 14 in Appendix F.
Dissecting the impact of the largest contributor to the performance gap is an interesting example. The fact that more dual eligible members live in a poor neighborhood (41.2% vs. 15.8% as shown in Table 13) explains 18.1% of the disparity in readmission rates. However, the differential impact of this sociodemographic factor is actually larger for non-dual eligible members—i.e., the coefficient is 1.6% for non-dual eligible