WAN Optimization in Vantage
Getting Started Guide
Release 11.6Please direct questions about Vantage for Real User Monitoring or comments on this document to:
Compuware Customer Support
Compuware Corporation Customer Support Hotline
1-800-538-7822
FrontLine Support Login Page: http://go.compuware.com
For telephone numbers in other geographies, see the list of worldwide Support Offices at http://go.compuware.com.
Access is limited to authorized users. Use of this product is subject to the terms and conditions of the user’s License Agreement with Compuware Corporation. Documentation may be reproduced by Licensee for internal use only. All copies are subject to the terms of this License Agreement. Licensee agrees to provide technical or procedural methods to prevent use of the Software and its documentation by anyone other than Licensee.
Copyright © 2011 Compuware Corporation. All rights reserved. Unpublished rights reserved under the Copyright Laws of the
United States.
U.S. GOVERNMENT RIGHTS—Use, duplication, or disclosure by the U.S. Government is subject to restrictions as set forth in Compuware Corporation license agreement and as provided in DFARS 227.7202-1(a) and 227.7202-3(a) (1995), DFARS 252.227-7013(c)(1)(ii) (OCT 1988), FAR 12.212(a) (1995), FAR 52.227-19, or FAR 52.227-14 (ALT III), as applicable. Compuware Corporation.
This product contains confidential information and trade secrets of Compuware Corporation. Use, disclosure, or reproduction is prohibited without the prior express written permission of Compuware Corporation. Access is limited to authorized users. Use of this product is subject to the terms and conditions of the user’s License Agreement with Compuware Corporation.
ApplicationVantage, ClientVantage, Compuware, FrontLine, NetworkVantage, ServerVantage, Vantage, Vantage for Java and .NET Monitoring, VantageView, Gomez, First Mile, and Gomez Private Network are trademarks or registered trademarks of Compuware Corporation.
Cisco is a trademark or registered trademark of Cisco Systems, Inc.
Internet Explorer, Outlook, SQL Server, Windows, Windows Server, and Windows Vista are trademarks or registered trademarks of Microsoft Corporation.
Firefox is a trademark or registered trademark of Mozilla Foundation.
Red Hat and Red Hat Enterprise Linux are trademarks or registered trademarks of Red Hat, Inc. J2EE, Java, and JRE are trademarks or registered trademarks of Oracle Corporation.
VMware is a trademark or registered trademark of VMware, Inc.
Adobe® Reader® is a registered trademark of Adobe Systems Incorporated in the United States and/or other countries.
All other company and product names are trademarks or registered trademarks of their respective owners.
Contents
5
Chapter 1 ∙ WAN Optimization. . . .
7
Chapter 2 ∙ WAN Optimization Adjustment in Vantage. . . .
8 WAN Optimization Controller Support. . . .
9 Deployment Models. . . .
9 Single Sniffing Point Definition. . . .
10 Double Sniffing Point Definition (LAN optimized). . . .
11 Double Sniffing Point Definition (LAN). . . .
12 AMD Sniffing Points Configuration for WAN Optimization. . . .
13 WAN Optimization Setup Verification. . . .
14 Configuring Vantage to Recognize Optimized WAN Traffic. . . .
15 WAN Optimization and SSL. . . .
16 WAN Optimization Configuration Summary. . . .
17
Chapter 3 ∙ Using Cisco Network Analysis Module in Vantage for Real User Monitoring. . . .
18 Special Considerations for Using NAM in Vantage for Real User Monitoring. . . .
20 Configuring VAS to Receive Data from NAM. . . .
22 Attaching Cisco Network Analysis Module to VCAEUE Console. . . .
23 Configuring NAM 5. . . .
25 Attaching NAM to VAS. . . .
26 Scalability and Capacity Considerations. . . .
26 Using NAM to Report Voice and Video Statistics in RUM. . . .
28 Using NAM to Report Optimized WAN Statistics in RUM. . . .
31
Chapter 4 ∙ WAN Optimization Reports. . . .
32 Optimized WAN Environment Performance Overview - Sites Report. . . .
34 Optimized WAN Environment Performance Overview - Software Services Report. . . .
34 Optimized WAN Environment Performance Overview - Links Report. . . .
35 WAE - LAN and WAN Comparison Report. . . .
36 WAE - Software Services Performance Report. . . .
36 WAN Optimization Adjustment in Link View Report. . . .
37
Appendix A ∙ Metrics Related to WAN Optimization Adjustment. . . .
38 Altered Perspective Reports. . . .
41
Appendix B ∙ Known Restrictions in WAN Optimization Support. . . .
C H A P T E R 1
WAN Optimization
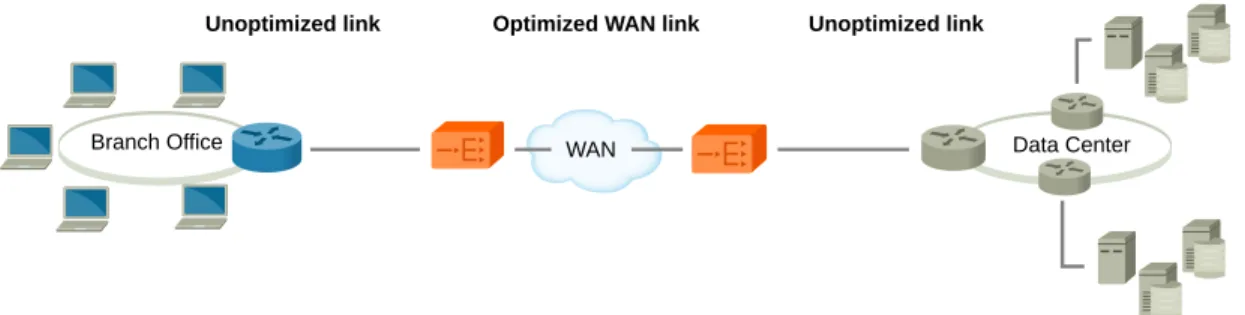
Corporate branch offices are often widely dispersed geographically and depend on efficient Wide Area Network (WAN) links to access resources and applications at a main datacenter or other branches. To this end, WAN optimization was developed to reduce the load on WAN connections between data centers, servers, and clients.
The goal of WAN optimization is to improve application response time and reduce the required bandwidth over a WAN connection by using a WAN controller on each end of the WAN link. A WAN accelerator is deployed on either end of a WAN connection to optimize the traffic sent over the WAN. The WAN accelerator classifies, prioritizes, and compresses network data, caches network traffic, and streamlines protocols to maximize the performance of a service delivered over distributed network.
WAN optimization controllers (WOCs) are physical devices that transparently intercept local network traffic, optimize it, and send the optimized traffic over the WAN link to the receiving controller. On the other side of the WAN, the receiving WOC transparently converts the optimized traffic from the WAN link into normal network traffic.
The typical WAN optimization scenario involves at least two WOCs located between the data center (or a server) and a branch office (or a client).
Figure 1. WAN optimization concept
Branch Office WAN Data Center
Optimized WAN link Unoptimized link Unoptimized link
The most common optimization techniques involve: • Transport (TCP) optimization
Fast error recovery Mitigated slow-start Window scaling
Pre-established TCP connection pools between the WAN-optimizing appliances • Payload Optimization
The TCP payload is indexed and stored on disk on each side of the WAN: Data segments (blocks) are replaced with references to this data Byte-level indexing is independent of the application or file • Application Optimization
Application-specific acceleration is used to reduce application traffic. In Common Internet File System (CIFS) SMB emulation is used: By spoofing the CIFS protocol
By reading ahead and writing behind
• Specific modules can be made available from individual vendors for a specific application Using a combination of these techniques and setting up the acceleration appliances to act as proxy servers, end-user experience can be accelerated significantly.
NOTE
Application optimization monitoring is not supported in the current version of Vantage. Chapter 1 ∙ WAN Optimization
C H A P T E R 2
WAN Optimization Adjustment in Vantage
WAN optimization adjustment in Vantage is designed to make your Vantage implementation aware of WAN optimization in the network and able to rectify measurements that might be skewed by optimization.
Vantage is capable of collecting and reporting numerous metrics based on monitored network traffic within your network infrastructure. When these metrics are used in an optimized WAN environment, however, their calculations must be adjusted to account for the presence of WAN optimization. Vantage does so by detecting optimized traffic on WAN links and recalculating network metrics respecting WAN optimization.
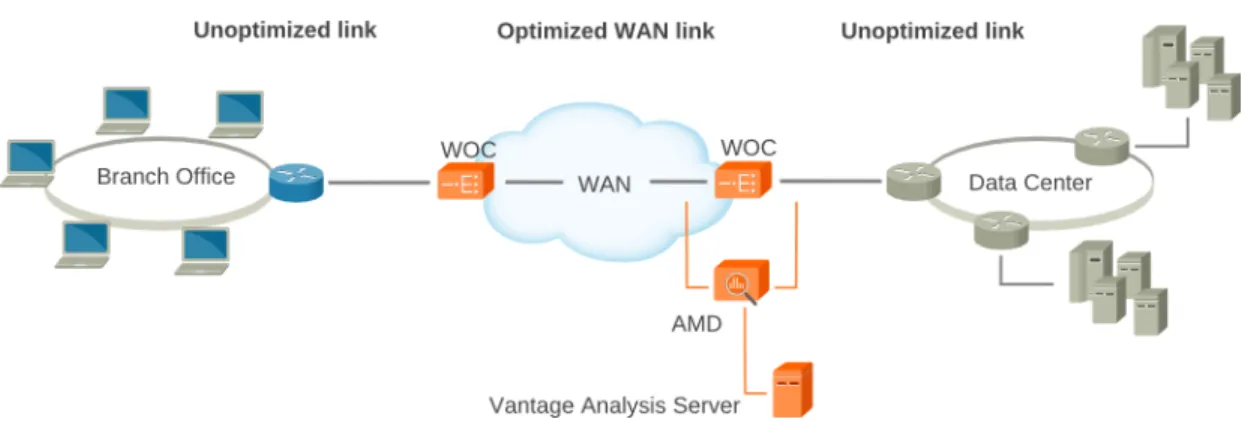
AMD deployment
The following deployment, in which an AMD is connected on both sides of the data center WOC, makes it possible to observe the network traffic before and after it is optimized. This deployment requires the ports destined for WAN optimization to be spanned on both sides of the WOC so the traffic destined for optimization and traffic already optimized is available to the AMD. With this information, Vantage is able to correlate WAN packets and adjust metrics by utilizing the Application Delivery Channel Delay (ADCD) metric.
Figure 2. Single AMD monitoring both sides of a WAN optimization controller
The transaction measurements performed on an unoptimized link are adjusted based on measurements taken on the optimized link. In protocols involving more than one operation in a single connection, the AMD correlates optimized packets with operations.
Using this single AMD configuration, Vantage performs the following adjustments: • Correlate WAN packets
The report server correlates WAN packets belonging to a specific transaction. • Introduce the Application Delivery Channel Delay metric.
If protocol or application traffic does not allow for packet correlation, Vantage uses the ADCD metric to adjust network and WAN metrics.
NOTE
WAN Optimization metrics added to the standard DMI report may alter the values of certain metrics. For example, a report displaying Total bytes for a specific software service, will display a different value for the same Total bytes metric if that report contains metrics associated with optimized WAN. Adding a WAN Optimization metric to the report widens the perspective of that report and as such, the report then displays the WAN Optimization metrics combined with values observed locally. As a result, a duplication of some metric values occurs.
WAN Optimization Controller Support
Vantage 11.6 supports the physical in-path deployment of Riverbed Technology's Steelhead WAN optimization controller (WOC) and Cisco Wide Area Application Services (WAAS). The in-path deployment requires that the WOC be connected to the LAN-side device (datacenter backbone switch) and the corresponding WAN-side device (router). This deployment model is reflected in the AMD configuration scenario as a solution for WAN optimization adjustment in Vantage. For more information, see AMD deployment [p. 7].
Riverbed
WAN optimization support has been thoroughly tested against physical Steelhead appliances. In addition, tests against Steelhead Mobile, a software equivalent of the WOC for end users, have also been conducted, but in a narrower range.
Vantage for Real User Monitoring supports usage of the Web cache communications protocol (WCCP) where Riverbed Steelhead appliances are connected to a switch in the path of the network flow between the servers and the clients.
Vantage for Real User Monitoring also supports deployments in which the Riverbed Interceptor redirects traffic to a cluster of Riverbed Steelheads. This deployment requires that the Riverbed Interceptor device be deployed physically in-path; otherwise, Vantage would not be able to provide correct measurements.
For details on deployment models for your Steelhead appliances, please refer to your Steelhead documentation.
Cisco
WAN optimization support has been thoroughly tested against physical Cisco WAAS appliances. The following deployments are supported :
WCCP (default deployment for WAAS); physical in-path, also know as inline.
Vantage 11.6 supports Cisco WAN optimization using a generic analyzer to calculate the ADCD metric. ADCD is approximated using the WAN RTT value.
Unsupported deployments
The following deployments are not supported: • Out-of-path
• Virtual in-path: ◦ Layer-4 switch ◦ Hybrid
◦ Policy-based routing (PBR)
In addition, Cisco WAAS as router modules are not supported.
Deployment Models
Identification of a WAN sniffing point is only the minimum required configuration to obtain WAN optimization measurements. You should provide as much additional information as possible about your optimized WAN environment to achieve precise measurements.
Configuration of sniffing points 2 and 3 is optional, but identifying at least one of these points allows you to gather specific traffic for more precise measurement and to improve performance of traffic analysis.
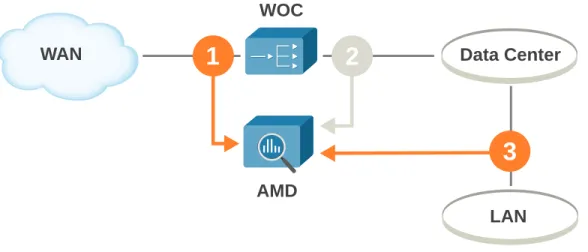
Single Sniffing Point Definition
This configuration enables you to configure only the optimized WAN sniffing point, and classifies the rest of the traffic located on the LAN side of the WOC as regular LAN traffic. However, traffic on the LAN side that is matched with the traffic on the WAN side is classified as LAN optimized. This configuration requires minimal knowledge of the traffic that is being observed, but it depends on automatic detection and matching of optimized WAN and LAN traffic, and this may be inadequate for certain applications.
Figure 3. Minimal configuration for WAN optimization monitoring
LAN
WAN
WOC
AMD
Data Center
1
2
Configuration with one defined point
This configuration states that traffic observed on interfaces eth0 and eth1 will be considered optimized WAN traffic, while any other traffic by default will be considered LAN traffic.
Table 1. Single sniffing point
Point 3 Point 2 Point 1 Definition My optimized WAN traffic Name eth0 Interfaces eth1 VLAN MPLS
Double Sniffing Point Definition (LAN optimized)
In this scenario, each defined sniffing point is located on each side of the WOC. Sniffing point 1 monitors the optimized traffic and matches the data with unoptimized traffic observed on sniffing point 2. Using the sniffing point 2 definition, you can filter the traffic that you expect to be optimized. This, along with observed traffic on sniffing point 1, will present the
measurement data for your WAN optimization environment. Chapter 2 ∙ WAN Optimization Adjustment in Vantage
Figure 4. Monitoring scenario with two sniffing points defined
WAN
WOC
AMD
Data Center
LAN
1
2
3
Configuration with defined points for optimized WAN and optimized LAN This configuration states that traffic tagged VLAN 102 and 104 will be considered optimized WAN traffic and traffic observed on eth2 will be considered as regular LAN traffic that has been optimized. The rest of the observed traffic will be considered regular LAN traffic.
Table 2. Double sniffing point (LAN optimized)
Point 3 Point 2
Point 1 Definition
My Data Center traffic My optimized WAN traffic Name eth2 Interfaces 102, 104 VLAN MPLS
Double Sniffing Point Definition (LAN)
Use a configuration like this to separate the optimized LAN traffic from the rest of your LAN traffic. This can be achieved by specifying sniffing point 3. This configuration isolates a segment of your LAN that you do not expect to be optimized; its traffic, therefore, does not need to be correlated with the optimized traffic. This makes it possible to identify the traffic relating only to clients utilizing the connections that are not optimized and at the same time to identify the rest of the traffic as relating only to clients utilizing the connections that are optimized.
Figure 5. Monitoring configuration separating a segment of unoptimized LAN from optimized LAN
AMD
WOC
LAN
Data Center
WAN
1
2
3
Configuration with defined points for optimized WAN and regular LAN
In this configuration, traffic observed on interface eth1 is considered optimized WAN traffic, while traffic observed on interface eth2 is considered regular LAN traffic. The rest of the traffic is considered LAN optimized.
In the event that no traffic is observed on either eth1 or eth2, the tagged VLAN traffic will be classified respectively: VLAN 102 for eth1 as WAN optimized, and VLAN 104 for eth2 as regular LAN traffic. The rest of the traffic will be considered LAN optimized.
Table 3. Double sniffing point (LAN)
Point 3 Point 2
Point 1 Definition
My corporate LAN traffic My optimized WAN traffic Name eth2 eth1 Interfaces 104 102 VLAN MPLS
AMD Sniffing Points Configuration for WAN
Optimization
A sniffing point is a point in your network architecture where the AMD can monitor traffic.
Sniffing points A sniffing point can be:
1. A point where optimized WAN traffic is expected.
2. A point where optimized WAN traffic is already converted to LAN traffic. Chapter 2 ∙ WAN Optimization Adjustment in Vantage
3. A point within your LAN infrastructure that can be used to exclude a LAN segment to achieve more accurate WAN optimization measurements.
For each sniffing point you define, you need to provide one of the following to identify the type of traffic being monitored:
This is the human-readable name you give the sniffing point. If you do not provide a name, the AMD populates the name with a generic string indicating the type of sniffing point.
Name
Network interfaces monitoring traffic on a particular sniffing point. The list of interfaces available is automatically retrieved from the configured AMD.
Interfaces
Use commas to separate multiple VLAN identifiers.
VLAN
Virtual links between distant network nodes identified by a label carried within the MPLS header. Use commas to separate multiple labels.
MPLS
Sniffing point detail priority
The components of a sniffing point configuration have an order of precedence that corresponds to their positions on the screen from top to bottom:
• If you specify interfaces, the AMD uses them to identify the traffic on the sniffing point. • If you do not specify interfaces, the AMD uses the VLAN identifier.
• If you do not specify any of the above, the AMD uses the MPLS label.
WAN Optimization Setup Verification
After WAN optimization-related configuration is completed, your AMD will begin to observe the WAN traffic immediately and WAN optimization reports will present the metrics related to optimized WAN.
To verify that your configuration of RUM is monitoring and reporting you WAN optimization traffic, examine any of the reports available from the Client optimized network link in the
Multi-Tier View report.
Go to Applications ➤ Multi-Tier View and click Client optimized network in the Network
tiers section of the report. You will drill down to the Optimized WAN Environment
Performance Overview - Sites report, where you can immediately examine the Total bytes compression and Percentage of optimized traffic (bytes) metrics. For more information, see Optimized WAN Environment Performance Overview - Sites Report [p. 32].
These metrics, containing positive percentage, indicate that your WAN optimization is recognized by RUM and is actively monitored. You can examine the rest of the WAN optimization-related reports by choosing the appropriate tab:
Optimized WAN Environment Performance Overview - Software Services
All Software Services
For more information, see Optimized WAN Environment Performance Overview - Software Services Report [p. 34].
Optimized WAN Environment Performance Overview - Links All Links
For more information, see Optimized WAN Environment Performance Overview - Links Report [p. 34].
Optimized WAN Environment Performance Overview - LAN and WAN Comparison
LAN / WAN Comparison
For more information, see WAE - LAN and WAN Comparison Report
[p. 35]. NOTE
If the Total bytes compression metric contains a negative percentage value, and Percentage of optimized traffic (bytes) contains 0%, refresh the report after several reporting intervals have passed. Many of the WAN optimization metric calculations are based on historical measurements, for which each reporting interval adds to the history. It is recommended that WAN optimization reports be examined 30 minutes or more after the configuration has taken effect.
Configuring Vantage to Recognize Optimized WAN
Traffic
All AMDs that monitor network traffic using WAN optimization must be configured before Vantage can automatically recognize optimized WAN traffic. VCAEUE Console will help you to configure and propagate the configuration to all your AMDs.
Prerequisites
It is good practice to have the following information handy during configuration: • The deployment model of your WAN optimization.
• The manufacturer of your WOCs.
• The details for each of the sniffing points being used in the WAN optimization solution. • The AMD physically connected to the network infrastructure as shown in AMD deployment
[p. 7].
It is assumed that you have a computer running VCAEUE Console with which you are able to connect to the AMD responsible for monitoring WAN and LAN traffic within your WAN optimization environment.
It is also assumed that you are familiar with the concept of configuration types and are able to publish the configuration to the specific AMD.
Note that to view data for optimized WAN links on the RUM Overview report, you must have the Enterprise VAS personality license.
To make Vantage aware that it is operating in an optimized WAN environment and collect measurements from such an environment, perform the following steps:
1. Open the AMD Configuration for the device that will be monitoring the WAN optimization. Chapter 2 ∙ WAN Optimization Adjustment in Vantage
In VCAEUE Console, right-click the row for that AMD and select Open Configuration.
2. Click Edit as Draft to enable configuration editing.
3. In the Configuration tree, open Global and click WAN Optimization to display the WAN
optimization screen.
4. Select the Enable WAN optimization adjustment check box.
5. In the Deployment model section, select one of the predefined deployment models for your WAN optimization.
6. Select a WAN acceleration engine vendor.
7. In the Sniffing points section, enter a Name for each of your sniffing points.
This will enable you to identify your sniffing points while creating and viewing reports.
8. For each of your sniffing points, edit the Interfaces list to indicate the interfaces that correspond to the deployment model.
• To add an interface, click the icon.
• To remove an interface, select it and click the icon.
9. Optional: For each of your sniffing points, enter one or more VLAN IDs of the network
to be observed at this sniffing point. Use commas to separate multiple VLAN identifiers.
10. Optional: For each of your sniffing points, enter the MPLS label of the network to be
observed at that sniffing point. Use commas to separate multiple labels.
11. Click Save and Publish to save your configuration changes and send them to the AMD.
WAN Optimization and SSL
While the typical network and software services can be optimized using standard optimization methods, encrypted network traffic requires special consideration.
Typically, the WAN Optimization Controllers (WOCs), if configured properly, decrypt the SSL network traffic, optimize it, encrypt it again, and send it through the optimized WAN connection. For details on how to configure your WOC for encrypted network traffic, please refer to your WOC manufacturer's guide. Note that WAN optimization of encrypted, secure traffic may result in overall performance decrease for applications using SSL encryption.
Riverbed
Riverbed Technology's Steelhead WOC does not, by default, optimize SSL traffic. It uses pass-through to send encrypted traffic over the WAN connection in the form that it was received from the LAN. This default configuration, which is supported by Vantage, will generate accurate measurements for WAN optimization reports counting the SSL traffic as pass-through (which is indicated by Total bytes on WAN side equaling Total bytes on LAN side for a particular software service).
If the Steelhead WOC is configured to decrypt and optimize SSL traffic, the AMD will approximate ADCD using the RTT value for the particular software service.
Although it is not recommended, some software services use non-standard ports for their SSL traffic. If not configured for such non-standard ports, the WOC will treat the encrypted traffic
as standard network traffic and will attempt to optimize it. As a result, the traffic observed by the AMD on the LAN and WAN sides of the WOC will not be fully matched, and measurements for that communication cannot be matched. The AMD will approximate the ADCD using the RTT value for the particular software service. For example, ADCD for a software service, which generates hits that are not detected on the WAN side, will be approximated using the RTT value.
WAN Optimization Configuration Summary
The following items need to be addressed in order to successfully configure monitoring of the optimized WAN traffic. The configuration will effect both the AMD and VAS report server.
AMD
• Determine user-defined software services’ traffic that is transmitted over optimized WAN.
• Select the vendor of your WOCs.
• Carefully plan deployment and configure SPAN ports that mirror LAN traffic to be transmitted over optimized WAN.
VAS
• Determine remote sites that reside on far ends of the optimized WAN lines. • Designate sites of interest as used-defined links (UDLs).
NOTE
UDLs imported from an external file need to be modified manually in the import file (location-*.config) by setting the Loc_1.udl variable to true.
• The Optimized client network tier is created automatically based on data received from the AMD.
C H A P T E R 3
Using Cisco Network Analysis Module in Vantage
for Real User Monitoring
VAS report servers can accept performance data from data collectors of type Cisco Network Analysis Module (NAM), version 4.2 or later. The devices must be configured and assigned to the report servers, using VCAEUE Console in a similar way as for other types of devices. Configuring data monitoring options on a NAM device can be performed either before or after arranging for the device to be recognized by a VCAEUE Console. Note, however, that the VCAEUE Console provides an option to view NAM data sources or to connect to a NAM Web Console. It may therefore be convenient to follow the order given below:
1. Familiarize yourself with time synchronization and performance issues when using Cisco Network Analysis Module in Vantage for Real User Monitoring. Knowledge of these concepts will enable you to choose correct values for configuration parameters. For more information, see Special Considerations for Using NAM in Vantage for Real User Monitoring [p. 18].
2. Configure the time interval at which VAS should interrogate NAM devices and at which it should generate its own data records. For more information, see Configuring VAS to Receive Data from NAM [p. 20].
3. Attach the NAM to the VCAEUE Console. For more information, see Attaching Cisco Network Analysis Module to VCAEUE Console [p. 22].
4. Configure the NAM devices to generate data readable by VAS. For more information, see
Configuring NAM 5 [p. 23].
5. Attach the NAM devices to the VAS installation. For more information, see Attaching NAM to VAS [p. 25].
Alternatively, you can configure your NAM first, as a separate task, by accessing it independently of the VCAEUE Console.
NOTE
A NAM can list many data sources, but they do not all have to be used by the report servers that collect data from the NAM. When you attach a NAM to the VAS, you specify which of the available data sources should be used by the report server. The same NAM can supply data to a number of VAS installations and each one can use different data sources. For more information, see Attaching NAM to VAS [p. 25].
After you have attached your NAM to the VCAEUE Console, the options to view NAM data sources and to access the NAM's Web Console, can be found in the context menu in the Devices view:
• To open the Web Console for a NAM, right-click the NAM in the Devices list and select
Open Cisco NAM Web Console.
• To list the data sources currently defined for the NAM device, select Open Cisco NAM
Data Sources.
Supported NAM appliances
The devices tested to work with VAS include:
• NAM-2220 • NAM-2204 • NAM-2x • NAM-2 • NAM-1x • NAM-1 • NME-NAM-80S • NEM-NAM-120S • WAVE-574 • WAVE-674
Special Considerations for Using NAM in Vantage for
Real User Monitoring
There are a number of configuration and reporting issues that are specific to using Cisco Network Analysis Module in Vantage for Real User Monitoring.
1. Clock (time) synchronization between NAM and VAS
This is one of the configuration steps described in Configuring NAM 5 [p. 23].
2. Eliminating jitter in reported traffic statistics
Jitter can be caused by VAS creating its own data monitoring records from data received for a variable number of NAM report intervals. While the average effect is still the same, the actual data is reported with a large jitter.
To avoid jitter, correct dependencies must be maintained between the following parameters: • the length of the monitoring interval used by VAS
• the length of the report interval used by NAM
• the length of the interval at which VAS interrogates NAM The recommended dependencies are as follows:
• In most cases the length of the report interval used by NAM should be equal to the length of the report interval used by VAS. If there is a danger of data duplication (see below), the length of the report interval used by NAM should be reduced to fit an
integer number of times within the length of the report interval used by VAS. However,
care should be taken not to reduce it too much, else other problems may occur; see other dependencies.
• The length of the interval at which VAS interrogates NAM should fit an integer number
of times (two or more) within the length of the report interval used by VAS. Two is
the recommended value and, care should be taken not to reduce the interrogation interval too much, else other problems may occur; see other dependencies. • The length of the interval at which VAS interrogates NAM should be less than the
length of the report interval used by NAM. The difference between the two values should allow sufficient time for data to be generated by and delivered from NAM to VAS. This, in practice, is at least 20 seconds, but often more.
Therefore, for cases where there is no danger of data duplication:
• Configure the report interval on NAM to be equal to the monitoring interval configured for VAS: The default value is 5 minutes.
• Configure VAS to interrogate NAM at intervals of half that length, that is 2.5 minutes.
3. Reducing data duplication errors in scenarios where there is more than one NAM or AMD device, and some of the traffic is monitored by more than one device
Data duplication can occur for two reasons:
• The same traffic being recognized as a differently named service (application), by two different monitoring devices
• Traffic for the same service (application) name, being counted twice by the report server
The first type of data duplication can be avoided by ensuring that names used by AMD devices for monitored services, agree with the application names used by NAM devices. The second type of data duplication between AMD devices is resolved automatically within Vantage for Real User Monitoring. However, some duplication may occur if the same traffic is being monitored by a number of different NAMs. This error can, however, be reduced by reducing the length of the report interval for all the NAM devices involved. The duplication error will then, on average, be less than half of the NAM report interval. Therefore, if there is a danger of data duplication, you should reduce the size of the report interval for NAM and the length of the interval at which VAS interrogates NAM, in such a way that the dependencies and conditions described in Item 2 [p. 18] are preserved.
4. Precedence of reporting between traffic monitored by AMD and NAM
In cases where data duplication occurs between AMD and NAM, VAS will automatically attempt data de-duplication, and then will award priority to data received from AMD.
5. Ensuring reliable network delay measurements
For NAM devices, all transactions with response time larger than configured RspTimeMax will be considered slow. Because NAM does not report network delay (RTT) for slow responses, setting this value too low may disturb network delay measurements. Setting an appropriate value of RspTimeMax is one of the steps configuring described in Configuring NAM 5 [p. 23].
6. Performing reliable bandwidth usage measurements
Note that for client bytes and server bytes, NAM reports only the TCP payload and does not report TCP header size or size of any headers below the TCP layer. Therefore the reported bandwidth usage will appear lower by that value, as compared to the value reported by AMDs, which include header sizes.
For example, for TCP/IP over Ethernet, the combined size of all the headers will be 54 bytes per packet, and the reported number of bytes transferred will not include this value.
Configuring VAS to Receive Data from NAM
VAS can accept data from different sources, including Cisco NAM. However, NAM is not a RUM component, so VAS must be configured to work with NAM and to know how to interpret the data.
Prerequisites
You should familiarize yourself with issues related to time synchronization and performance as described in Special Considerations for Using NAM in Vantage for Real User Monitoring
[p. 18]. An understanding of these concepts will enable you to choose appropriate values for the corresponding configuration parameters.
You need to have administrative rights to perform configuration steps on the VAS. A set of properties must be tuned to acquire meaningful results in the reports. These properties are accessed on the User properties screen. To access User properties, type:
http://VAS_server/userpropertiesadmin
in the Web browser's Address bar and press [Enter]. The User properties screen enables you to view and modify a large number of report server settings. Select the required setting, enter the required value, and click Set value.
To configure VAS to receive data from NAM:
1. Optional: Configure the length of the interval at which VAS will interrogate NAM
appliances. Choosing a value:
• Use the default value of 150 seconds (2.5 minutes) if the NAM report interval is set to 5 minutes, as it normally would be in situations where it is supplying data to VAS and there is no danger of data duplication.
• To reduce jitter in reported data, the length of the interval at which VAS interrogates NAM should fit two or more times within the length of the report interval used by VAS.
• For information on how to check or modify the value of the NAM report interval, see
Configuring NAM 5 [p. 23].
• For a discussion on advisable report interval values, see Special Considerations for Using NAM in Vantage for Real User Monitoring [p. 18].
The corresponding configuration parameter (NAM_GET_FILE_PERIOD) can be accessed in VAS on the User properties screen.
2. Optional: Configure VAS monitoring interval.
Choosing a value:
• If VAS is also receiving data from one or more AMD devices, the interval at which it will generate its data records will be taken from the AMDs.
• If only NAM appliances are connected, however, you may need to explicitly set the length of the interval or leave it at the default value of 5 minutes.
The corresponding configuration parameter (NAM_ZDATA_PERIOD) can also be modified on the User properties screen.
3. Optional: Enable AMD and NAM traffic deduplication.
Choosing a value:
• If AMD and Cisco NAM monitor the same traffic and the same VAS receives data for software services from these devices, the mechanism for deduplication built in to the report server can be enabled.
• Use NAM_AMD_DEDUPLICATION_VALID_TIME, which you can access on the User
properties screen. This property sets the number of minutes for which the report server
will retain a record of those software service sessions that have been reported by AMDs. During this time, matching sessions reported by Cisco NAM devices will be marked as duplicate and discarded.
You should set this feature to three times the size of the monitoring interval (in minutes). A value of zero disables the deduplication mechanism. You must restart the server to put your changes into effect.
4. Optional: Synchronize RUM service names with NAM application names.
If the same traffic is monitored by AMD devices and NAMs, to avoid data duplication you should ensure that the service names defined for the AMDs are the same as the application names used by NAMs.
The software services and NAM application mapping is configurable by NAM_APPLICATION_MAPPING property on the User properties screen. By default, mapping is turned off. The property has three values:
off
No mapping is effective, NAM application and software service names are mixed and duplication can occur when AMD and NAM monitor the same traffic. cisco-to-cpwr
NAM application names take precedence and all software service names will be given NAM application names as defined in the mapping file.
cpwr-to-cisco
Software service names take precedence and all NAM application names will be renamed to software service names as defined in the mapping file.
You must restart the report server to put your changes into effect.
To synchronize application names reported by NAM appliances and software service names monitored by AMDs, the VAS uses a configuration file stored on the report server's hard disk in the config directory (for example: C:\Program Files\Compuware\VAS\config). The cisco-application-map.properties file contains a mapping of NAM application names to software service names. Each line is a pair of the form:
cisco\u0020app\u0020name=compuware software service name
where the spaces on the left side of the equation must be replaced by the string “\u0020”. The strings are not case sensitive.
You do not need to restart server after changing this file.
Example 1. Sample NAM application names to software service names mapping
Cisco=Compuware
Cisco\u0020name=Compuware name
For information on how to define service names on RUM, see Using AMDs and Java/.NET
Monitoring to Monitor Traffic in the Vantage for Real User Monitoring – System Administration Guide.
Attaching Cisco Network Analysis Module to VCAEUE
Console
You can attach a NAM device to VCAEUE Console using the standard Vantage for Real User Monitoring procedure for attaching a data collecting device.
For more information, see Adding a Device to the Devices List in the Vantage for Real User
Monitoring – System Administration Guide.
Note that:
• You should leave the Secondary IP Address for this Device field empty. • The device type you select should be Cisco NAM.
• After specifying connection details, you need to click Next to proceed to SNMP connection parameters. There you need to enter the read community name and the port number to be used for SNMP communication. This step is mandatory for devices of type NAM. Chapter 3 ∙ Using Cisco Network Analysis Module in Vantage for Real User Monitoring
Configuring NAM 5
Prerequisites
To choose the right values in this procedure, you should be familiar with issues related to time synchronization and performance as described in Special Considerations for Using NAM in Vantage for Real User Monitoring [p. 18].
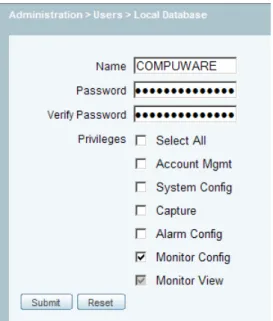
You can designate any user account on your NAM device as the user who VAS will ask for data. This user needs to be granted the Monitor Config privilege so that the special Application host table is available to the NAM and so non-TCP data can be read from it.
Figure 7. Enabling Collection Config privilege on NAM
1. Open the NAM Web Console.
You can connect to your NAM directly by using a browser to open the devices' Web console. Alternatively, if you have already added the NAM to your VCAEUE Console, you can use the context menu in the console's Devices view and select to open the NAM Console from there: right-click the NAM listed in the Devices view and select Open Cisco NAM Web
Console.
2. Configure the NAM report interval length.
Select the Data Aggregation Interval Settings screen Setup ➤ Monitoring ➤ Aggregation
Intervals and define the Short Term Interval values to match the length of the monitoring interval used by the VAS installation you will be connecting to. It is advised that you set
both Traffic/Media and Response Time to the same value as on the VAS.
If data duplication is possible because traffic is being monitored by more than one NAM or AMD, you may need to set NAM report intervals to lower values, though this may degrade performance. It is also important that report interval for the NAM is an integer and that the VAS monitoring interval be a multiple of the NAM report interval. For more
information, see Special Considerations for Using NAM in Vantage for Real User Monitoring [p. 18].
3. Adjust Refresh Interval. Select Administration ➤ Preferences to change Refresh Interval value. Enter the number of seconds equal to your monitoring interval.
4. Define NAM collections for Response Time monitoring.
Vantage for Real User Monitoring obtains data from NAM Response Time monitoring. Therefore, for the data to be available in Vantage for Real User Monitoring, collections for
Response Time monitoring have to be configured on the NAM device and their data sources
indicated.
On the NAM, go to Setup ➤ Monitoring ➤ Response Time to check whether any collections are currently created for Response Time monitoring. Create new collections for the traffic you want to monitor.
5. Specify NAM setup preferences.
In NAM setup preferences, in Administration ➤ Preferences ensure that: • The option to perform IP host resolution is not selected.
• Data is set to display in Bytes.
• International Notation is set to 1,025.72.
6. Ensure time synchronization between NAM and VAS.
The most reliable way to ensure time synchronization is to synchronize both devices to the same source server. To synchronize the NAM with an external time server, use the configuration options provided in the NAM Console, under Administration ➤ System ➤
System Time. For information on how to synchronize VAS to an external time server, see Time Synchronization with an External Time Server in the Vantage for Real User Monitoring – System Administration Guide.
7. Ensure that the time interval at which the VAS will interrogate the NAM is appropriate for the report intervals defined on the NAMs.
This interval should be less than the report interval defined on the NAM, and the difference between those two times should be at least equal to the time required for data generation and transfer from the NAM to the VAS. For more information, see Special Considerations for Using NAM in Vantage for Real User Monitoring [p. 18].
8. Optional: Synchronize RUM service names with NAM application names.
If the same traffic is monitored by AMD devices and NAMs, to avoid data duplication you should ensure that the service names defined for the AMDs are the same as the application names used by NAMs.
For information on how to define application names for a NAM, refer to the NAM documentation, and in particular to the Setting Up the Application chapter of the User Guide
for the Cisco Network Analysis Module Traffic Analyzer.
For more information, see Step 4 [p. 21].
9. Optional: Configure NAM to provide voice statistics to RUM.
Go to Setup ➤ Monitoring ➤ Voice and see if Enable Call Signal Monitoring is selected. Chapter 3 ∙ Using Cisco Network Analysis Module in Vantage for Real User Monitoring
Attaching NAM to VAS
After adding a NAM device to the VCAEUE Console, you can use the VCAEUE Console to attach your NAM to a VAS server. The procedure is in part the same as that for adding other data collectors, though some additional steps are required.
Prerequisites
Attach the NAM device to the VCAEUE Console and configure the NAM to generate data readable by VAS. For more information, see Attaching Cisco Network Analysis Module to VCAEUE Console [p. 22] and Configuring NAM 5 [p. 23].
To attach a NAM to a VAS server:
1. Use the standard Vantage for Real User Monitoring procedure for attaching a data collecting device to a report server.
For more information, see Editing Report Server Configuration in the Vantage for Real
User Monitoring – System Administration Guide. Before you save and publish the server
configuration, you need to perform an extra step of selecting data sources.
2. Select NAM data sources to be used by VAS. NOTE
If traffic information for a particular software service is received from a number of data sources, then:
• Only one data source will be used to generate reports for this service. • The data source will be selected alphabetically.1
• Duplicate data for this service, coming from other data sources, will be discarded. This limitation does not apply to link-based reports (reports for individual data sources), which will always report all of the data for each link (data source).
Note that the above implies that if a given service is seen on a number links (data sources) because of, for example, load balancing, only one data source will be chosen, resulting in partial loss of data.
To select data sources, in the VAS Server Configuration window, right-click the NAM device and use the context menu to perform one of the two possible actions:
• Select individual data sources:
Click Configure Cisco NAM Data Sources to open the Data Sources wizard. Once in the wizard, select which data sources from the device will be used by the report server.
• Select All Span data source:
1
The order is alphabetical by link alias name, though initially, when new data sources are added to VAS reports, the link names are derived directly from the names of the corresponding data sources. This can subsequently be changed by defining different alias names.
Click Assign ALL SPAN Cisco NAM Data Source to assign the ALL SPAN data source to the report server. This operation can be performed on a number of selected devices at once.
Note that even though ALL SPAN is an aggregate of all the data sources for the device, it is possible to select it and at the same time select other data sources for that device. Above de-duplication rules will then apply.
3. In the VAS Server Configuration window, click Save and continue changing server configuration, or click Save and Publish to save and immediately publish your configuration changes.
Scalability and Capacity Considerations
VAS capacity depends on the number of monitored sessions (conversations), which are unique combinations of client IP, server IP, port, and URL. It does not depend on the number of the attached data collectors. However, performance problems may occur if data collectors are unable to provide data within sufficient speed or frequency.
NOTE
The time interval at which VAS will interrogate NAM should be less than the report interval defined on NAM, and the difference between those two times should be at least equal to the time required for data generation and transfer from NAM to VAS. For more information, see
Special Considerations for Using NAM in Vantage for Real User Monitoring [p. 18].
One of the implication of this limit is that if you are reducing the length of the report interval on a NAM because, for example, you want to reduce data duplication errors, you should not reduce the interval below the value that would conflict with the above requirement. It is recommended that at least 20 seconds be left for a NAM to export its data to a file and make the file available for VAS.
Using NAM to Report Voice and Video Statistics in RUM
Cisco Network Analysis Module can be used to report voice and video data to the Vantage Analysis Server. You will be able to use voice and video related reports after attaching NAM to the report server.
Note that integrating NAM and RUM is an extension of the existing functionality, as the VAS is capable of reporting VoIP data monitored by NetworkVantage. This means that if you combine all three solutions the data presented by the VAS reports will be mixed.
Note also that if you are using only NAM as voice and video monitoring source you may see empty columns or charts due to limited number of statistics NAM provides.
NOTE
You should not configure NAM and NetworkVantage Probe to monitor the same VoIP traffic. Should this happen, ensure to configure software service names to indicate which portion of traffic they concern. Do not use identical names in these two products.
Differences between NAM and RUM terminology
The main source for voice and video metrics and dimensions is the NAM RTP Stream Traffic table. To leverage reporting VAS uses statistics provided in other tables as well.
Table 4. Mapping of NAM and RUM VoIP dimensions
Comment RUM
NAM
The value is changed based on the data acquired form the Known Phones table. The IP address is mapped to phone number.
Endpoint host name Source Addr: Port
The value is changed based on the data acquired form the Known Phones table. The IP address is mapped to phone number.
Endpoint host name Dest Addr: Port
Names are synchronized based on mapping contained in the VAS dictionary file. For more information, see
Step 4 [p. 21]. Software Service
Payload Type
The status is not directly reported on VAS reports:
-Status
• For active calls (that is the ones that did not end within a given monitoring interval) only bytes and packets are shown.
• For inactive streams all VoIP metrics are reported.
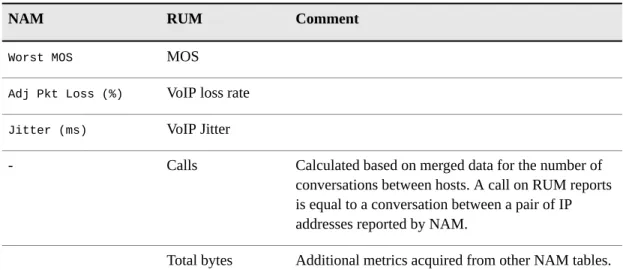
Table 5. Mapping of NAM and RUM VoIP metrics
Comment RUM
NAM
MOS Worst MOS
VoIP loss rate Adj Pkt Loss (%)
VoIP Jitter Jitter (ms)
Calculated based on merged data for the number of conversations between hosts. A call on RUM reports Calls
-is equal to a conversation between a pair of IP addresses reported by NAM.
Additional metrics acquired from other NAM tables. Total bytes
Several voice and video dimensions and metrics are not imported from NAM:
Dimensions
• SSRC • Start Time
Metrics
• Act Pkt Loss/million • Total SSC
Troubleshooting
If voice monitoring is enabled ensure also that NAM tables contain the requested data. For example if you cannot see phone numbers on the reports, log in to NAM and verify data in the
Known Phones table. If other VoIP statistics are not reported by the VAS make sure they exist
in the RTP Stream Traffic table.
If you use NAM version 4 to report VoIP data, the report may show some erroneous MOS values larger than 5. These values occur when the VAS reads a malformed RTP Stream Traffic table that NAM version 4 produces. This does not happen when you attach NAM version 5 to the report server.
Using NAM to Report Optimized WAN Statistics in RUM
Cisco Network Analysis Module is capable of reporting WAN optimization data to Vantage for Real User Monitoring report server. Data obtained from Cisco NAM will be available in built in reports as well as custom reports created in DMI.
If you plan to monitor WAN optimization controllers (WOCs) and generate reports of the optimized WAN traffic, the following configuration will allow you to utilize the data gathered by Cisco NAM.
The essential part of reporting optimized WAN using NAM data is creating and defining the appropriate data sources.
While creating a data source in NAM, make sure that the Wide Area Application Services (WAAS) is selected as a data source type, and the appropriate WAAS segments are selected. The following WAAS segments are available:
• Client • Client WAN • Server WAN • Server • Passthrough
Once the Cisco NAM data sources are properly defined, they can be used to present data to Vantage for Real User Monitoring report server.
You can assign NAM data sources to the report server using the VCAEUE Console.
1. Open the Vantage for Real User Monitoring report server configuration in the VCAEUE Console.
2. On the Assigned devices tab, locate the Cisco NAM device assigned to the report server. Chapter 3 ∙ Using Cisco Network Analysis Module in Vantage for Real User Monitoring
NOTE
If your Cisco NAM device is not listed, check the list of devices managed by the VCAEUE Console and add the your NAM device to the VCAEUE Console and to the report server configuration. For more information, see Adding a Device to the Devices List in the Vantage
for Real User Monitoring – System Administration Guide and Adding and Editing Devices in a Report Server Configuration in the Vantage for Real User Monitoring – System Administration Guide.
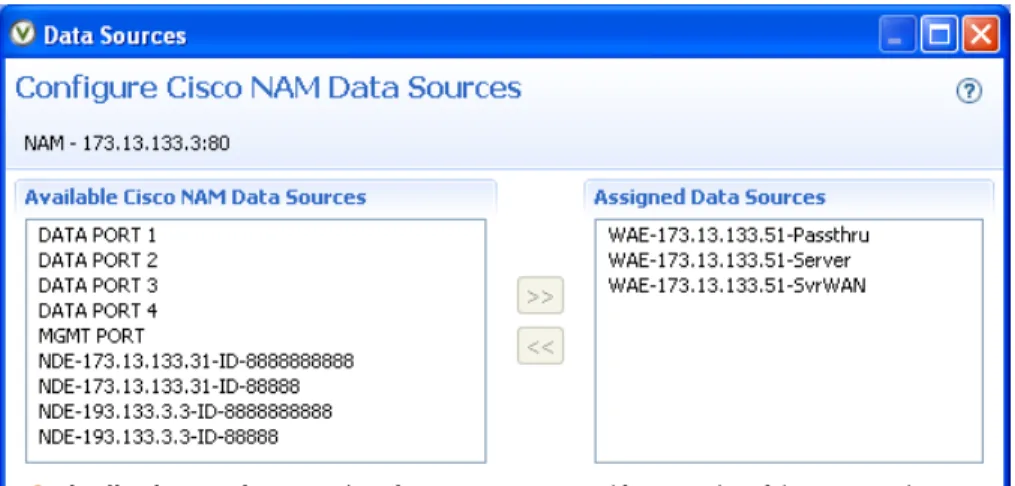
3. Right-click the Cisco NAM device and select Configure Cisco NAM Data Sources from the menu.
4. Select appropriate data sources from the Available Cisco NAM Data Sources list and move them to the Assigned Data Sources list.
Figure 8. Selecting Cisco NAM data sources for optimized WAN monitoring
Adding NAM data sources to Vantage for Real User Monitoring report server in order to view the optimized WAN statistics requires selecting at least three WAAS segments defined as Cisco NAM data sources.
5. Click OK to save changes.
C H A P T E R 4
WAN Optimization Reports
Configuring WAN optimization in Vantage allows for more precise analysis of the defined sites, links, software services, and individual operations.
A typical user viewing the RUM Overview reports can quickly assess the Usage, Performance, and Availability of the WAN optimization service.
For example, let's assume that while viewing the RUM Overview - Tiers report, you notice in the Application Delivery Chain table that the Client optimized network tier is not performing as expected.
Drilling down in the optimized tier will reveal the report displaying defined sites (Optimized
WAN Environment Performance Overview - Sites). At this point, you can quickly ascertain
whether the problem occurs with a given Client site, potentially identifying an issue with a specific software service, load distribution, or misconfigured WAN Optimization Controller (WOC) at the branch end. You can also determine whether the problem is with all sites, which could indicate a problem with the local WOC or with a common software service for all sites. For more information, see Optimized WAN Environment Performance Overview - Sites Report
[p. 32].
Examining the Sites report you can drill down to the best or the worst performing link within the Client site and review the breakdown of the software services relating to that link (Optimized
WAN Environment Performance Overview - Software Services). Once again, you can assess
whether the problem relates to one specific software service or to the entire link. Single software service failure or performance downgrade could suggest a failed optimization policy for that service or indicate that this particular software service is not suitable for optimization. For more information, see Optimized WAN Environment Performance Overview - Software Services Report [p. 34].
Clicking on a poorly performing software service, you will drill down to the links report for that site with the specific software service (Optimized WAN Environment Performance
Overview - Links). The report will present measurements for the LAN and WAN link segment
broken down by links. This will allow you to examine the measurements for the optimized and non-optimized links for a particular software service observed on specific Client site. For more information, see Optimized WAN Environment Performance Overview - Links Report [p. 34]. On the Optimized WAN Environment Performance Overview - Software Services report, clicking on the Operations value for a particular Software service you will drill down to
Optimized WAN Environment Performance Details - Operation Times report presented as
a series of charts where you can examine the performance of your software service over a period of time.
By clicking a particular Client site on the Links report, you will be taken back to the Software
Services report listing all of the software services for a particular Client site. The Optimized WAN Environment Performance Overview - Software Services report and the Optimized WAN Environment Performance Overview - Links enable you to examine the problem areas
from two different perspectives within the chosen Client site. The Software Services report will show you how your software services are performing for a particular Client site, and the
Links report will indicate how your link is performing for a specific software service for a
particular Client site.
Selecting Client bandwidth usage or Server bandwidth usage for either the LAN (in
accelerated environment) or WAN (Optimized) will display the charts with plotted metric
values to show you visually the performance of each of the links over time.
At this point, the information that you have gathered tells us that there is a specific software service on a specific link within the particular Client site that is not performing according to expectations. It would be beneficial to examine the software service performance before and after the optimization to find out how much of the particular software service has been optimized and the optimization compression that has been applied. The LAN / WAN Comparison report (Optimized WAN Environment Performance Overview - LAN and WAN Comparison) compares total bytes on the LAN and WAN sides. The report displays the Total bytes on WAN side and Total bytes on LAN side for each of the recognized software services. The comparative metrics for Total bytes compression and Percentage of optimized traffic (bytes) will make apparent any performance issues based on the default threshold configuration. For more information, see WAE - LAN and WAN Comparison Report [p. 35].
Often, just the knowledge of a particular software service performing poorly is not enough to determine the cause of the performance issue. By clicking the specific Software service on the LAN and WAN Comparison report, you will drill down to a Optimized WAN
Environment Performance Details - Software Services Performance report. This report will
present the selected software service broken into individual operations. Each of the operations presents network metrics that allow to examine the operation time breakdown detailing the server time, network time, and redirect time.
Optimized WAN Environment Performance Overview
-Sites Report
The Optimized WAN Environment Performance Overview - Sites report is a summary of the monitored user-defined links with emphasis on optimized WAN traffic.
To open the report, click Applications ➤ RUM Overview and then click the Client optimized
network link within the Network tiers section.
This performance overview report enables you to quickly assess the performance of your WAN Accelerated Environment based on user-defined links within that environment and, from a high-level perspective, determine the health of your optimization service for each of the defined links.
The report lists user-defined links observed within the network tier that forms your optimized WAN environment and is presented in two tables:
Tier statistics
This table represents the overall health of your WAN accelerated environment with specific metrics grouped into Usage, Performance, and Availability. Each of the groups provides specific metrics for that group:
Usage is represented by how many unique users are detected in your optimized WAN
environment (Unique users), the number of all transmitted bits per second (Total bandwidth usage), and the percentage of bytes compared with a baseline (Load).
Performance consists of the actual transfer rate of server data (Realized bandwidth), reduction as expressed as a percentage, where a lower byte count on the WAN side means a higher reduction (Performance).
Availability indicates the percentage of successfully sent packets (Connectivity) and the number of users that experienced connectivity problems (Affected users).
Sites
This table lists all user-defined links observed within your optimized WAN environment. For this report to be a coherent list of only optimized links, at least one link must be defined for each site that is being optimized. For more information, see User Defined Links (UDLs) in the Vantage Analysis Server – User Guide and Adding Manual Sites in the Vantage for
Real User Monitoring – System Administration Guide. By default, the User Defined Link
filter is applied for this report. This filter can be adjusted by refining the report and editing the Client site UDL dimension and condition within DMI, but it is recommended that you retain its default settings.
NOTE
Because the default Client site UDL filter is enabled and configured as hidden, it will not appear in the filter list at the top of the Sites table.
Data received from Cisco Network Analysis Module is indicated by a link group name
Cisco NAM followed by the IP address of the Cisco NAM device.
For each of the defined sites, there are metrics such as Operations, which provides the number of operations; Operation time breakdown, which indicates how much time particular operation took; the Application Delivery Channel Delay, which indicates the quality of the optimization for the particular site; and compression and optimized bytes, which are compared to the average of all user-defined sites (UDL).
Click a client site to drill down to a report listing all of the observed software services for this site. For more information, see Optimized WAN Environment Performance Overview - Software Services Report [p. 34].
Optimized WAN Environment Performance Overview
-Software Services Report
The Optimized WAN Environment Performance Overview - Software Services report lists all of the software services that have been observed for the specific site. It is a drilldown report from the Sites report and it can be accessed without the Site filter, listing all of the software services, by clicking the All Software Services tab.
This report lists software services observed within your WAN accelerated environment. The report comprises two tables:
Optimized Software Services
For each of the observed software services, there are metrics such as Operations, which provides the number of operations; Operation time breakdown, which indicates how much time particular operation took; the Application Delivery Channel Delay, which indicates the quality of the optimization for the particular software service; and compression and optimized bytes, which are compared to the average of all listed software services.
Non-optimized Software Services
This table lists all of the software services that were observed within your WAN accelerated environment but were not optimized. Certain software services might be purposely omitted from optimization service due to policy or inability to optimize that particular service, while other omissions may be an indication of poor optimization or a problem with WAN Optimization Controller (WOC) configuration. The list contains all cases of unoptimized software services.
Click a software service to drill down to a report listing all observed links for this software service. For more information, see Optimized WAN Environment Performance Overview -Links Report [p. 34].
Optimized WAN Environment Performance Overview
-Links Report
The Optimized WAN Environment Performance Overview - Links report is a summary of the monitored WAN links with an emphasis on optimized WAN traffic.
This performance overview report enables you to quickly assess the performance of your WAN Accelerated Environment based on links within that environment and, from a high-level perspective, determine the health of your optimization service.
You can open the report by clicking Applications ➤ RUM Overview and clicking on the
Client optimized network link within the Network tiers section of the report.
This report lists observed links within the network tier that form your WAN accelerated environment. The links are grouped into three tables:
WAN Accelerated Environment Performance
For each link, there are metrics such as Operations, which provides the number of operations; Operation time breakdown, which indicates how much time a particular operation took; the Application Delivery Channel Delay, which indicates the quality
of the optimization for the particular link; and compression and optimized bytes, which are compared to the average of all detected links.
Optimized links breakdown
Presents observed client / server statistics for optimized traffic for each link. The breakdown displays the client and server bandwidth usage and the Total bytes transmitted by the client and server for the LAN and WAN.
Non-optimized links
Lists the links on which unoptimized traffic was detected (links where Percent of optimized bytes is below 100%).
The links where Percent of optimized bytes in the WAN Accelerated Environment
Performance table is below 100% will also be listed in the Non-optimized links table, as only
a certain percentage of the traffic observed on that link has been optimized. The Total bytes for such a link in the Optimized links breakdown table, compared to the Total bytes for the same link in the Non-optimized links table, gives the Percent of optimized bytes for that link listed in the WAN Accelerated Environment Performance table.
Click the link to drill down to a report listing all of the observed software services for this link. For more information, see Optimized WAN Environment Performance Overview - Software Services Report [p. 34].
WAE - LAN and WAN Comparison Report
The Optimized WAN Environment Performance Overview - LAN and WAN Comparison report indicates how optimized software services on the LAN side compare to those on the WAN side. This report can be accessed by clicking the LAN / WAN Comparison tab from any WAN Accelerated Environment Performance Overview report.
The side-by-side comparison of the software services provides a quick picture of how your WAN Accelerated Environment is optimizing each of the software services. The table presents the total bytes on your WAN side, combining the bytes that have been passed through and bytes that have been optimized, the total bytes on your LAN side (which is all of your network traffic that is destined for optimization but has not been optimized yet), and the compression and optimized bytes.
The compression percentage indicates how many bytes for the particular service have been compressed. If Total bytes compression equals 0%, all of the traffic for this software service has been recognized as pass-through, which would indicate that either the WOC is not configured properly for compressing this particular software service, or it does not support compression for this software service, or this software service purposely has not been configured for optimization.
Percent of optimized bytes indicates how much of your network traffic has been optimized. For example, if the Percent of optimized bytes indicates 25%, only a quarter of the network traffic generated by this software service and destined for optimization is being optimized. This would be an indication that the optimization for this software service is poorly configured or the WOC is experiencing an overload.