The Workforce in Three California Early
Childhood Infrastructure Organizations
Beyond Homes and Centers:
Marcy Whitebook, Laura Sakai, and Fran Kipnis
Research
Report
2010
Institute for Research on Labor and Employment
© 2010 Center for the Study of Child Care Employment All rights reserved.
Design: Heather Lynch
Center for the Study of Child Care Employment Institute for Research on Labor and Employment
University of California at Berkeley 2521 Channing Way #5555
Berkeley, CA 94720 (510) 643-8293
http://www.irle.berkeley.edu/cscce/ Acknowledgement:
We would like to thank Esther Suarez, former CSCCE staff member, for programming the survey. We would also like to thank the California Child Care Resource and Referral Network, the California Child Care
Coordina-tors Association and the First 5 Association of California for their assistance and support.
This report was made possible through the generous support of the David and Lucile Packard Foundation. The conclusions and views presented in this report are those of the authors only, and not of the study’s funders.
Suggested citation:
Whitebook, M., Sakai, L., & Kipnis, F. (2010). Beyond homes and centers: The workforce in three California early childhood infrastructure organizations. Berkeley, CA: Center for the Study of Child Care Employ-ment, Institute for Research on Labor and EmployEmploy-ment, University of California at Berkeley.
List of Tables
List of Figures
Executive Summary
Introduction
Survey Methodology
The Survey Population The Survey Instrument Data Collection ProceduresComparing Staff across Organizational Types: Identifying Job Levels Survey Completion and Response Rate
Data Analysis
Findings
Who constitutes the workforce in three California early childhood infrastructure organizations?
Gender Age
Ethnic Background Linguistic Background
Professional Background, Experience, and Compensation Tenure in the organization workplace and current position
Tenure in the field
Job history in the ECE field
Employment providing direct services to young children Compensation
Table of Contents
iii
iv
viii
1
3
3 3 4 4 5 67
7 7 7 10 10 12 12 14 14 14 17Beyond Homes and Centers:
The Workforce in Three California
What job functions does the workforce in three California early childhood infrastructure organizations perform?
Duties Related to Direct Client Services
Duties Related to Policy, Planning, and Research Duties related to Administration and Management
What is the level of educational attainment and early childhood development-related training among the workforce in three California early childhood infrastructure organizations?
Overall Education
Overall educational attainment, by place of employment Overall educational attainment, by ethnicity and language
Education and Training Related to Child Development and Early Childhood Education Degrees related to early childhood education or child development
College credits related to early childhood education among infrastructure staff with non-ECE college degrees
College credits related to early childhood education among infrastructure staff with no college degrees
Participation in non-college credit professional development
What are the professional development needs, educational aspirations, and future employment plans of the workforce in selected infrastructure organizations in California?
Skills for Current Job and Desired Training
Preferred methods of attaining new skills and knowledge Continuing Education and Educational Aspirations
Infrastructure staff currently participating in a degree program Type of degree
Reasons for pursuing a degree
Challenges related to pursuing a degree Desired resources
Infrastructure staff interested in but not currently participating in a degree program
Reasons for pursuing a degree Challenges going back to school Resources
Future Plans of Infrastructure Staff
Skills helpful to meet future career goals
Discussion and Recommendations
Discussion
Recommendations
Appendix A: Description of infrastructure agencies
References
20 20 22 22 28 28 28 28 30 30 30 31 31 36 36 37 37 38 38 38 38 40 40 40 40 42 42 4245
45 4648
52
List of Tables
Table 1: Survey Response Rate: Number of Staff (Percent)
Table 2: Percentage of Organizations with Various Survey Response Rates Table 3: Distribution of Job Levels for Participants Employed at Resource and
Referral Programs
Table 4: Distribution of Job Levels for Participants Employed at First 5 Commissions Table 5: Gender Distribution of the Workforce in Three Types of Infrastructure
Organizations, by Job Level
Table 6: Percentage of the Workforce in Three Types Infrastructure Organizations with Different Rates of Tenure at Place of Employment Compared with Child Care Center-based Teaching Staff and Directors
Table 7: Mean Hourly Wages Paid to the Workforce in Three Types of Infrastructure Organizations, by Job Level
Table 8: Mean Hourly Wages Paid to the Workforce in Three Types of Infrastructure Organizations with BA or Higher Degrees, Compared to Child Care Center-Based Teaching Staff, by Job Level
Table 9: Skills Reported as Most Applicable to their Current Job and Satisfaction with Skill Level among the Workforce in Three Types of Infrastructure
Organizations, by Job Level
Table 10: The Preferred Methods of Attaining New Skills and Knowledge Reported by the Workforce in Three Types of Infrastructure Organizations, by Job Level
page 5 page 5 page 6 page 6 page 7 page 13 page 19 page 19 page 36 page 37
List of Figures
Figure 1: Age Distribution of the Workforce in Three Types of Infrastructure
Organizations, Compared to Child Care Center-based Teaching Staff and Women in California
Figure 2: Age Distribution of the Workforce in Three Types of Infrastructure Organizations, by Job Level
Figure 3: Age Distribution of the Workforce in Three Types of Infrastructure Organizations, by Place of Employment
Figure 4: Ethnic Distribution of the Workforce in Three Types of Infrastructure Organizations, Compared to Child Care Center-based Teaching Staff and Directors and Women in California.
Figure 5: Ethnic distribution of the Workforce in Three Types of Infrastructure Organizations, by Job Level
Figure 6: Ethnic Distribution of the Workforce in Three Types of Infrastructure Organizations, by Place of Employment
Figure 7: Language Distribution of the Workforce in Three Types of Infrastructure Organizations, by Job Level
Figure 8: Language Distribution of the Workforce in Three Types of Infrastructure Organizations, Compared with Child Care Center-based Teaching Staff and Directors with the Capacity to Communicate in a Language Other Than English, by Job Level
Figure 9: Percentage of the Workforce in Three Types of Infrastructure Organizations with Different Rates of Tenure at Place of Employment, by Job Level Figure 10: Percentage of the Workforce in Three Types of Infrastructure Organizations
with Different Rates of Tenure in their Current Position, by Job Level
Figure 11: Percentage of the Workforce in Three Types of Infrastructure Organizations with Different Rates of Tenure in the Early Care and Education Field, by Job Level
Figure 12: Percentage of the Workforce in Three Types of Infrastructure Organizations Who Worked In and Out of the ECE Field, by Job Level
Figure 13: Percentage of the Workforce in Three Types of Infrastructure Organizations with a History of Working Directly with Young Children, by Job Level
Figure 14: Percentage of the Workforce in Three Types of Infrastructure Organizations with Different Rates of Tenure Providing Direct Services to Young Children, by Job Level page 8 page 8 page 9 page 9 page 10 page 11 page 11 page 12 page 13 page 14 page 15 page 15 page 16 page 16
Figure 15: Percentage of the Workforce in Three Types of Infrastructure Organizations with Different Rates of Tenure Providing Direct Services to Young Children, by Place of Employment
Figure 16: Reasons the Workforce in Three Types of Infrastructure Organizations Stopped Working Directly with Young Children, by Job Level
Figure 17: Job Responsibilities of the Workforce in Three Types of Infrastructure Organizations Related to Direct Client Services for Child Care Providers, by Job Level
Figure 18: Job Responsibilities of the Workforce in Three Types of Infrastructure Organizations Related to Direct Client Services for Families and Organizations, by Job Level
Figure 19: Job Responsibilities of the Workforce in Three Types of Infrastructure Organizations Related to Direct Client Services for Child Care Providers, by Place of Employment
Figure 20: Job Responsibilities of the Workforce in Three Types of Infrastructure Organizations Related to Direct Client Services for Families and Organizations, by Place of Employment
Figure 21: Job Responsibilities of the Workforce in Three Types of Infrastructure
Organizations Related to Policy, Planning and Research: Attending Meetings, by Job Level
Figure 22: Job Responsibilities of the Workforce in Three Types of Infrastructure
Organizations Related to Policy, Planning and Research: Policy and Planning, by Job Level
Figure 23: Job Responsibilities of the Workforce in Three Types of Infrastructure
Organizations Related to Policy, Planning and Research: Attending Meetings, by Place of Employment
Figure 24: Job Responsibilities of the Workforce in Three Types of Infrastructure Organizations Related to Policy, Planning and Research, by Place of Employment
Figure 25: Job Responsibilities of the Workforce in Three Types of Infrastructure Organizations Related to Administration and Management: Fiscal and Computer, by Job Level
Figure 26: Job Responsibilities of the Workforce in Three Types of Infrastructure
Organizations Related to Administration and Management: Management and Support, by Job Level
Figure 27: Job Responsibilities of the Workforce in Three Types of Infrastructure Organizations Related to Administration and Management: Fiscal and Computer, by Place of Employment
page 17 page 18 page 21 page 21 page 23 page 23 page 24 page 24 page 25 page 25 page 26 page 26 page 27
Figure 28: Job Responsibilities of the Workforce in Three Types of Infrastructure
Organizations Related to Administration and Management: Management and Support, by Place of Employment
Figure 29: Educational Attainment of the Workforce in Three Types of Infrastructure Organizations Compared to the Child Care Center-based Teachers and the California Female Adult Population, by Job Level
Figure 30: Percentage of the Workforce in Three Types of Infrastructure Organizations with a College Degree, Compared to California’s Adult Female Population, by Place of Employment
Figure 31: Ethnic Distribution of the Workforce in Three Types of Infrastructure Organizations, by Educational Attainment
Figure 32: Percentage of the Workforce in Three Types of Infrastructure Organizations with a College Degree, by Type and Subject of Degree
Figure 33: Subject of College Degree Attained by the Workforce in Three Types of Infrastructure Organizations, by Job Level
Figure 34: Percentage of the Workforce in Three Types of Infrastructure Organizations with an Associate’s or Higher Degree in Early Childhood Education or Child Development, by Place of Employment
Figure 35: Number of College Credits Related to Early Childhood Education (ECE) attained by the Workforce in Three Types of Infrastructure Organizations with Non-ECE College Degrees, by Job Level
Figure 36: Number of College Credits Related to Early Childhood Education Attained by the Workforce in Three Types of Infrastructure Organizations who do not have College Degrees, by Job Level
Figure 37: Percentage of the Workforce in Three Types of Infrastructure Organizations with Non-College Credit Training in Early Childhood Education, Child Development or Other Job-Related Areas, by Job Level
Figure 38: Number of Non-College Credit Training Hours Related to Early Childhood Education attained by the Workforce in Three Types of Infrastructure Organizations, by Job Level
Figure 39: Reasons for Currently Participating in a Degree Program Reported by the Workforce in Three Types of Infrastructure Organizations
Figure 40: Challenges of Currently Participating in a Degree Program Reported by the Workforce in Three Types of Infrastructure
Figure 41: Helpful Resources for Currently Participating in a Degree Program Reported by the Workforce in Three Types of Infrastructure Organizations
page 27 page 29 page 29 page 31 page 32 page 32 page 33 page 33 page 34 page 34 page 35 page 38 page 39 page 39
Figure 42: Reasons for Wanting to Participate in a Degree Program in the Next Three Years Reported by the Workforce in Three Types of Infrastructure
Organizations
Figure 43: Challenges of Participating in a Degree Program in the Next Three Years Reported by the Workforce in Three Types of Infrastructure Organizations Figure 44: Helpful Resources for Participating in a Degree Program in the Next Three
Years related to Finances and Logistics Reported by the Workforce in Three Types of Infrastructure Organizations
Figure 45: Helpful Resources for Participating in a Degree Program in the Next Three Years related to Supports and Services Reported by the Workforce in Three Types of Infrastructure Organizations
Figure 46: Percentage of the Workforce in Three Types of Infrastructure Organizations who Report they will be Working in the ECE Field in Five Years, by Job Level Figure 47: Additional Skills Needed for Future Career Reported by the Workforce in
Three Types of Infrastructure Organizations, by Job Level
page 41 page 41 page 45 page 43 page 44 page 44
Beyond Homes and Centers:
The Workforce in Three California
Early Childhood Infrastructure
Organizations
Executive Summary
Staff working in early childhood infrastructure organi-zations play critical roles in the design and implemen-tation of the early care and education system. They
represent the field to the public and policy makers,
provide education and professional development to those working directly with children, and serve as the liaisons between families and the many services and programs upon which they depend. Yet, until now, only minimal attention has been focused on those who work in these organizations in such roles as adult trainer or educator, referral counselor for fami-lies, program developer, and/or advocate or policy analyst.
The staff in infrastructure organizations demands our attention, particularly at a time when the organi-zations in which they work are looked to as leaders
in efforts to improve the quality of early childhood services. Many questions arise: what are the
char-acteristics and backgrounds of those who fill these
positions, do they have access to professional prepa-ration and development appropriate to the skills and knowledge needed for their jobs, and how similar or different are they from those working directly with young children?
In 2009, we surveyed a population of 1,588 persons who work in three types of early childhood infrastruc-ture organizations in California – child care resource and referral programs, local First 5 commissions and as child care coordinators.1 All of these infrastructure organizations receive public dollars and at least one of each type is found in every county of the state.
1 For a description of these organizations, see Appendix A of the full report. For information about the study response rate, see the survey methodology section in the full report. http://irle.berkeley.edu/cscce
2 Whitebook et al., (2006). Mean hourly wages per center have been adjusted for cost of living increases between 2005 when data were collected, and 2009, Bureau of Labor and Statistics (2009).
Mean wage data for infrastructure staff were for each staff person. Data for center-based teachers and assistants were collected by
Findings
Who Constitutes this Workforce?
Gender and age. Staff responding to the survey were predominately female and middle-aged. Nearly
one-third were 50 years or older, and less than one-fifth
were 29 years or younger.
Ethnicity and language. Staff responding to the sur-vey were ethnically diverse, with approximately one-half people of color. Virtually all staff reported being able to speak, read and/or write English and one-third reported being able to speak, read and/or write Span-ish.
Job history and tenure. The majority of staff who responded to the survey reported working in their
or-ganizations for more than five years, with nearly
one-quarter reporting tenure of more than 10 years. Career history. Staff responding to the survey re-ported diverse job backgrounds, with half reporting experience working directly with young children in center- or home-based early care and education set-tings, about a quarter with backgrounds in social
ser-vices, and the remainder drawn from other fields.
Earnings. Among infrastructure staff with a BA or higher degree, the average hourly wage was $28.61, with a range of $21.86 to $42.97 depending on job role and organizational type. These earnings are con-siderably higher salaries than those working directly with children in licensed child care centers, even when taking level of education into account. The highest and lowest wage for a center teacher with a BA or higher degree was $18.28 and $15.57 respectively.2
What is Their Level of
Educational Attainment and Early
Childhood Related Training?
Overall education. Infrastructure staff responding to the survey were well-educated, with nearly two thirds
having earned a BA or higher degree. Educational at-tainment varied by ethnicity with 81 percent of Asian/
Pacific Islander, 70 percent of White, non-Hispanic,
68 percent of African American and 53 percent of La-tina staff, 81 percent reported they had completed a four-year or higher degree.
Early childhood or child development special-ized education. Slightly less than one-quarter of in-frastructure staff responding to the survey reported completing degrees related to early childhood or child development, although two-thirds of those with degrees in other subjects had completed some col-lege-level coursework in child development or early childhood education.
What are Their Professional
Development Needs and
Aspirations?
Job preparation. The majority of staff responding to the survey reported satisfaction with their current level of job skills.
Desired training. While the majority of staff respond-ing to the survey reported satisfaction with their cur-rent level of jobs skills, nearly half reported desiring additional knowledge in the area of child development.
More than one-third classified as supervisors/manag -ers reported that additional knowledge in the areas of management and supervision would be helpful for their current job.
Educational and career aspirations. Slightly more than half of infrastructure staff responding to the sur-vey reported they planned to be working in the early
childhood field in five years. Among those engaged
in or interested in pursuing additional education to expand and improve their abilities and to help them
advance in their careers, finances and lack of suffi -cient time while working full time were reported to be substantial barriers to their continuing education.
Recommendation 1:
Include early childhood infrastructure staff in early childhood workforce data systems
Additional information about the workforce in the full complement of infrastructure organizations is needed to develop an in-depth portrait of this sector of the early care and education workforce. Because of the expense involved in conducting workforce surveys, we recommend that infrastructure organizations be included in the workforce component of the early care and education integrated data systems, such as registries, that are being developed in response to the federal charge to states through their Early Learning Advisory Councils.3
Recommendation 2:
Develop competencies for roles in infrastructure organizations and other early childhood
lead-ership positions
Each day across the state, staff in infrastructure organizations guide families, prepare and support teachers and providers, and make decisions about how public resources are spent. In addition, many infrastructure
organiza-tions serve as the training ground for the field’s established and emerging leadership. As states develop and
improve their professional development systems, the extent to which infrastructure staff in various roles need to know about child development, early childhood pedagogy, public health and social welfare issues and/or to un-derstand the early childhood system, and policy developments at the local, state and federal level, adult learning theory, and various aspects of management and administration should be determined.
Discussion and Recommendations
In reflecting upon these findings, we noted how this
sector of the early care and education workforce is both similar and different from those working directly with young children each day. While predominately female and ethnically and linguistically diverse like those working in center- and home-based programs, staff in infrastructure organizations as a group have achieved higher levels of education and earn consid-erably higher salaries, even when taking level of ed-ucation into account. One-half of infrastructure staff reported previous experience working directly with young children. Among those, the need for earning a higher salary was the most common reason reported for no longer working in the child care center class-room or a family child care homes.
Similar to their counterparts who work in center- and home-based early care and education programs who are seeking educational degrees while working full-time, staff in infrastructure organizations report that
financial support and more flexible work schedules
would be helpful to their pursuit of education (White-book et. al., 2008). Staff working in these infrastruc-ture organizations, in contrast to their counterparts who work in center- and home-based programs, did not report academic challenges as barriers to pursu-ing or completpursu-ing higher degrees (Whitebook et al., 2008).
Finally, while there is education and role stratifica -tion by ethnicity within the three types of infrastruc-ture organizations in this study, it is less pronounced than in early care and education centers. Indeed, in-frastructure organizations appear to be a leadership pipeline for the early care and education workforce, a place where those from diverse ethnic background and/or those who have worked in center- and
home-based programs can find a wage commensurate with
their education and assume new job roles in the early
childhood field.
3 For more information about integrated early childhood data systems, see the Data Quality Campaign website. http://www.dataqualitycampaign.org/resources/830
Recommendation 3:
Commit public resources to the expansion of higher education programs focused on building a
linguistically and ethnically diverse workforce
The information collected in this study documents that many members of the workforce in infrastructure orga-nizations seek additional education and training opportunities. We urge higher education institutions and other training organizations to heed the interdisciplinary nature of the jobs performed by staff in infrastructure organi-zations, as well as their varied career backgrounds from different sectors and jobs roles within and beyond the
early childhood field. These programs should be designed to integrate child development theory and pedagogy,
policy and research, and adult and organizational development. Because so many in the early care and educa-tion workforce across settings and roles are likely to be full-time working students, educaeduca-tion and professional development experiences must include tuition assistance and be offered online, and in locations and at times
that are convenient. Given the financing crisis in public higher education, public resources are essential to devel -oping and/or revamping such programs (Whitebook et al., 2008; Whitebook & Austin, 2009).
Recommendation 4:
Improve compensation for those working with young children in centers and homes
While it is promising that infrastructure organizations function as a haven for many who have worked directly with
young children and want to remain in the field, it is troubling, though not surprising, that the major reason cited
for leaving the classroom was the desire for better pay. At a time when Head Start and many preschool programs
are raising educational qualifications for teachers, the continued low pay signals a growing crisis as these better
educated teachers are likely to follow other educated teachers out of the classroom.
Attention to the infrastructure staff is essential to the health of the early care and
education field. The reform required to ensure a well-functioning, effective early
learning system rests in no small measure on the skills and knowledge of
infra-structure staff. As states are called upon through the Early Learning Advisory
Councils to develop their early learning professional development systems, the
workforce in infrastructure organizations can and should be a focus. This study
is intended to begin the overdue examination of this essential sector of the early
childhood community.
Bureau of Labor Statistics. (n.d.). Consumer Price Index inflation calculator. Retrieved from
http://www.bls.gov/data/inflation_calculator.htm
Data Quality Campaign. (n.d.). Retrieved March 15, 2010, from http://www.dataqualitycampaign.org/resources/830
The National Registry Alliance. (n.d.). Retrieved March 15, 2010, from http://www.registryalliance.org
Whitebook, M., & Austin, L. (2009). Leadership in early childhood: A curriculum for emerging and established agents of change. Berkeley, CA: Center for the Study of Child Care Employment, University of California at Berkeley.
Whitebook, M., Sakai, L., Kipnis, F., Almaraz, M., Suarez, E., & Bellm, D. (2008). Learning together: A study of six B.A. completion cohort programs in early care and education. Year I report. Berkeley, CA: Center for the Study of Child Care Employment, University of California at Berkeley.
Whitebook, M., Sakai, L., Kipnis, F., Lee, Y., Bellm, D., Almaraz, M., & Tran, P. (2006). California early care and education workforce study: Licensed child care centers. Statewide 2006. Berkeley, CA: Center for the Study of Child Care Employment, and San Francisco, CA: California Child Care Resource and Referral Network.
Introduction
The phrase “early care and education workforce” typically refers only to those working as teachers, as-sistant teachers and directors in child care centers and providers and assistants in home-based settings. While many others perform important jobs that con-tribute to the care and education of young children, only minimal attention is focused on those who work indirectly with children in such roles as adult trainer or educator, referral counselor for families, program de-veloper, and/or advocate or policy analyst. Yet, these staff, working in what we refer to as “infrastructure organizations,” play critical roles in the design and implementation of the early childhood system. They
most often represent the field to the public and policy
makers, provide much of the education and profes-sional development available to those working with children each day, and serve as the liaisons between families and the many services and programs upon which they depend.
Considered from the perspective of the essential functions they perform, this segment of the workforce demands our attention, particularly at a time when the organizations in which they work are looked to as leaders in efforts to improve the quality of early learning services. At present, however, there is a dearth of information about the characteristics and
backgrounds of those who fill these positions, and
whether they have access to professional prepara-tion and development appropriate and relevant to the skills and knowledge needed for their jobs. Thus, the two-fold purpose of Beyond Homes and Centers: The Workforce in Three California Early Childhood Infra-structure Organizations is to:
describe the characteristics of the workforce in three major types of infrastructure organizations in the state and to develop an in-depth portrait of this sector of the early care and education work-force; and
document the educational and training aspira-tions of this workforce to inform higher education reform and leadership development in the state. 1.
2.
We are using the term “infrastructure organization” to describe organizations which serve as the “connec-tive tissue” for the early care and education system and perform a variety of functions that link children and families and direct service organizations to each other and to the supports they need. For example, we would include organizations and programs that pro-vide child care resources and referrals, subsidy pay-ment to families, workforce supports and training, and engage in policy development and implementation, research and evaluation, and advocacy. We distin-guish early childhood education (ECE) infrastructure organizations not only from direct service providers, such as licensed or license-exempt homes, centers and schools, but also from ancillary services which constitute systems in and of themselves, such as, higher education, public health, mental health, family support or social services, and the K-12 system where it functions without a link to services for children birth
to five years old. Infrastructure organizations often
connect families and those providing direct early care and education services with these ancillary service systems.
We focused this study on three types of infrastruc-ture organizations in California: child care resource and referral programs, local First 5 commissions, and child care coordinators and their staff, most of whom
are responsible for staffing Local Planning Councils
for child care. These organizations receive all or a portion of their funding from public dollars and every county has at least one organization of each type. (See descriptions in Appendix A.)
While these organizations vary in function, size and
history, given their ubiquity and influence, it is strik -ing how relatively recently they have emerged in the
field of early care and education. At the turn of the
last century, child care centers and family child care homes, then referred to by different labels such as day nursery or baby sitter, comprised the early care and education landscape. Although only a few com-munities provided them with public dollars, these ear-ly nurseries and homes are recognizable as the
“an-cestors” to today’s array of direct service programs. In contrast, the infrastructure organizations which play such a pivotal role in our current system have been in existence for much less time, three decades for resource and referral programs, and less than two decades in the case of Local Planning Councils and First 5 commissions. It is likely that such organiza-tions as these will be a permanent feature of the early care and education system.
Two events prompted interest in examining the workforce in early care and education infrastructure organizations. First, the California Early Care and Education Workforce Study (Whitebook et al., 2006a, 2006b) provided an in-depth picture of the licensed center- and home-based workforce and its release prompted questions about the other key players in
the early care and education field. Second, the 2006
statewide proposition for universal preschool (Propo-sition 82) stimulated interest in the degree of demand for early childhood-related higher education pro-grams. Although Proposition 82 failed, other develop-ments including the CARES1 program and new Head Start teacher standards led some institutions of high-er education to continue to explore the demand for new or expanded upper division and graduate early childhood-related programs. The question of whether those in infrastructure organizations might be inter-ested in such options remains pertinent.
There is also concern about an impending
“leader-ship” vacuum in the field. A substantial proportion
of those holding designated leadership positions are approaching retirement age, and the current leader-ship lacks the linguistic and ethnic diversity of the workforce as a whole and the children and families it serves. The lack of a clear “leadership pipeline”
with sufficient higher education programs and profes -sional development opportunities further contributes
to worry about the leadership development in the field
(Whitebook & Austin, 2009). Many view staff in
infra-structure organizations as the source of the field’s
current and next generation of leaders, underscoring concern about how to ensure their access to relevant education and professional development.
This concern is concrete and immediate. Each day across the state, staff in infrastructure organizations guide families, prepare and support teachers and providers, and make decisions about how public re-sources are spent. The reform required to ensure a well-functioning effective early learning system rests in no small measure on the competencies of infra-structure staff. As states are called upon through the Early Learning Advisory Councils to develop their early learning professional development systems, the workforce in infrastructure organizations can and should be a focus. This study is intended to begin the overdue examination of this essential sector of the early care and education community.
1 Comprehensive Approaches to Raising Educational Standards (CARES) is a financial incentive program designed to promote,
re-ward, and encourage educational attainment and professional development among early educators through financial rewards, support programs, and efforts to address systemic challenges faced by early educators. CARES programs have been supported by multiple funding sources, including Local First 5 Commissions, First 5 California, the California Department of Education and other local funding sources. CARES programs currently operate in 18 counties but until recently operated in over 40 counties across the state.
The Survey Population
This study sought information about staff working in three types of early care and education infrastructure organizations: local child care resource and referral programs (R&Rs), local First 5 Commissions, and lo-cal child care coordinators and their staff.
Because the study is exploratory in nature, and be-cause it was neither a random sample nor a complete census of the workforce in each type of organization, its results cannot be generalized to all staff employed in each type of organization. As not all infrastructure organizations were sampled, the results also cannot be generalized to the infrastructure sector as a whole.
However, a sufficiently robust response rate (see
Survey Completion and Response Rate) provides us
with confidence that the findings can still inform work -force/leadership development in California.
Because of the variability among these organizations, the workforce has been categorized according to job
levels versus specific job titles, as described on page 5. In general, our findings focus on the sample as a
whole, noting differences across job functions. Only notable variations among types of organizations are reported.
The California Child Care Resource and Referral Net-work, the California First 5 Association of California and the California Child Care Coordinators Associa-tion provided the research team with a list of email addresses for the staff in their respective local orga-nizations. This list of email addresses served as the survey population. The survey population included:
all child care coordinators and staff who coordi-nate local child care planning councils and child care coordinators who primarily provide child care services for local city and county governments. We did not include city or county staff who provide a broad range of services including some child care services;
1.
staff working in 57 of the 58 local First 5 Commis-sions. One local commission declined to partici-pate in the study; and
staff working in 56 of the 61 R&R programs: Within some organizations, the R&R pro-gram is integrated with the Alternative Payment (AP) program which provides services to providers and families eligible for child care subsidies. For these orga-nizations, the survey population included staff with both R&R and AP responsibili-ties. In the organizations where the R&R and AP programs were separate, staff who only provided R&R services are not included in the survey population.
Five R&R programs, representing six counties and a portion of a seventh county declined to participate in the study.
The survey population included 1,588 staff: 87 child care coordinators and their staff; 454 local First 5 Commission staff; and 1,047 R&R staff. Our goal was to conduct a census and complete interviews with all staff in the survey population. As described in detail in the Survey Completion and Response Rate section below, 1,091 employees, representing 69% of the survey population, completed the survey.
The Survey Instrument
The survey was conducted on-line, using
SurveyMonkey.com, an on-line survey tool. The survey questions were developed in collaboration with the three statewide infrastructure organizations. Prior to data collection, the survey was approved by the Committee for the Protection of Human Subjects at the University of California at Berkeley and then pre-tested by potential respondents. The survey included primarily closed-ended questions and was conducted in English.
The questions in the survey addressed: 2.
3.
a)
b)
Job level: Respondents were asked to select a
pre-defined job level that matched their level of job re -sponsibility
Demographics: age; ethnicity; language capacity; gender
Job history and tenure: previous experience working
directly with young children; tenure in the ECE field;
tenure in current position; tenure in current organiza-tion
Employee characteristics: wages; hours worked per week/per month
Job duties: tasks related to direct client services; re-search, planning and policy; administration
Levels of education and training: highest level of edu-cation; type of degree, if any; college credits related to ECE; non-college credit training related to ECE and other job responsibilities; current participation in a degree program including challenges and desired resources to address challenges
Assessment of current job skills: satisfaction with skill level; preferred methods of attaining new skills and knowledge
Educational aspirations: interest in pursuing addition-al formaddition-al education; chaddition-allenges; resources needed Career aspirations: five-year career goals; assess -ment of skills needed to meet career goals
Data Collection Procedures
Prior to launching the on-line survey, we emailed a
notification letter to all the potential respondents. The
letter described the purpose of the survey, encour-aged participation, and informed the respondents about their rights as research subjects. We then sent
a second email to each subject with a link to the on-line survey. Respondents could complete the survey during the work day, in the evenings, and/or on the weekends. The survey was available between Janu-ary 22, 2009 and March 20, 2009 for the First 5 staff and the child care coordinators and between April 14, 2009 and May 8, 2009 for the R&R staff.
We made many efforts to encourage staff to respond to the survey, including emailing weekly reminders to all potential respondents and working directly with the directors of individual organizations to encourage their staff to participate in the study. In addition, the three statewide organizations frequently encouraged staff in their member organizations to participate in the study. The research team also worked closely
with the three statewide organizations to fix any incor -rect email addresses. The research team was avail-able to respond to email and telephone requests for assistance in completing the survey. The survey took approximately 15 minutes to complete.
Comparing Staff across
Organizational Types: Identifying Job
Levels
Due to the diverse organizational mission and func-tions among the three organizational types and even within individual organizations, staff reported a wide variety of responsibilities and job titles. In order to create a variable that we could use to compare staff in a consistent way across organizational type, a sur-vey question asked respondents to select a “job level that comes closest to what you do.” As discussed in the Data Analysis section, all the data were also ana-lyzed by this job level variable. And, as discussed in the Survey Completion and Response Rate section, we used the job level variable as one way to assess how representative the survey respondents were to the entire universe of staff working in the three orga-nizational types.
Survey Completion and Response
Rate
We received a total of 1,639 email addresses from the R&R Network, the Child Care Coordinators Asso-ciation and the First 5 AssoAsso-ciation. After cleaning the email lists for duplicates, deleting email addresses for staff no longer employed, and adding additional staff
identified during the survey period, our eligible survey
sample included 1,588 staff. Of the eligible sample, 69% of staff completed the survey. The response rate
ranged from 63% for First 5 staff, 70% for R&R staff, and 79% for the child care coordinators and their staff (see Table 1).
Because the First 5 Commission and R&R program staff work within individual organizations, we also looked at the response rate for individual organiza-tions within these two organizational types. Within organizations, the response rates varied from 0% to 100%. However, for almost 60% of both R&R pro-grams and First 5 Commissions, the response rate among the staff was 75% or higher (see Table 2). The four job levels were:
Administrative/technical/program support – I provide administrative, program or computer support to a department(s) or to the agency, for example, filing, data entry, backing up computers, or answering the phones. Usually, my daily tasks are assigned to me and I do not have any supervisory or management responsibilities.
Professional – I implement a project, program, or agency function. Although I am supervised, I decide which tasks I will complete each day. I problem solve and think about the best ways to conduct my job. I do not have any supervisory or management responsibilities.
Supervisor/manager – I supervise other staff and/or manage a program(s) or department(s). For ex-ample, I assign tasks, develop timelines, and develop and monitor project budgets.
Director – For the analysis we combined the two director categories: Assistant director – I play a primary role in the management of the entire organization. I report to my director/executive director; and Direc-tor/executive director – I have primary responsibility for all aspects of my agency. If I work for a non-profit agency, I report to my Board of Directors.
Table 1.
Survey Response Rate: Number of Staff (Percent)
Organizational Type Eligible
Sample Refusal Bounced email No response Completed interviews Response rate Child Care Coordinators
and staff 87 0 (0%) 1 (1%) 17 (20%) 69 79%
First 5 staff 454 21 (5%) 7 (2%) 141 (31%) 285 63%
R&R staff 1,047 24 (2%) 1 (0%) 285 (27%) 737 70%
Total 1,588 45 (3%) 9 (1%) 443 (28%) 1,091 69%
Table 2.
Percentage of Organizations with Various Survey Response Rates
Organizational
Type < 25% response rate response rate25% - 49% response rate50% - 74% response rate75% - 99% 100% response rate
First 5 (n=57) 5% 16% 21% 28% 30%
We attempted to collect responses from all staff (cen-sus) instead of a random sample of staff. Because we did not attain a 100% response rate, we cannot statistically estimate how representative our sample of respondents is of the entire universe of staff work-ing in the three organizational types. However, we felt it would be helpful to assess the distribution of job level in our sample compared to the survey popula-tion of First 5 and R&R staff. We did not conduct this analysis of the child care coordinators because of their high response rate (79%). The two statewide organizations worked with the directors of the local organizations to code the job level of the staff who did not respond to the survey. We then compared the distribution of staff at different job levels in our sample to the survey population.
We were able to collect the job-level information for all the R&R staff who did not respond to the survey and for 85 percent of the First 5 staff who did not re-spond. As displayed in Table 3 and Table 4, the
distri-bution of job levels for the respondents in both types of organizations paralleled the distribution of job lev-els for all staff, with the exception of the administra-tive staff. There was a slightly higher percentage of administrative staff in the population than our sample of respondents.
Data Analysis
Data analyses were completed in several steps. First, SurveyMonkey.com provided a spreadsheet that included each participant’s coded responses for all questions. Next, using PASW Statistics 17.0, we computed frequencies of all questions for participants at each job level, for participants employed at each of the three infrastructure organizations, and for the
entire sample. The final step involved performing in -ferential statistical tests (e.g., chi-square analyses) to
examine trends in the data. All significant results are
reported at a p value of .05 or better.
Table 3.
Distribution of Job Levels for
Participants Employed at Resource and
Referral Programs
Respondents Survey Population Administrative/ technical/support 19% 26% Professional 47% 44% Supervisor/manager 23% 19% Assistant director/ Director 8% 9% Other 4% 2% n 717 1,035Table 4.
Distribution of Job Levels
for Participants Employed at First 5
Commissions
Respondents Survey Population Administrative/ technical/support 18% 26% Professional 34% 32% Supervisor/manager 27% 23% Assistant director 20% 18% Other 1% 1% n 279 420To what extent is the workforce in the infrastructure organizations similar demographically to those work-ing directly with children in child care centers and fam-ily child care homes? Up until now, only impressions or anecdotes were available to answer this question. What emerges from the survey is a more detailed picture of the similarities and differences among the direct and indirect service sectors of the early
child-hood field.
Gender
Similar to the workforce in child care centers and li-censed family child care homes, the workforce in the early childhood infrastructure organizations that par-ticipated in this study was overwhelmingly female. More than nine out of 10 respondents (92%)
identi-fied themselves as female when asked to report their
gender on the survey. Gender varied somewhat by job level. As shown in Table 5, a greater percentage of directors were male (16%) compared to staff in other positions. The percentage of male staff also varied by place of employment. Sixteen percent of First 5 staff were male compared to 8% of child care coordinators and their staff and 5% of staff employed by R&R programs.
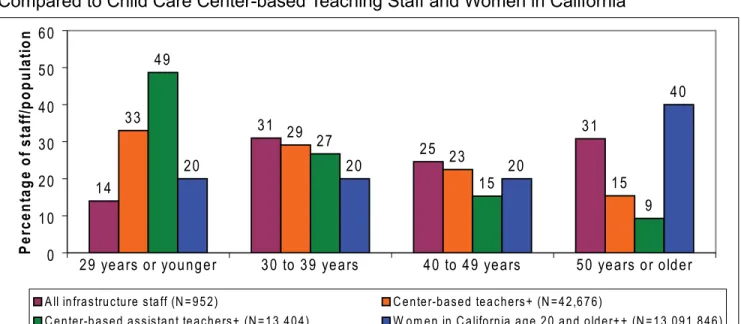
Age
Participants were asked to report their date of birth which allowed us to calculate their age at the time they completed the survey. Only 14% of study par-ticipants were under 30 and 31% were 50 years or older. As shown in Figure 1, compared to women in California, the workforce in the three infrastructure organizations participating in this study were less likely to be younger than 30 years old or 50 years or older, and more likely to be between 30 to 49 years-old. Compared to teachers and assistants who work directly with children in center-based early care and education programs, those participating in the study
were less likely to be younger than 30 years old and more likely to be 50 years or older (Whitebook et al., 2006a), (see Figure 1).
The age distribution of the workforce in the sample differed by job level. As shown in Figure 2, directors were more likely to be 50 years or older than other staff, while staff in administrative and professional job levels included a greater proportion of staff 40 years or younger. More than a quarter of administrative staff (29%) was under 30 years old, compared to 18% of professional staff and only 3% of supervisor/man-agers. None of the directors reported being younger than 30 years old.
The age distribution of the workforce employed in the infrastructure organizations in the sample also dif-fered by place of employment (see Figure 3). Child care coordinators were less likely to be under 30 years of age and more likely to be 50 years or older than their counterparts at First 5 commissions or R&R programs. On average, child care coordinators were older (M = 49 years of age) than staff in First 5 com-missions (M = 44 years of age) who, in turn, were old-er than staff in R&R programs (M = 41 years). Nearly half (49 percent) of staff in R&R programs were 40 years or younger.
Findings
Table 5.
Gender Distribution of the Workforce in
Three Types of Infrastructure Organizations, by
Job Level
Female Male N Administrative staff 91% 9% 173 Professional staff 95% 5% 426 Supervisors/ Managers 91% 9% 254 Directors 85% 16% 110 Other 93% 7% 27 All infrastructure staff 92% 8% 990Who constitutes the workforce in three California early childhood
infrastructure organizations?
Figure 2.
Age Distribution of the Workforce in Three Types of Infrastructure
Organizations, by Job Level
*N includes a small number of staff who reported “other” job level.
29 25 22 24 18 35 23 24 3 34 27 37 0 16 29 14 31 24 31 55 0 10 20 30 40 50 60
29 years or younger 30 to 39 years 40 to 49 years 50 years or older
Pe rc en ta ge o f s ta ff
Adm inistrative staff (N=165) Professional staff (N=412) Supervisors/M anagers (N=244) Directors (N=105) All infrastructure staff (N=952*)
Figure 1.
Age Distribution of the Workforce in Three Types of Infrastructure Organizations,
Compared to Child Care Center-based Teaching Staff and Women in California
+Whitebook et al., (2006a). ++ U.S. Census Bureau, (2008a).
14 31 25 31 33 29 23 15 49 27 15 9 20 20 20 40 0 10 20 30 40 50 60
29 years or younger 30 to 39 years 40 to 49 years 50 years or older
Pe rc en ta ge o f s ta ff/ po pu la tio n
All infrastructure staff (N=952) Center-based teachers+ (N=42,676)
8 33 22 38 0 25 29 46 18 31 25 27 14 31 25 31 0 10 20 30 40 50 60
Under 30 years 30 to 39 years 40 to 49 years 50 years or older
Pe rc en ta ge o f s ta ff
First 5 (N=240) Child Care Coordinators (N=61) R&R (n=652) All infrastructure staff (N=953)
Figure 3.
Age Distribution of the Workforce in Three Types of Infrastructure
Organizations, by Place of Employment
50 31 9 6 4 53 27 8 7 5 37 42 8 8 5 63 16 6 9 13 49 24 11 5 11 0 20 40 60 80
W hite, non-Hispanic Latino/Hispanic Asian/Pacific Islander Black/African Am erican Other ethnicity
Pe rc en ta ge o f s ta ff/ po pu la tio n
All infrastructure staff (N=956) Center teachers+ (N=43,209) Center assistant teachers+ (N=20,833) Center directors+ (N=6,851) W om en in California age 18 and older++ (N=17,453,831)
Figure 4.
Ethnic Distribution of the Workforce in Three Types of Infrastructure
Organizations, Compared to Child Care Center-based Teaching Staff and Directors and
Women in California.
+Whitebook et al., (2006a). ++U.S. Census Bureau (2008b).
Ethnic Background
Similar to the adult female population in California, the workforce employed in the infrastructure organi-zations in our sample is ethnically diverse (see Fig-ure 4). Survey participants were asked to select the ethnic categories that best described their identity. We found that infrastructure staff surveyed were ap-proximately half White, non-Hispanic and one-half were people of color. After White, non-Hispanics (50%), Latinos comprised the second largest racial/ ethnic group (31%).
Figure 4 also shows the ethnic distribution of infra-structure staff compared to the ethnic distribution of California’s center-based teachers, assistant teachers and directors as reported in the California Early Care and Education Workforce Study: Licensed Child Care Centers. Statewide 2006 (Whitebook et al., 2006a). Overall, the ethnic distribution of the workforce rep-resenting infrastructure organizations in this study is similar to that of center-based teachers.
Across job levels as shown in Figure 5, directors were the least ethnically diverse group, and administrative, technical and support staff were the most diverse.
This distribution pattern reflects a similar stratifica -tion found in the center-based early care and educa-tion workforce with those in director roles being less ethnically diverse than others staff. However, those categorized as supervisors/managers were both
younger and more ethnically diverse than other staff. If future directors are drawn from among the supervi-sors/managers, there may be a start towards greater diversity in top leadership positions.
Ethnic distribution among the workforce also varied by infrastructure organization. As shown in Figure 6, R&R programs employed the most diverse pool of staff. More than one-half (56%) of staff at R&R programs were people of color compared with 40% of staff in First 5 Commissions and 24% of the child care coordinators.
Linguistic Background
Survey participants were asked which language(s)
they could speak, read and/or write fluently. As
shown in Figure 7, virtually all staff (98%) reported being able to speak, read and/or write English and one-third (33%) reported being able to speak, read and/or write Spanish. Less than one percent of staff reported being able to speak, read and/or write a lan-guage besides English or Spanish. The workforce represented by the infrastructure organizations in this study was more linguistically diverse than center directors and teachers, but less linguistically diverse than assistants teachers, as described in the Califor-nia Early Care and Education Workforce Study: Li-censed Child Care Center. Statewide 2006 (White-book et al., 2006a) and shown in Figure 8.
41 40 10 6 4 45 36 10 5 4 58 23 7 7 5 11 7 4 3 50 31 9 6 4 76 0 20 40 60 80 W hite,
non-Hispanic Latino/Hispanic Asian/PacificIslander Black/AfricanAm erican O ther ethnicity
Pe rc en ta ge o f s ta ff
Adm inistrative staff (N=167) Professional staff (N=414) Supervisors /M anagers (N=242) Directors (N=106)
All infrastructure staff (N=956*)
Figure 5.
Ethnic distribution of the Workforce in Three Types of Infrastructure
Organizations, by Job Level
60 20 9 7 5 76 10 6 3 5 44 37 9 5 4 50 31 9 6 4 0 20 40 60 80 100
W hite/Non-Hispanic Latino/Hispanic Asian/Pacific
Islander Black/AfricanAm erican O ther
Pe rc en ta ge o f s ta ff
First 5 (N=241) Child Care Coordinators (N=67) R&R (N=650) All infrastructure staff (N=958)
Figure 6.
Ethnic Distribution of the Workforce in Three Types of Infrastructure
Organizations, by Place of Employment
56 4 39 1 63 3 34 0 73 1 26 0 85 1 15 0 67 2 31 0 0 20 40 60 80 100
English+ Spanish++ English and Spanish O ther English, non-Spanish Pe rc en ta ge o f s ta ff
Adm inistrative staff (N=174) Professional staff (N=428) Supervisors/M anagers (N=253) Directors (N=110) All infrastructure staff (N=993*)
Figure 7.
Language Distribution of the Workforce in Three Types of Infrastructure
Organizations, by Job Level
+English and English/Other non-English language, non-Spanish language ++Spanish and Spanish/Other non-Spanish, non-English language *N includes a small number of staff who reported “other” job level.
Language capacity varied by job level as shown in Figure 8. Directors emerged as the least and admin-istrative staff as the most linguistically diverse group.
About one-fifth of directors (22%), 33% of supervi -sors/managers, 47% of professional staff and 53% of administrative staff had the capacity to speak, read and/or write a non-English language. This language
capacity pattern reflects a similar stratification by job
found among the early care and education center-based workforce. Center-center-based Directors were the least linguistically diverse, followed by teachers who were less linguistically diverse than assistant teach-ers.
Linguistic capacity of the workforce varied by the type of infrastructure organization. More than one-third of the R&R staff (38%) reported being able to speak Spanish, compared to about one-quarter of First 5 staff (26%) and 10% of child care coordinators and their staff.
Professional Background, Experience,
and Compensation
Because the workforce in early care and education infrastructure organizations has seldom been the fo-cus of research, many questions about the profes-sional background of its members have been unan-swered. For example, to what extent is this workforce comprised of people with direct experience working with young children in center- and/or home-based early care and education settings? Are members of
this workforce “passing through” the field or does their tenure reflect years of investment in programs
related to young children and families? To explore these questions for the workforce in the three infra-structure organizations in this study, we asked partici-pants about their tenure in their current position and
organization, their job history in the field, and their
experience providing direct services to children birth
to five in an early care and education setting.
47 53 53 47 67 33 78 22 58 43 64 37 51 49 75 25 0 20 40 60 80 100
English only English and non-English or non-English only
Pe rc en ta ge o f s ta ff
Adm inistrative staff (N=174) Professional staff (N=428) Supervisors/M anagers (N=253)
Directors (N=110) All infrastructure staff (N=993*) Center-based teachers+ (N=43,915)
Center-based assistant teachers+ (N=22,420) Center-based directors+ (N=6,890)
Figure 8.
Language Distribution of the Workforce in Three Types of Infrastructure
Organizations, Compared with Child Care Center-based Teaching Staff and Directors with
the Capacity to Communicate in a Language Other Than English, by Job Level
+ Whitebook et al., (2006a).
Tenure in the organization workplace and current position. The infrastructure organizations repre-sented in this study appear to have a relatively stable workforce and provide internal job opportunities for their employees. Survey participants were asked when they began working at their current organiza-tion and when they began working in their current position. As shown in Table 6, infrastructure staff reported longer job tenure than center-based teach-ing staff who work directly with children. In 2005, 61% of teachers and 71% of assistant teachers had
been employed at their centers for five years or less
(Whitebook et al., 2006a), whereas less than half of the workforce (46%) employed in infrastructure orga-nizations participating in this study had been working
at their organizations for five years or less. Almost
one-third (30%) of the workforce in the infrastructure organizations had been at their organization for six to ten years, and nearly one-quarter (24%) had been working in their organization for 11 or more years. Among those working in infrastructure organization, tenure varied by job level. More than one-half of ad-ministrative and professional staff have been at their
place of employment for five years or less compared
with one-third of supervisors/managers and
one-quar-ter of directors. Less than one-fifth of professional
and administrative staff have been employed at their current work place for 11 or more years compared with one-third of staff at all other job levels (see Fig-ure 9). 60 25 13 3 54 27 16 3 32 36 27 6 25 41 22 11 46 30 19 5 0 20 40 60 80
5 or less years 6-10 years 11-20 years 21 or m ore years
Pe rc en ta ge o f s ta ff
Adm inistrative staff (N=182) Professional staff (N=447) Supervisors/M anagers (N=264) Directors (N=116) All infrastructure staff (N=1036*)
Figure 9.
Percentage of the Workforce in Three Types of Infrastructure Organizations with
Different Rates of Tenure at Place of Employment, by Job Level
Table 6.
Percentage of the Workforce in Three Types of Infrastructure Organizations with
Different Rates of Tenure at Place of Employment Compared with Child Care Center-based
Teaching Staff and Directors
5 or less
years 6-10 years 11-20 years 21 or more years N
All infrastructure staff 46 30 19 5 1,036
Center-based teacher+ 61 43,915
Center-based assistant
teachers+ 71 22,420
Center-based directors+ 42 6,890
As shown in Figure 10, across positions, a higher per-centage of the workforce in the infrastructure organi-zations in the sample reported being in their current
position (versus employed in the organization) for five
years or less. Although we did not ask survey par-ticipants about opportunities for advancement
with-in their organizations, this fwith-indwith-ing suggests there is
some mobility within the organizations, particularly for administrative and professional staff. In future stud-ies, the issue of opportunity for advancement within infrastructure organizations could be explored more directly.
Tenure in the field. Slightly more than three-quarters (77%) of the workforce in the infrastructure organiza-tions in this study reported working in the early care
and education field for more than five years. Among
various job positions, supervisors/managers and di-rectors were the most stable group of employees fol-lowed by professional and administrative staff (see Figure 11). Approximately three-quarters of profes-sional staff have worked in the early care and
edu-cation field more than five years ago compared with
58% of administrative staff.
Job history in the ECE field. To ascertain more about this segment of the early care and education workforce’s professional background, we asked sur-vey participants to describe their job history by
indi-cating whether they had worked continuously in the
field, moved in and out of early childhood related jobs, worked mostly in other social service fields or worked mostly in other fields. As shown in Figure 12, 43% worked consistently in the ECE field and 23% worked mostly in other social service fields. Only 18% re -ported working mostly outside of early childhood and
14% reported working in and out of the ECE field.
Less than half of survey participants reported working
consistently in the ECE field, but the distribution of job
history varied somewhat by job level. A higher pro-portion of administrative staff (32%) reported working mostly outside of ECE compared with infrastructure staff at other job levels. A higher proportion of
direc-tors worked mostly in other social service fields (33%)
compared with other infrastructure staff (see Figure 12).
Employment providing direct services to young children. Many members of the workforce employed in the infrastructure organizations represented in this study had experience working directly with young children, often for many years. To further explore job history, we asked survey respondents whether as an adult, they had ever worked for pay providing direct
services to children birth to five in an early care and
education setting. One-half (51%) reported having done so. Experience working directly with young
chil-67 22 9 2 66 23 10 1 60 27 12 2 44 34 19 3 62 25 12 2 0 20 40 60 80
5 or less years 6-10 years 11-20 years 21 or m ore years
Pe rc en ta ge o f s ta ff
Adm inistrative staff (N=181) Professional staff (N=445) Supervisors/Managers (N=262) Directors (N=116) All infrastructure staff (N=1,030*)
Figure 10.
Percentage of the Workforce in Three Types of Infrastructure Organizations with
Different Rates of Tenure in their Current Position, by Job Level
42 26 17 15 26 22 33 20 12 19 33 36 9 25 29 38 23 22 30 25 0 10 20 30 40 50
5 or less years 6-10 years 11-20 years 21 or m ore years
Pe rc en ta ge o f s ta ff
Adm inistrative staff (N=157) Professional staff (N=405) Supervisors/M anagers (N=240) Directors (N=106) All infrastructure staff (N=930*)
Figure 11.
Percentage of the Workforce in Three Types of Infrastructure Organizations with
Different Rates of Tenure in the Early Care and Education Field, by Job Level
*N includes a small number of staff who reported “other” job level.
35 12 17 32 5 45 16 20 18 2 47 15 26 11 2 37 14 33 15 1 43 14 23 18 2 0 10 20 30 40 50 60 W orked consistently in
ECE field W orked in and out ofthe ECE field W orked m ostly in othersocial service fields of ECE, social servicesW orked m ostly outside fields O ther Pe rc en ta ge o f s ta ff
Adm inistrative staff (N=156) Professional staff (N=435) Supervisors/Managers (N=262)
Directors (N=113) All infrastructure staff (N=990*)
Figure 12.
Percentage of the Workforce in Three Types of Infrastructure Organizations Who
Worked In and Out of the ECE Field, by Job Level
40 25 17 19 32 20 19 30 27 18 17 39 27 37 19 17 31 21 18 29 0 10 20 30 40 50
3 or less years 4-6 years 7-10 years 11 or m ore years
Pe rc en ta ge o f s ta ff
Adm inistrative staff (N=65) Professional staff (N=236) Supervisors/M anagers (N=135) Directors (N=52) All infrastructure staff (N=501*)
Figure 14.
Percentage of the Workforce in Three Types of Infrastructure Organizations with
Different Rates of Tenure Providing Direct Services to Young Children, by Job Level
*N includes a small number of staff who reported “other” job level.
38 56 55 46 51 0 20 40 60 80
Adm inistrative staff
(N=181) Professional staff(N=438) Managers (N=255)Supervisors/ Directors (N=116) All infrastructure staff(N=1015*)
Pe rc en ta ge o f s ta ff