Annual Performance Review
North Pacific Groundfish and Halibut Observer Program
First and Preliminary 2013 Version
Craig H. Faunce1, Jason Gasper2, Farron Wallace1, Jennifer Cahalan1,3, Jennifer Mondragon3,
Teresa Amar4, Sandra Lowe4 and Ray Webster5
1Fisheries Monitoring and Analysis Division, Alaska Fisheries Science Center, NOAA Fisheries, Seattle, WA. 2Sustainable Fisheries Division, Alaska Regional Office, NOAA Fisheries, Juneau, AK.
3Pacific States Marine Fisheries Commission, Seattle, WA.
4Resource Ecology and Fisheries Management Division, Alaska Fisheries Science Center, NOAA Fisheries, Seattle, WA. 5International Pacific Halibut Commission, Seattle, WA.
Disclaimer: This document is intended to provide scientific data and where appropriate, advice in the areas of regulatory management, natural science, mathematics, and statistics as they relate to observer deployment and sampling in the groundfish and halibut fisheries of the North Pacific. Any opinions expressed in this document are those of the authors and do not
CONTENTS
INTRODUCTION ... 3
ASSESSMENT OF THE SAMPLING FRAMES ... 4
Dockside Deployments ... 4
BSAI Cod Voluntary 100% Fleet ... 5
Full Coverage Fleet ... 5
Partial Coverage Fleet ... 5
Trip Selection ... 6
Vessel Selection ... 7
SPECIAL CONDITIONS ... 8
Conditional releases ... 8
Requested by the Vessel Operators ... 8
Requested by Observer Provider ... 10
Deliveries to a Tender vessel ... 10
BETWEEN YEAR AND STRATA COMPARISONS ... 13
Identification of Individual Fishing Trips in Landings Data ... 13
Achieved Coverage rates in Early 2013 ... 13
BILLABLE DAYS ... 17
DEPARTURES FROM INTENDED SAMPLING DESIGN ... 18
PROPOSED DEPLOYMENT PLAN FOR 2014 ... 18
REFERENCES ... 19
INTRODUCTION
In partnership with the North Pacific Fishery Management Council (Council), the National Marine Fisheries Service (NMFS) restructured the North Pacific Groundfish Observer Program (Observer Program). The new North Pacific Groundfish and Halibut Observer Program went into effect on January 1, 2013. The restructured program enables ongoing analysis and evaluation of the deployment of
observers and the data collected in the program through an Annual Deployment Plan (ADP) and associated review process. The ADP process was developed to provide enough flexibility so that new scientific information could be incorporated, on annual basis, to adjust observer coverage to improve estimation, and maintain transparent public review of deployment.
As outlined in the 2013 ADP (NMFS, 2013). NMFS will present an annual report to the Council during its June meeting that provides an evaluation of observer activities, costs, sampling levels, issues, and proposed changes to the deployment plan for the following year. The annual report will inform NMFS, the Council, and the public about how well various aspects of the program are working, and consequently lead to recommendations through the ADP. This report is the first of the annual reviews and contains a scientific evaluation of the restructured program in early 2013. The report for 2013 is limited in the types of comparisons and inferences that can be made because only the first 16 weeks of data that had been collected under the restructured program is considered at the time of this writing to be quality controlled for this purpose. Thus, as stated in the 2013 ADP, this report is a progress report on implementation during the first 16 weeks of 2013. The first full annual review of the 2013 Observer Program will occur in June 2014.
As a first step towards developing a draft ADP for 2014, NMFS is providing recommendations and analysis from the Observer Science Committee (OSC) for Council comment. The final ADP will contain the NMFS analysis and recommendation on deployment using a synthesis of Council input and OSC recommendations on deployment methods. The OSC is an interagency working group enabled by the Observer Program that provides scientific advice to NMFS on deployment methods. Group members author this report.
Council recommendations will be considered by NMFS for incorporation into the draft ADP. The draft ADP will be available for review by the Council, the Scientific and Statistical Committee (SSC), the Plan Teams, and other Council advisory groups by September 1, 2013. NMFS will consider recommendations made by the Council during its October 2013 meeting to modify the draft ADP, recognizing limitations on the types of analysis that can be completed prior to finalizing the ADP in early December 2013. This OSC report is broken into two sections: the Assessment of the Sampling Frame and the Proposed Deployment Plan. The assessment of the sampling frame provides an evaluation of observer activities, costs, sampling levels, and issues. As noted above, 2013 is the first year of the restructured program, so the assessment is a status report of implementation to-date in 2013. The Proposed Deployment Plan describes the proposed sampling design for 2014. In the future, the Proposed Deployment Plan will use information from the prior year’s deployment to identify areas where improvements are needed 1) to collect the data necessary to manage the fisheries; 2) maintain the scientific goals of unbiased data collection; and 3) accomplish the most effective and efficient use of the funds collected through the observer fee. Since a full year of data has not yet been collected under the restructured program, the Proposed Deployment Plan for 2014 relies heavily on analysis conducted in the 2013 ADP.
ASSESSMENT OF THE SAMPLING FRAMES
The number of vessels, trips, observer coverage rates, and compliance with ADP assumptions were evaluated for each stratum. Here a stratum is defined as fishing operations subject to different observer coverage rules. Only those operations under the authority of NMFS to deploy observers under the 2013 ADP were considered in these evaluations.
These evaluations depend on identifying individual fishing trips. This can be accomplished for the partial coverage trip-selection stratum by combining information stored in the Alaska Fisheries Science Center’s Fisheries Monitoring and Analysis Division observer databases (NORPAC and ODDS) and the Alaska interagency reporting system (eLandings). Since some observer deployment and at-sea data may not be immediately available to the Observer Program, only the first sixteen weeks of 2013 were included in analyses.
D
OCKSIDED
EPLOYMENTSDockside observer duties vary between those observers that are deployed to monitor deliveries that occur in full-coverage operations and those that are deployed outside of full coverage operations. Full-coverage dockside operations include only those processors that take deliveries from American Fisheries Act vessels delivering pollock in the Bering Sea and Aleutian Islands. These processors are required by federal regulation to have observers available to sample shoreside deliveries while they are processing (accepting) deliveries of BSAI AFA pollock. In these full-coverage operations, an observer records delivery information, salmon bycatch information (e.g. total number of fish), collects specimens for genetic analysis from salmon, and collects otoliths and lengths from groundfish (to support stock assessments) Observers collect salmon genetic tissues according to the protocols of Pella and Geiger (2009), which requires a systematic sample of every nth salmon to ensure a uniform random sample of the
bycatch is obtained.
Observers in plants not receiving AFA pollock deliveries are in the partial coverage category. The 2013 ADP established the collection of tissue samples from Chinook salmon in the Gulf of Alaska pollock fishery as sampling priority for shoreside observers. Observers in this situation are supposed to be notified by industry of a pollock delivery- if this condition is not met the delivery will not be monitored. Once in the plant, the partial-coverage observer records delivery information, salmon bycatch information (e.g. total number of fish) and collect specimens for genetic analysis from salmon according to the protocols of Pella and Geiger (2009). Shoreside counts of salmon are used to estimate salmon bycatch in the Catch Accounting System (CAS) only when the trip is observed whereas genetic samples are
collected from both observed and unobserved trips.
Since catch delivered by a tender is sorted at sea and may include the harvests of several vessels, the observer does not sample from or monitor these offloads. They record only the basic information on the tender vessel from information on the landing report: date, gear, area fished, delivered weight and program management code.
In the first sixteen weeks of 2013, a total of 748 deliveries of AFA pollock were made. True to
expectations of the 2013 ADP, all of these deliveries were observed dockside and none of the observers were restructured observers (that is, employed by the observer provider company under contract by
NMFS to provide coverage for the partial coverage strata). During the same time period, 439 non-AFA pollock deliveries were made and eighty-eight percent of these were observed and sampled for salmon genetics (Table 1). In 2013, Kodiak was the principal port of deployment for partial coverage dockside observers since this port received the most Gulf of Alaska pollock deliveries and the port is relatively easy to reach. Kodiak had all but one delivery observed .
Table 1. Number of non-AFA pollock deliveries observed and unobserved.
Port Unobserved Observed Total Percent observed
Akutan 31 6 37 16.2
Inshore Floating- Dutch 2 6 8 75.0
King Cove 9 0 9 0.0
Kodiak 1 368 369 99.7
Seward 6 0 6 0.0
Sand Point 2 8 10 80.0
Total 51 388 439 88.4
BSAI
C
ODV
OLUNTARY100%
F
LEETForty trawl vessels signed a compliance agreement with NMFS to carry full observer coverage when fishing Pacific cod in the BSAI. Of these vessels, 35 vessels ranging in size from 85 to 149 feet length-over-all (LOA) conducted 353 trips during the first sixteen weeks of 2013. The remaining 5 vessels that signed agreements did not land fish predominantly comprised of Pacific cod in the BSAI. NORPAC data confirms that all BSAI 100% Cod trips were observed. No restructured observers were used for voluntary deployments, in accordance with agreements specified in the 2013 ADP and letters of agreement sent to NMFS by participating parties.
F
ULLC
OVERAGEF
LEETThe catcher processor vessels Kruzof, Judi B, and Amber Nicole requested and were removed from the full coverage stratum using exemptions at 50 CFR 679.51(a)(2)(v). A total of 2,647 trips were made by 151 vessels ranging from 51 to 376 feet LOA in the full coverage stratum during the first sixteen weeks of 2013. NORPAC data used to identify which trips are observed show that 99.7% of these trips were observed. However other data sources in NORPAC (e.g. haul information) indicate that the three trips with missing records were in fact observed. No restructured observers were used in accordance with the 2013 ADP.
P
ARTIALC
OVERAGEF
LEETThe Partial Coverage category includes vessels whose fishing operations are not required by federal regulation to always carry an observer. This category is divided into two sampling strata depending on the method used to deploy observers: trip-selection and vessel-selection.
• Trip selection vessels are those that are required to log trips into the Observer Declare and Deploy System (ODDS) using a NMFS supplied username and password. Each logged trip is assigned a
random number that determines whether a trip is to be observed. The sampling frame for trip-selection is generated one trip at a time.
• Vessel-selection vessels are those that are selected to have every trip observed for a two-month period of the year. From the pool of vessels that fished in the same two-month period in 2012, a number of vessels are randomly chosen for observer coverage. Only those vessels selected for coverage are provided access to the Vessels Assessment Logging System (VALS) in which they may petition NMFS for a conditional release of observer coverage. A conditional release is a case where the NMFS has decided under certain conditions to release the vessel from the
observer coverage requirement for a period of time. If a vessel requests a conditional release from coverage through the VALS, NMFS follows up by contacting the vessel, conducting a visit and inspection of the vessel, and recording the results of the vessel assessment to be used in future vessel selections.
Trip Selection
A total of 1,300 trips were made by 206 vessels ranging from 58 to 176 feet in length in this stratum during the first sixteen weeks of 2013. Observer (NORPAC) data indicates that 17.7% of these trips were observed.
ODDS Performance
Non-randomness in the random selection of trips for observer coverage can lead to bias in deployments of observers that could be reflected in the final catch estimates. When a trip is logged into the ODDS, it is assigned a random number. If the random number generated for that trip is below a pre-programmed critical value, the trip is selected for observer coverage. After the launch of the 2013 Observer Program, a feature was added to ODDS to permanently store the random number assigned to a trip to allow tracking and evaluation of the generation and assignment of random numbers. Between February 14th and May
22nd, 1,272 trips were logged into the ODDS. From these records, there appears to be no pattern in the
random number over time (Figure 1). Selection of trips for observer coverage based solely on the assigned random number is at 15.8 %, which is very similar to the anticipated rate of 14-15% in the 2013 ADP.
The rate of selected trips from the ODDS random number is not the same as the rate of observed trips. The differences are due to the fact that not all trips that are entered into ODDS are actually realized by the vessel. There is an opportunity for an ODDS user to cancel every trip that has been selected for coverage. However, ODDS automatically selects the operators next trip to be observed if the vessel operator had cancelled a “to-be observed” trip.
Figure 1. Random number used in ODDS organized by logged trip date. Each number is tied to a logged trip. Trips below the red line were selected for observer coverage based on the random number.
Vessel Selection
A total of 141 vessels ranging from 40 to 57 feet LOA in length made 507 deliveries in this stratum during the first sixteen weeks of 2013. Over both two-month sample periods, 11.8% of trips in this stratum were observed.
Two vessel-selections were conducted during the first 16 weeks of 2013. The NMFS targeted a fixed sample size based on the 2013 ADP. The targeted number of observed vessels for each two-month period (sample size) was equivalent to 11% of the number of vessels that fished in each selection period during 2011.
In each selection, a list of vessels identified as likely vessels to fish in the desired time period based on past activity were generated. Each vessel was assigned a random number. Vessels were then put into ascending order according to their random number, and the first n vessels were selected for observer coverage where n is the number of vessels to be selected.
The Agency over-sampled (that is, selected more vessels to carry observers than was necessary) in each selection to allow for changes in the vessels anticipated to fish in the upcoming two month-period. To evaluate how much over-sampling was necessary, the similarity between the list of vessels in this stratum that fished between 2009 & 2010, 2010 & 2011, and 2011 & 2012 were evaluated prior to the selection. The weighted average across the three years indicated that the NMFS should expect that 77% of the vessels that fished in the first two months of 2012 would also fish in the first two months of 2013. For this first selection period, 74 vessels were identified as potential candidates for selection and assigned random numbers (fished in the same two months in 2012). The NMFS targeted sample size was seven vessels to carry observers during January and February of 2013. Therefore the NMFS selected nine vessels to carry observers during the first two months of 2013 (Table 2). Three of these selected vessels did not have valid Federal Fisheries Permits, reducing the number of valid selected vessels to six. Of the
74 vessels that were identified as potential candidates from 2012, only 28 actually fished in the first period of 2013 (a smaller set of vessels fished in both years than expected) and six new vessels fished as well. Only two of 34 vessels that fished in the first two months of 2013 were observed in this stratum. This equates to a coverage rate of 5.8% of the vessels that fished in the January – February period (Table 2).
In the second two-month period (March-April), 181 vessels were identified as potential candidates to carry observers and assigned random numbers. Making the same comparisons as for the Jan-Feb period, the NMFS expected that only 73% of the vessels identified from 2012 activity would fish in 2013. Based on the Jan-Feb randomization process, the NMFS anticipated that 14% of selected vessels would
surrender their FFPs and 28% would be granted conditional releases. Hence, although the NMFS targeted 17 vessels to carry observers during March and April of 2013, twenty-nine were selected for coverage (Table 2). One hundred and nine (61%) of the 181 potential candidate vessels from 2012 actually fished in the third and fourth months of 2013. A total of 135 vessels fished during March and April of 2013, and of these 13 carried observers. Based on vessels, this equates to a coverage rate of 9.6% (Table 2).
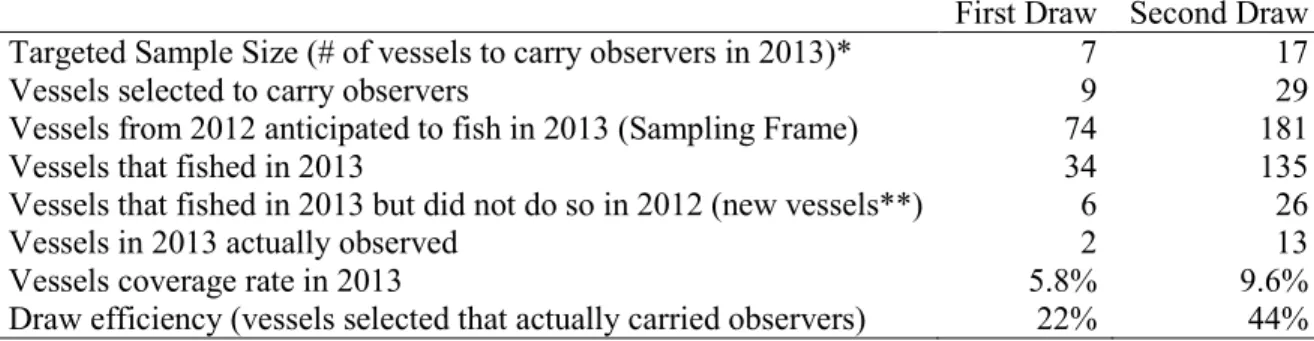
Table 2. Vessel-selection metrics from the first and second selection draws of 2013. The first vessel-selection draw was for January-February and the second was for March-April.
First Draw Second Draw Targeted Sample Size (# of vessels to carry observers in 2013)* 7 17
Vessels selected to carry observers 9 29
Vessels from 2012 anticipated to fish in 2013 (Sampling Frame) 74 181
Vessels that fished in 2013 34 135
Vessels that fished in 2013 but did not do so in 2012 (new vessels**) 6 26
Vessels in 2013 actually observed 2 13
Vessels coverage rate in 2013 5.8% 9.6% Draw efficiency (vessels selected that actually carried observers) 22% 44% *equivalent to 11% of the number of vessels that fished in 2011. ** these vessels had no chance of being selected for coverage.
SPECIAL CONDITIONS
C
ONDITIONAL RELEASESRequested by the Vessel Operators
Trips were conditionally released when vessels provided a robust argument that either crew or an IFQ holder would be displaced by an observer. Of the 32 conditional release requests by vessel operators, 21 were granted (66%). Most release requests (28 requests) originated from vessels in the vessel selection stratum. Of the granted releases, 14 were crew releases (67%), 6 were IFQ holder releases (29%), and one was due to a life raft having inadequate capacity to accommodate an observer (5%). The duration of released periods (during which an observer is not required) ranged from a minimum of 4 days to several months (max 109 days), with the median duration being 38 days. The size of vessels requesting releases ranged from 41 feet to 58 feet LOA.
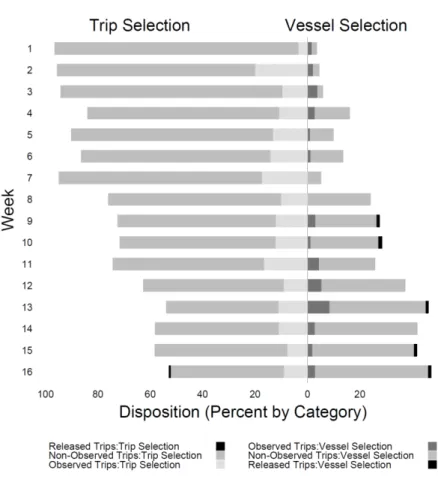
To evaluate the distribution of trip outcomes, all trips occurring within a calendar week that were
observed, not-observed, and those that were released from coverage were summarized across both vessel and trip selection strata (Table 3).
Table 3. The total number of trips taken in the first sixteen weeks of 2013 by vessels in the partial coverage category. Trip totals will not sum to totals in other tables because some trips contain deliveries that span multiple weeks and are “double-counted” in this table.
Week Total # Trips: Trip Selection Vessel Selection Total # Trips:
1 54 2 2 86 4 3 97 6 4 146 28 5 164 18 6 133 21 7 92 5 8 60 19 9 71 27 10 58 23 11 147 51 12 104 62 13 63 54 14 79 57 15 60 43 16 104 93
Figure 2. The relative percentages of trip dispositions for trip and vessel selection strata as a function of calendar week. Trip totals for each week are provided in Table 2.
Requested by Observer Provider
A total of 20 trips were not observed that should have been due to the failure of an observer to appear at the scheduled time of departure. These NMFS-issued releases were almost all during the first month of the program when a larger than expected number of “selected to be observed” trips resulted in a shortage of trained observers to deploy (Table 4).
Table 4. NMFS issued trip releases due to a lack of an observer.
Port Jan Feb Mar Apr May Totals
Adak 0 0 1 0 0 1 Akutan 3 0 0 0 0 3 Dutch Harbor 7 0 0 0 0 7 Kodiak 5 0 0 0 0 5 Sand Point 3 0 0 0 1 4 Totals 18 0 1 0 1 20
D
ELIVERIES TO AT
ENDER VESSELNew definitions of a trip for the purposes of observer coverage requirements differ depending on the type of activity a vessel is engaged in. For a catcher vessel delivering to a shoreside processor or stationary floating processor, a trip is defined as the period of time that begins when a catcher vessel departs a port to harvest fish until the offload or transfer of all fish from that vessel. In contrast, for a catcher vessel delivering to a tender vessel, a trip is defined as the period of time that begins when a catcher vessel departs from port to harvest fish until the vessel returns to a port in which a shoreside processor or stationary floating processor with a valid FPP is located (§679.2). The definition of a tender trip allows a vessel to stay at-sea fishing and make multiple deliveries without ending the trip. There may be incentive to preferentially fish and made deliveries to a tender when unobserved. This situation should only occur in the trip-selection stratum; since in vessel-selection boats are observed for all activities during a two-month period. For comparison, trips were tallied by observed status, tender delivery status, and deployment stratum (Table 5). Methods used to identify tender trips are described in the next section. Trips tallied by fishery, defined as a combination of gear, location, and predominant species (target), observer status, tender status and deployment strata are also provided (Table 6).
For those trips (in the partial coverage trip-selection stratum) that included at least one delivery to a tender, the number of deliveries per trip tended to be greater in unobserved trips compared to observed trips (Figure 3). Note that few trips with tender deliveries were observed and only a few observations are available for comparisons.
Similarly, distributions of trip duration (number of days per trip) showed evidence that observed trips were typically shorter than unobserved trips (Figure 4) in the trip-selection stratum. This trend was less evident in the vessel selection stratum. Again, note that there are limited data presented here from which inferences can be drawn.
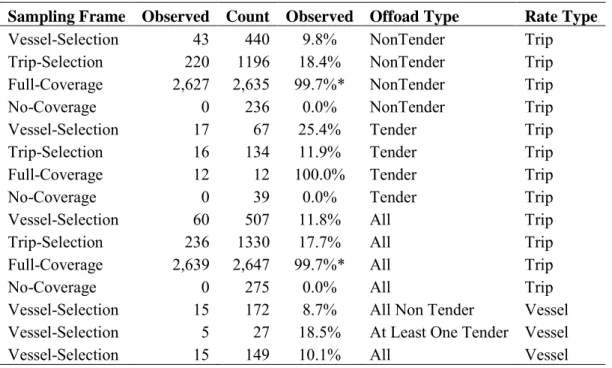
Table 5. Number of deliveries made in each stratum, by observation status, whether a delivery was made to a tender vessel (offload type) and the sampling unit used (Rate Type). *: Observer data confirms that all trips were observed. This number is less than 100% because a field in NORPAC had not yet been updated in observer debriefing at the time of this writing.
Sampling Frame Observed Count Observed Offoad Type Rate Type
Vessel-Selection 43 440 9.8% NonTender Trip Trip-Selection 220 1196 18.4% NonTender Trip Full-Coverage 2,627 2,635 99.7%* NonTender Trip No-Coverage 0 236 0.0% NonTender Trip Vessel-Selection 17 67 25.4% Tender Trip Trip-Selection 16 134 11.9% Tender Trip Full-Coverage 12 12 100.0% Tender Trip No-Coverage 0 39 0.0% Tender Trip Vessel-Selection 60 507 11.8% All Trip Trip-Selection 236 1330 17.7% All Trip Full-Coverage 2,639 2,647 99.7%* All Trip No-Coverage 0 275 0.0% All Trip Vessel-Selection 15 172 8.7% All Non Tender Vessel Vessel-Selection 5 27 18.5% At Least One Tender Vessel Vessel-Selection 15 149 10.1% All Vessel
Table 6. Number of deliveries to a tender vessel organized by gear, NMFS area_Target species, observation status and partial coverage selection pool. Gear codes: HAL=Hook and Line, POT=Pot, TRW=Trawl. Target codes: COD=Pacific cod, POL=walleye pollock. Since all deliveries are labeled as belonging to a tender trip if one delivery in that trip were made to a tender, some gear, areas, and target species combinations in this table do not represent activities typically associated with tender deliveries.
Total Deliveries Selection
Gear_Area_Target Deliveries Observed Pool
HAL_620_COD 1 0 Vessel HAL_630_COD 48 7 Vessel POT_610_COD 9 8 Vessel POT_620_COD 1 0 Vessel POT_630_COD 6 0 Vessel POT_BS_COD 2 2 Vessel HAL_620_COD 7 1 Trip HAL_620_HBT 1 0 Trip HAL_620_POL 1 0 Trip HAL_630_COD 5 0 Trip POT_610_COD 15 1 Trip POT_620_COD 4 0 Trip POT_630_COD 13 1 Trip POT_BS_COD 13 0 Trip TRW_610_COD 31 1 Trip TRW_610_POL 8 1 Trip TRW_620_COD 34 7 Trip TRW_620_POL 20 4 Trip TRW_630_ATH 2 0 Trip TRW_630_COD 2 0 Trip
Figure 3. Distribution of the number of deliveries made in a trip in which at least one delivery was made to a tender vessel presented by observation status. Distinguishing individual trips (groups of tender deliveries) for vessel-selection operations is not possible with available data.
Figure 4. Distribution of the number of days fished in a trip by vessels in the partial coverage pool organized by observation status and whether or not the delivery was made to a tender. Separating deliveries from trips for vessel-selection operations is not possible with available data. The relative frequencies (vertical axis) in each plot sum to one.
BETWEEN YEAR AND STRATA COMPARISONS
I
DENTIFICATION OFI
NDIVIDUALF
ISHINGT
RIPS INL
ANDINGSD
ATAThis section includes data collected from January 1, 2012 to May 23, 2013. To accurately assess deployment patterns and observer coverage rates under the restructured observer program, it was necessary to identify individual fishing trips, both observed and unobserved in the landings data. In the partial trip-selection stratum, individual fishing trips are the sampling unit and form the basis for observer coverage selection. Currently, landings data do not identify fishing trips, but instead individual deliveries are recorded based on management program (IFQ, CDQ, etc.), NMFS reporting areas, and other
variables. When deliveries are made to two different processing plants or to tenders, determining which landings correspond to individual fishing trips can be difficult. For the partial coverage trip-selection stratum however, the ODDS data can be used to group most landings to the appropriate trip, although currently there is no explicit linkage between the two data sources. Therefore the following routine was used in an attempt to match trips logged into ODDS and the associated landings data.
The landings data (from eLandings database) had 35,091 landings records. These represent one record for each delivery, NMFS reporting area, and management program with trip targets, gear types, and dates also identified. Based on this information, the landings that occurred under the partial coverage stratum of the restructured (2013) observer program were identified.
Data from the ODDS trip log system contained records for 2,122 logged trips in 2013. Trips were required to be logged if the vessel was in the partial-coverage-trips stratum or part of the BSAI voluntary Pacific cod cooperative. Cancelled trips and BSAI cod trips were removed from the data. All remaining trips were ordered within each vessel and the date range between when a trip’s logged start date (planned trip start) and the next trip’s logged start date was identified. This date range was used to identify landings records (based on landing date) that were probably made on that logged trip; all landings that fell within this date range were attributed to that logged trip. For each logged trip, there may be several landings since deliveries may be split, be associated with multiple management programs, or from several NMFS reporting areas. In addition, multiple deliveries to tenders are grouped to a single fishing (logged) trip. There were 23 landings where the appropriate logged ODDS trips could not be identified. This may be because the trip started in December 2012, the logged fishing dates were inaccurate (changed before the trip began and the new dates not updated in ODDS), or the trip was not logged. Where possible, we attempted to identify and appropriately process these cases, however, this was not always possible given time and information constraints.
For landings made outside of the partial coverage trip-selection stratum, the landing report number was assigned as their trip identifier (this assumes one report ID for each trip). In contrast, trip identifiers were assigned to landings in the trip-selection coverage stratum to include all landings associated with that fishing trip based on ODDS records.
A
CHIEVEDC
OVERAGE RATES INE
ARLY2013
To assess the distribution of observer coverage in the various fisheries, graphs depicting the intensity of coverage by week of the year and gear-area-target species combination were constructed (Figure 5). Only the first 16 weeks of data were included from each year. Each cell in the plot depicts a specific type of fishing (vertical axis) for a given week (horizontal axis); e.g. Bering Sea yellowfin sole trawl fishing in week 3 of 2012. Note that in the Gulf and Aleutian Islands, area is defined as the NMFS reporting area while all the reporting areas in the Bering Sea are pooled.
Each cell is labeled with the number of trips (as defined above) that fall within the cell while the color of the cell label indicates the number of trips that were in the zero-coverage stratum, noting that there is a difference between a cell with no observed trips when none were required and having no coverage where all trips were subject to at least some observer coverage requirement. A cell where none of the trips required any coverage (zero coverage stratum, e.g. 2012 halibut target in any area) has a white label. A cell where some of the trips did not have observer requirements has a brown label (mix of zero coverage trips and partial or full coverage trips occurred), and cells where all trips would have been subject to coverage requirements have a black label (all trips were in either partial or full coverage strata). In addition, the cell (background) color indicates the proportion of trips in a cell that were observed; if none of the trips in a cell are observed the label is bold and italicized hence differentiating two close shades of grey (little coverage and no coverage; Figure 5).
Some trips can occur in multiple cells, for example if fishing occurred in two different NMFS areas or the trip spanned multiple weeks. Hence the total number of ‘trips’ in these cells is greater than the actual number of fishing trips (leave port, go fishing, return to port) that occurred. In addition, the number of trips in each cell includes trips that fall into different sampling strata (e.g. full and partial coverage). Using the same type of graph in Figure 5 but focusing only on the 2013 observer deployments, trips were separated into the same cells (weeks and gear-area-target species) according to the sampling strata (Figure 6). Cells in which no trips were observed have white labels (number of trips), while cells with some trips observed have black labels. As expected, no fishing was observed in the zero-observer coverage required stratum, and there are only two cells in the full observer coverage stratum that did not have all trips observed (Figure 6). These full coverage trips were probably observed; however, all the data from these trips are not yet available.
Figure 5 Distribution of fishing trips by gear-area-target species (vertical axis) for each week (horizontal axis). The cell label (text in the cell) indicates the number of fishing trips that occurred. The color of the text indicates which sample strata are represented in the cell, e.g. if all trips that occurred in the cell were in the zero-coverage stratum (e.g. <40ft) the label is
BILLABLE DAYS
It is important to realize that while most discussion about observer deployment in this preliminary review has been focused on coverage rates planned vs. those achieved; NMFS budgets determine coverage amounts (sample size). The amount of observer days billable under contract divided by the number of fishing days is the rate of observer deployment in days. The days billable represents a finite budget while the amount of fishing effort is variable. Consequently, the observer deployment rates are variable, and these rates may need to change during the year. The planned coverage rate used in the 2013 ADP was calculated from budget, cost per unit (days), and fishing effort data from two years prior. As already stated, realized coverage rates are based on the intersection between current budget, fishing effort and projected (deployment) rates of coverage.
The amount of billable days was aggregated by week and compared to the projections used in the 2013 ADP. While these values are continuously compared and updated by the Observer Program, here we limit data to the first 16 weeks of 2013 (Figure 7). The actual billable days has continually exceeded projections in the Trip Selection stratum.
Figure 7. Trajectories of the cumulative number of billable days projected from simulations (2013 ADP) and 2013 actual monthly costs.
DEPARTURES FROM INTENDED SAMPLING DESIGN
These are preliminary results and only represent the first few months of 2013; hence caution should be used when trying to interpret the importance of these findings.
• Contrary to the belief that all Pollock offloads were monitored dockside, only 88% of Pollock deliveries outside of the AFA actually were observed.
• Conditional releases issued by NMFS have the potential to cause biased estimates of catch and discard if these vessels behave in a different manner (locations, catch, discard rates and species) than those vessels that are not released.
• The lack of a definitive list of vessels from which to make selections for observer coverage in the vessel-selection portion of the partial coverage stratum also makes for inefficient selection draws. Reasons for this include:
o Many vessels that were identified as potential vessels for observer coverage from 2012
data did not fish in the following year.
o Vessels that did not fish in the previous year are not included in the selection process
(new vessels are not subject to being observed).
o Since each vessel-selection draw is conducted 60 days in advance of the first day of the
scheduled period to carry an observer, those draws are not as efficient as possible since they cannot be informed from the results of the draw immediately prior.
• There are data issues that make analyses of observer deployment difficult. For example:
o For trip-selection, while the ODDS data can be used to group most landings to the
appropriate trip, currently there is no explicit linkage between the two data sources.
o Identifying trips in vessel-selection and no-selection pools is difficult to accomplish if
there are multiple landing reports submitted for a trip.
• There are many factors that impact the ability of NMFS to accurately predict what budgets and selection rates are appropriate. These include:
o Trip length may be different when observed compared to when unobserved, o Fleet size and fishing effort may be different from past years,
o The realized selection rate may not equal the programmed selection rate.
PROPOSED DEPLOYMENT PLAN FOR 2014
Given the preliminary nature of the available data, our group does not recommend major changes to the 2013 ADP at this time. However, we see that the definition of a trip currently allows for differences in vessel behavior when delivering to a tender. For example, in the limited data collected so far in 2013, trips in trip-selection made to a tender have more deliveries when unobserved and also tend to be longer in duration.
REFERENCES
NMFS (National Marine Fisheries Service). 2013. 2013 Annual Deployment Plan for Observers in the Groundfish and Halibut Fisheries off Alaska. 39 pages plus appendices. Accessed on May 27th,
2013 at http://alaskafisheries.noaa.gov/sustainablefisheries/observers/ADP_Final_2013.pdf. Pella, J.J. and H.J. Geiger. 2009. Sampling considerations for estimating geographic origins of Chinook
salmon bycatch in the Bering Sea Pollock fishery. Alaska Department of Fish and Game, Special Publication No. 09-08, Anchorage.
APPENDIX
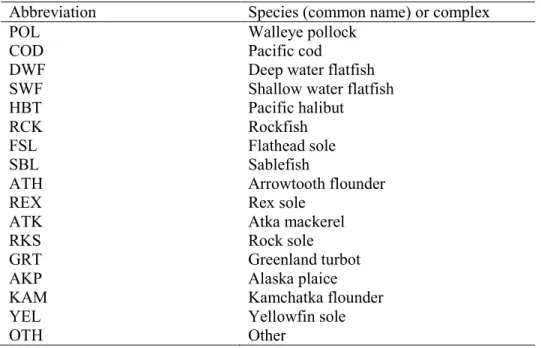
Table of abbreviations used for Target in Figures.
Abbreviation Species (common name) or complex
POL Walleye pollock
COD Pacific cod
DWF Deep water flatfish SWF Shallow water flatfish HBT Pacific halibut
RCK Rockfish
FSL Flathead sole
SBL Sablefish
ATH Arrowtooth flounder
REX Rex sole
ATK Atka mackerel
RKS Rock sole
GRT Greenland turbot
AKP Alaska plaice
KAM Kamchatka flounder
YEL Yellowfin sole