Complex Systems Informatics and Modeling Quarterly (CSIMQ) eISSN: 2255-9922
Published online by RTU Press, https://csimq-journals.rtu.lv Article 97, Issue 17, December 2018/January 2019, Pages 1–23 https://doi.org/10.7250/csimq.2018-17.01
Smart Data for Genomic Information Systems: the SILE Method
Ana León Palacio*
and Óscar Pastor López
Research Center on Software Production Methods (PROS), Universitat Politècnica de València, Valencia, 46022, Spain
[email protected], [email protected]
Abstract. During the last two decades, data generated by Next Generation Sequencing Technologies have revolutionized our understanding of human biology and improved the study on how changes (variations) in the DNA are involved in the risk of suffering a certain disease. A huge amount of genomic data is publicly available and frequently used by the research community in order to extract meaningful and reliable gene-disease relationships. However, the management of this exponential growth of data has become a challenge for biologists. Under such a Big Data problem perspective, they are forced to delve into a lake of complex data, spread in over one thousand heterogeneous repositories, represented in multiple formats and with different levels of quality; but when data are used to solve a concrete problem only, a small part of that “data lake” is really significant; this is what we call the “smart” data perspective. By using conceptual models and the principles of data quality management, adapted to the genomic domain, we propose a systematic approach called the SILE method to move from a Big Data to a Smart Data perspective. The aim of this approach is to populate an Information System with genomic data which are sufficiently accessible, informative and actionable to extract valuable knowledge.
Keywords: Conceptual Modeling, Data Quality, Big Data, Smart Data, Genomics.
1
Introduction
During the last two decades, advances in research technologies such as Next Generation Sequencing (NGS) have allowed us to read (sequence) DNA in a faster and cheaper way. Doing so was a challenge until the completion of the Human Genome Project in 2003 but, nowadays, is becoming a routine research tool. This has revolutionized our understanding of human biology and improved the study of how changes (variations) in the DNA are involved in the risk of suffering a certain disease [1].
*
Corresponding author
© 2018 Ana León Palacio et al. This is an open access article licensed under the Creative Commons Attribution License (http://creativecommons.org/licenses/by/4.0).
Reference: A. León Palacio and Ó. Pastor López, “Smart Data for Genomic Information Systems: the SILE Method,” Complex Systems Informatics and Modeling Quarterly, CSIMQ, no. 17, pp. 1–23, 2018. Available: https://doi.org/10.7250/csimq.2018-17.01
2 The vast majority of the information generated by biological research centers or biotechnological world-wide consortia is publicly available so that it can be used by the community: over one thousand repositories of open genomic data, which help biologists and clinicians to extract meaningful gene-disease associations, improving their ability to tackle complex diseases in a multidisciplinary and individualized way (precision medicine). However, genomic repositories have commonly been developed in an ad-hoc way, focused on addressing specific knowledge requirements, but not designed to share information among them.
Consequently, these repositories lack the holistic conceptual view required by a field as complex as Genomics, leading to inconsistencies, redundancies, dispersion concerning data about a specific topic, different representations of the same concept and thus a high variability in their quality. The identification of novel disease-causing genes is highly dependent on our ability to gather and join all the relevant puzzle pieces together, reducing the noise as much as possible, which has become a challenge for biologists.
On the one hand, there is a vast amount of data ready to be explored, but, on the other hand, only part of them is sufficiently valuable to be applied in clinical practice. Big Data essentially means all data, but data lakes by themselves are meaningless for biologists. In order to obtain true benefits, big genomic data needs to be turned into actionable small datasets, clearly focused on the purpose, insights and resulting outcomes that can be used in daily work: e.g. to understand the genomic nature of a particular disease. This is why there are also the “smart” data required to manage adequately the information in such a complex context as Genomics. The core of our work is to provide a systematic approach to handle the huge amount of open genomic data, in order to get a subset, of whatever size, which is valuable for biologists and also cross functional; this is what we mean by ‘from Big Data to Smart Data perspective’.
Conventional Big Data processing can be adapted to the genomic domain in order to solve most of the problems related to heterogeneity, data cleaning and data integration. But it leaves an important problem unsolved: the lack of an ontological commitment to define basic biological concepts; for instance, changes in the DNA sequence have been traditionally named as “mutations”, but this term has become increasingly problematic because usage by scientists is not uniform and has developed a negative connotation [2]. Substantial discrepancies in the meaning and use of key biological terms constitute an issue of concern, because they guide the understanding and processing of genomic data. If this issue remains open, the link between Big Data and Smart Data cannot be efficiently established.
On the other hand, data quality has not been given due attention even though analytics and outcomes are highly dependent on the quality of the data on which they are based. For instance, there are types of genomic databases which are different as regards to their level of curation1: from redundant and non-curated data warehouses that store millions of genomic sequences, such as TrEMBL2, to highly accurate databases manually annotated and reviewed by experts in a specific field, for instance Swiss-Prot3. In such a critical context, as Genomics applied to clinical practice is, this aspect becomes especially relevant. The use of data quality management principles helps to select the appropriate repositories and the most valuable data, in order to ensure the higher veracity of the results.
In this article, we present a systematic approach to extract small valuable datasets from the Big Data lake of Genomics, facing ontological and data quality challenges. The aim is to identify relevant variations in genes which are related to the risk of suffering a certain disease, and which will be used to populate a Genomic Information System (GeIS). Our proposal is based on two principles:
The use of conceptual models to provide sound and coherent structure to the integrated data. The use of data quality principles to ensure that data are relevant and reliable enough for the
task at hand.
1
Curation is the revision and annotation of biological data by experts in a specific field.
2
http://www.uniprot.org/statistics/TrEMBL
3 This article is structured as follows: in Section 2, we introduce the state of the art. Then, in Section 3 we present the “from Big Data to Smart Data” perspective applied to the genomic domain. In Section 4, we show how the Conceptual Schema of the Human Genome (CSHG) is useful to provide the ontological ground required to understand the key concepts of the domain. In Section 5, we explain the principles of Data Quality (DQ) which help to ensure the reliability required to apply the results to clinical practice. In Section 6, we present a practical example of how this approach can be applied: the SILE method, which acronym refers to the stages that make it up (Search, Identification, Load and Exploitation). Finally, we present the conclusions and suggested future work in Section 7.
2
State of the Art
Many of the underlying principles of Big Data have been explored by the research community for years in different domains. Nevertheless, theories and approaches for analyzing big genomic data are relatively recent [3], [4], [5]. NGS requires more and more sophisticated algorithms and high-performance parallel processing systems to analyze and extract knowledge from a huge amount of genomic and molecular data. In this context, emerging deep learning algorithms help biotechnology researchers to perform Big Data analysis [6]. But these technological requirements are expensive, time consuming and commonly out of reach of biologists and experts who use these data for clinical purposes. In this case, Big Data is useful to them only if they can do something with it in their everyday jobs. For many problems and questions, Smart Data itself is sufficient, as it creates and integrates small data "packages" and partitioning problems in a way that works across a wide range of people and organizations.
Due to the complexity of Genomics, in this article we focus on a particular use of genomic data applied to clinical practice: the identification of DNA variations in genes which are related to the risk of suffering a certain disease. In this case, a huge amount of open data repositories is available and the number of public biological data sources cannot be precisely determined on account of their volatility. Online catalogs such as the ones provided by the Nucleic Acid Research Journal (NAR) [7] or the Human Genome Variation Society4 (HGVS), are useful to get some idea of the multitude of repositories which are publicly available. Furthermore, some repositories are created for a specific purpose or in the context of a particular research and they are not updated or maintained so, as time goes by, they are no longer accessible or useful. In Figure 1, an example of the evolution of the number or public repositories during the last 4 years is presented. Each data source has advantages and disadvantages, which must be considered thoroughly according to the task to be performed. This means we do not have to query all available data sources, but only those that are relevant, thus reducing the volume of data to manage.
On the other hand, these data sources contain millions of records with different levels of quality due to the complexity of biological processes, the noisy nature of experimental data and the limitations of statistical analysis; besides, there is a bias due to the use of different sequencing technologies and sampling strategies. This is the reason why only part of this “data lake” is reliable enough to provide precise clinical diagnosis and treatments.
The study of data quality began in the 1990s, but it was not until 2011 that ISO published the ISO 8000 data quality standard. Nowadays, over 20 countries participate in its development, but it is considered to be controversial and standards need to be as mature and as perfect as possible. At the same time, research about data quality in Big Data, and particularly in genomics has just started and there are not any sound results yet. Despite these challenges, the need to improve quality of genomic data is a key, not only to achieve competitive advantage through its analysis, but because decision making, based on low genomic data quality, may involve serious mistakes with important consequences when applied for clinical purposes.
4
Figure 1. Number of biological databases added and removed from the NAR catalog in the last 4 years
Genomic databases differ not only in the scope of the information they represent, but also in the way the same information is modelled. This situation hinders the process of retrieval, annotation and integration of heterogeneous datasets. When the research community realized that this issue was becoming a serious problem, some solutions were proposed. To represent different biological domains, the first approach was to construct ontologies, with the aim of unifying knowledge and making it interoperable through consistent vocabularies. But these ontologies essentially became large terminological resources, used as a glossary of genomic terms that are, too often, heterogeneous, imprecise and even inconsistent when compared. Examples of such well-known types of ontologies include Gene Ontology (GO) [8], [9], which defines concepts/classes used to describe gene functions and relationships between them; Sequence Ontology (SO) [10], which defines a set of terms and relationships that describe the features and attributes of biological sequences; and Variation Ontology (VariO) [11], which defines the effects, mechanisms and sequences of genomic variations. Each of these ontologies describes a specific part of the genomic domain, but when we look for a common conceptual schema, in order to have a holistic view of all this knowledge, there is no clear solution.
Some databases such as dbSNP5 provide schemas for explaining the structure of the data they store, but they are usually very complicated to understand. Additionally, they are focused on satisfying the needs they were created for, at which time the option of interoperating with other repositories was not considered.
The idea of applying conceptual modeling to understand the genome has been explored by some authors. It was first introduced by Paton et al. in 2000 [12]. They proposed a set of data models to describe elements involved in transcriptional and translational processes, as well as the variant effects generated by them. Later on, Ram and Wei [13] also applied conceptual modeling principles in the context of 3D protein structure, and Bernasconi et al. proposed a conceptual model for describing metadata of experiments [14]. In any case, these approaches focus only on specific parts of the domain and do not provide the required global view.
In the next section we introduce the “from Big Data to Smart Data” perspective applied to the genomic domain and show how the CSHG and Data Quality Methodology are the keys to achieving it.
5
3
From Big Data to Smart Data Perspective
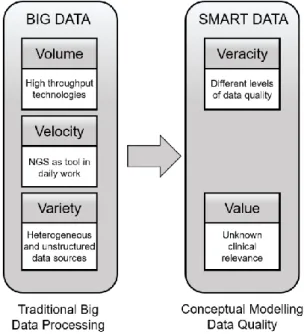
The term “Smart Data” contrasts with the term “Big Data”, which usually refers to a combination of structured and unstructured data that may be measured in petabytes or exabytes. Smart Data, in contrast, consists of usable datasets derived from Big Data repositories.
Volume, Velocity and Variety are the three Vs in the original definition of the key characteristics of Big Data according to the research report published by META Group [15]. Volume refers to the size of the data, Velocity refers to the speed of data generation and Variety refers to different types/sources of data. Since then, other factors have also been considered, such as Veracity (trustworthiness of the data obtained) and Value (usefulness of data) [16].
As a huge amount of research has been done in Big Data processing, usually focused on Volume, Velocity and Variety, we are going to focus on how we can reduce the noise and identify the most reliable data that are useful for clinical practice (Veracity and Value). We propose that the correct path to achieve this goal, is to add conceptual modeling techniques and data quality management to traditional Big Data Processing, as can be shown in Figure 2.
Figure 2. From Big Data to Smart Data perspective
Most databases gather information from different biological contexts such as Epigenomics, Proteomics or Pharmacogenomics. The researchers may link datasets to combine information from multiple sources, in order to increase the richness of the information available to answer a research task. But the lack of consensus when defining basic biological concepts can be a huge problem when integrating information from different repositories. The use of a Conceptual Model (CM), provides the ontological basis to unambiguously define each biological concept, needed to identify the data in the repository, whatever the term is used to represent it. This helps to provide structure to the heterogeneous data managed, as well as making easier the access to an integrated dataset that can be used in daily work. The conceptual model can be used as a solid ontology representation to address issues of semantic integration between different datasets.
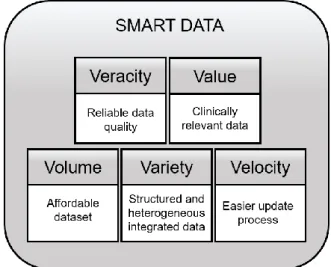
6 In conclusion, the systematic application of conceptual modeling and data quality criteria is a key to creating the link between the Big Data perspective and the Smart Data perspective. It provides Veracity and Value to the final dataset that will be used in clinical practice, as can be shown in Figure 3.
Figure 3. The 5 Vs of the Smart Data Perspective
In the next section, we will introduce the Conceptual Schema of the Human Genome (CSHG), an essential component to provide structure to this complex domain and the starting point for identifying valuable genomic information.
4
The Conceptual Schema of the Human Genome
To achieve what we refer to as the “Smart Data” perspective presented in this article, we need a conceptual structure in which to store each piece of genomic data in the right place, regardless of the data's origin. To accomplish this goal, we propose the use of the Conceptual Schema of the Human Genome (CSHG) [17], [18].
The CSHG has been developed in close collaboration with experts in the domain. It is thus based on biological knowledge and is independent of any specific data sources. This characteristic helps the experts in the domain to understand the structure of the information without the need of studying the internal schema of each repository. The CSHG has five main parts, each one related to a specific domain view [17]:
The Structural view, focused on describing the structure of the genome,
The Transcription view, focused on describing the components and concepts related to protein synthesis,
The Variation view, describing the changes in the sequence of reference, The Pathway view, describing information about metabolic pathways,
The Bibliography and data bank view, focused on describing where the data comes from. In order to accomplish our task (specified in Section 2), we need to mine those databases which contain the data specified by the conceptual model of relationships between genes and diseases. To accomplish this task, we must focus on the variations in the DNA sequence and their clinical significance (pathogenic or benign), as well as the evidence that supports this assertion.
7
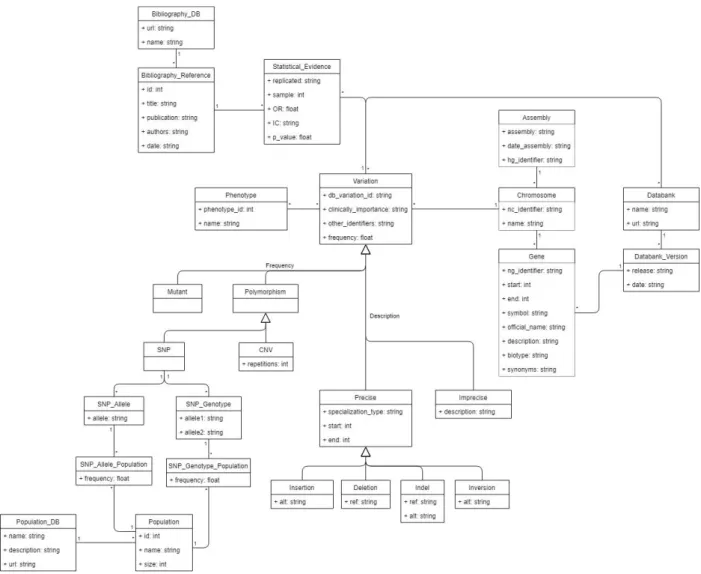
Figure 4. Representation of a DNA variation based on the CSHG
According to the schema, a variation is a change in the DNA sequence which occurs in a certain position inside a chromosome and, depending on its frequency and description, it can be classified into different types (Mutant, Polymorphism, Single Nucleotide Polymorphism, Copy Number Variation, Insertion, Deletion, Indel and Inversion).
The advantage of the CSHG over other options is that it covers the entire structure of the genome; so data stored in different genomic repositories can be easily connected by using this structure. The use of the CSHG allows researchers to identify the relevant information needed to answer a knowledge requirement and thus obtain a notion of which type of data sources can provide it.
The adaptability of conceptual models provides a flexible approach to extend them according to the evolution of the domain. As new discoveries are made, new concepts can be included in the schema, new relevant data sources can easily be considered and new attributes can be identified in order to improve the data analysis process.
In the next section we will introduce how data quality principles are used to identify relevant repositories and reliable data within them.
5
DQ Management Applied to Genomics
8 this definition mainly depends on the context of use. A data quality dimension can be assessed by using specific metrics in order to get a quantitative measure that represents the quality of the data being managed. But to apply this knowledge properly, a sound methodology needs to be defined.
A Data Quality Methodology can be defined as “a set of guidelines and techniques that,
starting from the input information concerning a given reality of interest, defines a rational process for using the information to measure and improve the quality of data of an organization through given phases and decision points” [20]. We propose to use a Data Quality Methodology specifically for the genomic domain in order to (i) ensure Veracity (selection of high quality repositories) and (ii) provide Value (selection of high quality data from each repository).
Using the CSHG as the conceptual core and the previously mentioned concepts of
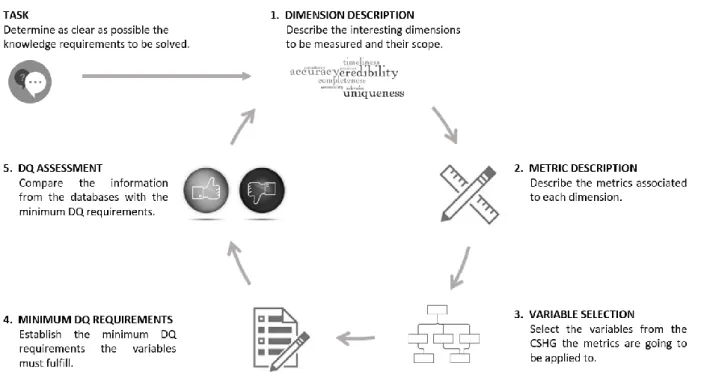
“dimension” and “metric”, the proposed Data Quality Methodology is divided into 5 phases: Dimension Description, Metric Description, Variable Selection, Minimum DQ Requirements and DQ Assessment (see Figure 5).
Figure 5. ProposedData Quality Methodology to ensure the veracity and value of the data
The methodology must be based on a detailed description of the knowledge requirements to be achieved. In the next subsections, each phase of the methodology is going to be thoroughly explained.
5.1 Phase I – Dimension Description
The DQ literature provides an extensive classification of data quality dimensions. However, there are discrepancies in the definition of most of them due to the contextual nature of quality. The most important classifications of quality dimensions are provided by Wand and Wang [21], Wang and Strong [19], Redman [22] and Naumann [23]. Nevertheless, no general agreement exists on which set of dimensions defines the quality of data, or on the exact meaning of each dimension. Thus, it is very important to compose a detailed description of the dimensions that best fit our data quality requirements.
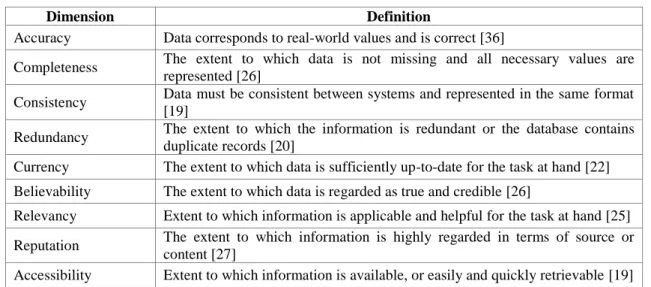
9 has been performed [24]. The study allowed us to classify them into nine major quality dimensions, which can be seen in Table 1.
Table 1. Name and description of the main quality dimensions determined
Dimension Definition
Accuracy Data corresponds to real-world values and is correct [36]
Completeness The extent to which data is not missing and all necessary values are represented [26]
Consistency Data must be consistent between systems and represented in the same format [19]
Redundancy The extent to which the information is redundant or the database contains duplicate records [20]
Currency The extent to which data is sufficiently up-to-date for the task at hand [22] Believability The extent to which data is regarded as true and credible [26]
Relevancy Extent to which information is applicable and helpful for the task at hand [25] Reputation The extent to which information is highly regarded in terms of source or
content [27]
Accessibility Extent to which information is available, or easily and quickly retrievable [19] The selection of relevant dimensions in a given scenario is mostly application-dependent. For instance, as Believability is a key dimension in determining the quality of a genomic database, when measuring the quality of a specific variation for genomic diagnosis in a Precision Medicine context, we focus on Accuracy and Completeness.
5.2Phase II – Metric Description
As mentioned before, a DQ metric is a quantitative indicator of an attribute or property that can be assessed so as to represent the quality of the data being measured. In general, multiple metrics can be associated with each data quality dimension. DQ metrics are mostly defined, ad hoc, to solve specific problems and thus, are dependent on the scenario being considered. Some authors such as [25] have defined methodologies that establish general principles in order to guide the definition of data quality metrics in a proper way.
The same dimension can be used to assess quality in more than one scenario, each being distinguished by the metrics defined in each case. As an example applied to our work, Believability can be measured by two different metrics depending on the context:
Believability of a database: a metric to measure this dimension could be that the database must be supported by well-known institutions and its content reviewed by experts.
Believability of a variation: a metric to measure this dimension could be that there must be at least one publication with credible statistics that supports the association between the variation and the studied disease.
For each dimension identified in the previous phase, at least one metric must be adequately defined in order to measure the global data quality.
5.3Phase III – Variable Selection
10 which is a unique identifier, provided by the bibliographic repository PubMed, to each publication it stores. If the variation has at least one PubMed id, then it passes the quality filter.
5.4Phase IV – Minimum DQ Requirements
The aim of this phase is to specifically determine the minimum levels of quality that the selected variables must fulfil according to the metrics specified in Phase II. Concrete acceptance criteria must be assigned to each metric, e.g. the number of different submitters providing information about a gene-disease association must be at least two.
One of the biggest concerns in any investigation is missing data (Incompleteness) because they can compromise the validity of the resource and any conclusions obtained by using that information. It is important to determine which variables are more or less likely to be missing, to define a priori an acceptable percentage of missing data, and to be aware of the effort that would have to be made to minimize the amount of missing information.
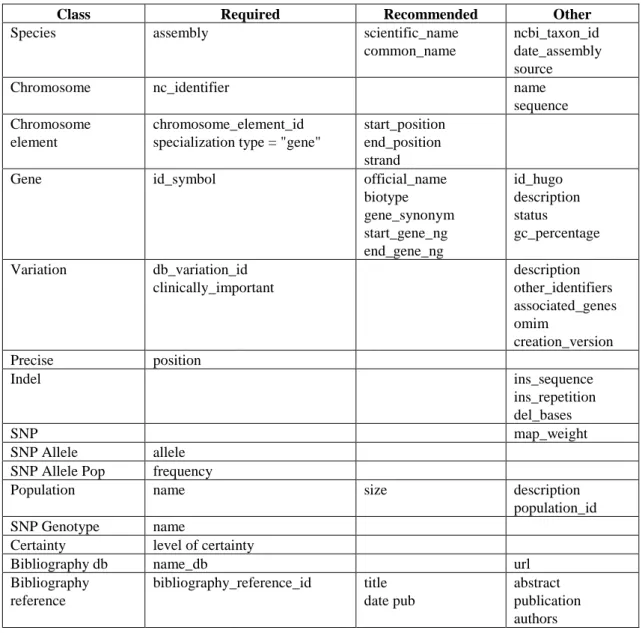
In Table 2, the attributes of the CSHG have been categorized as “Required” if the values must be present, “Recommended” if the values can be missing but would provide interesting information about the variation, and “Other” if the values can be missing.
Table 2. Classification of the attributes of the CSHG according to completeness requirements
Class Required Recommended Other
Species assembly scientific_name
common_name
ncbi_taxon_id date_assembly source
Chromosome nc_identifier name
sequence Chromosome
element
chromosome_element_id specialization type = "gene"
start_position end_position strand
Gene id_symbol official_name
biotype gene_synonym start_gene_ng end_gene_ng id_hugo description status gc_percentage Variation db_variation_id
clinically_important description other_identifiers associated_genes omim creation_version Precise position
Indel ins_sequence
ins_repetition del_bases
SNP map_weight
SNP Allele allele SNP Allele Pop frequency
Population name size description
population_id SNP Genotype name
Certainty level of certainty
Bibliography db name_db url
Bibliography reference
bibliography_reference_id title date pub
11 5.5Phase V – DQ Assessment
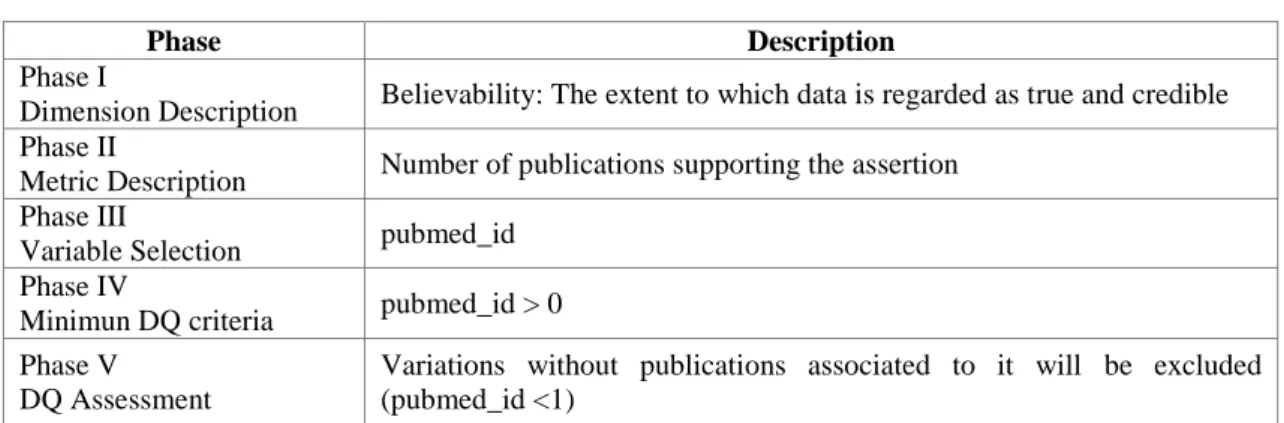
Once dimensions, metrics and minimum requirements are established a sound data quality assessment can be made over the databases and the information they store. The comparison of the collected information with the minimum acceptance criteria provide the required high-quality dataset which comes from the most adequate data sources and guides the decision making process. As an example, in Table 3 a summary of the steps followed to assess the Believability of a variation is shown. The example has been simplified, according to the steps previously explained, in order to ease understanding.
Table 3. Example of how to determine the believability of a variation
Phase Description
Phase I
Dimension Description Believability: The extent to which data is regarded as true and credible Phase II
Metric Description Number of publications supporting the assertion Phase III
Variable Selection pubmed_id Phase IV
Minimun DQ criteria pubmed_id > 0 Phase V
DQ Assessment
Variations without publications associated to it will be excluded (pubmed_id <1)
Finally, in the next section we are going to explain how the CSHG and the DQ Methodology proposed can be joined together in order to accomplish our proposed “from Big Data to Smart
Data perspective” for the genomic data management domain.
6
From Big Data to Smart Data: The SILE Method
In previous sections the needs of the CSHG and the description of a DQ Methodology to determine relevant information has been described. But, how can both proposals be combined in order to move from the Big Data perspective to the Smart Data perspective?
In this section we present our proposal to provide a systematic methodological approach in order to answer this question for the genomic domain. It is the so called Search-Identification-Load-Exploitation (SILE) method. Its main goal is to systematize the search and identification of genomic information to be loaded, analyzed and exploited by a Genomic Information System (GeIS) based on the Conceptual Schema of the Human Genome (CSHG). A summary of the activities taking place at each level of the method is defined in Table 4.
Table 4. Description of each level of the SILE method
Level Description
(S) Search
Determination of the information context, required to solve a concrete need, as well as the selection of data sources from which to extract information
(I) Identification Determination of a reliable and relevant dataset to be used to populate a database which structure is delimited by the CSHG
(L) Load Population of the database with the data identified in the previous level (E) Exploitation Extraction of knowledge from the database by using tools to analyse and
interpret genomic data
12 Alzheimer’s Disease (AD) is a type of dementia, so it mainly affects the capabilities and functionalities of the brain, decreasing them and hindering the patient’s normal life development. The Early-onset type starts to show symptoms before 65 years old (normally around 50) so it is essential to use truthful and contrasting information of high quality in the context of the clinical diagnosis. Due to AD being a degenerative neuronal disorder, stopping it in time is the key to increasing the quality of life of patients, which is only possible through specific studies of its genotype-phenotype relationship.
In the next subsections we present the main purpose and the steps that are performed at each level of SILE, with the aim of determining the genetic causes of EOAD.
6.1 Search
The task previously determined dictates the type of data required; and the researcher must best match the data to the question; i.e. variations in the DNA sequence of genes related to the risk of suffering the Early Onset Alzheimer’s Disease (clinical significance).
As has been explained previously, by using the CSHG, the most important attributes corresponding to each required piece of knowledge can be identified (the data context). This helps to select the most suitable and complete data sources to interrogate so as to obtain the required information.
In order to accomplish the proposed task, the types of genomic data sources required are: databases of sequences (genes and chromosomes), databases with information about genotype-phenotype relationships and databases that store scientific literature.
Once the context is established, data sources suitable to provide the required data must be selected from among all the publicly available repositories. At this point, the previously defined Data Quality Methodology is useful to determine those sources with the higher quality according to our DQ requirements.
First of all, a set of interesting DQ dimensions to be checked has been selected: Believability, Relevance, Reputation, Currency and Accessibility. By using the NAR Catalog, we performed a research of the databases which belong to the type of genomic data sources considered as relevant and, as a result, 43 repositories have been analyzed: 7 databases of sequences, 6 databases about the human genome, 27 databases about human genes and diseases, and 3 databases about scientific literature. Finally, 7 of these have been selected as the most reliable for extracting the required information. The metrics that are used to select the databases are listed below:
Believability Dimension:
- M1: The information stored in the database must be manually curated or reviewed by experts. This type of database has proved to be less error-prone than those which use algorithms to annotate the information [28].
- M2: There are quality controls to ensure the correctness of the submitted information (e.g. submission forms, automated control of HGVS expressions, etc.).
Relevancy Dimension:
- M3: The database contains enough information and is useful to determine the required data, according to the attributes determined by the CSHG.
Reputation Dimension:
- M4: The database must be maintained or supported by international or well-known national research centers, institutions or associations.
Currency Dimension:
- M5: The database must be active and frequently updated as well as provide enough information about it; e.g. the date of the last update and the database version.
Accessibility Dimension:
- M6: The information must be public and freely accessible.
13
- M8: It is highly recommended that the database provides ways to allow programmatic access to the information stored.
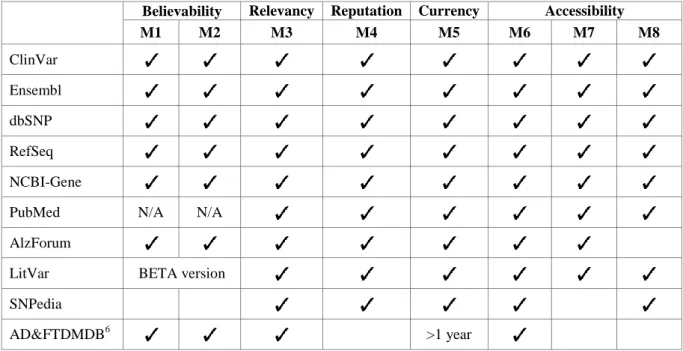
In Table 5, we have summarized the results of the analysis of the top 10 repositories in order to clarify how the selection of the final set of databases has been performed. The results have been sorted according to the number of filters passed.
Table 5. Data Quality Assessment of 10 biological data sources (N/A: Not Applicable)
Believability Relevancy Reputation Currency Accessibility M1 M2 M3 M4 M5 M6 M7 M8
ClinVar Ensembl dbSNP RefSeq NCBI-Gene
PubMed N/A N/A
AlzForum
LitVar BETA version SNPedia
AD&FTDMDB6 >1 year
We have selected the first 7 databases: 5 of these belong to the National Center for Biotechnology Information of the United States7 (NCBI). This center is part of a global consortium that shares information about advances in science and health, by providing access to biomedical and genomic information. Most of the databases supported by NCBI are publicly accessible. The information about the structural elements of the DNA sequences is retrieved from the NCBI Reference Sequence Database8 (RefSeq), an integrated and non-redundant set of reference sequences. These sequences belong to the reference genome (also known as reference assembly) which is a digital nucleic acid sequence database, assembled by scientists as a representative example of a species’ set of genes. Specific information about Genes is retrieved from NCBI Gene9, a repository of integrated information from a wide range of species. The information about bibliography is retrieved from PubMed10, a repository which stores more than 28 million citations for biomedical literature.
The information about variation-disease relationships comes from different resources, due to the fact that each database stores information about a certain type of variations or diseases. In our case we have selected two databases which belong to NCBI: (i) ClinVar11, a public archive of reports about the relationships among different types of human variations and phenotypes, with supporting evidence; (ii) dbSNP12, a public archive of short sequence variations, including single-base nucleotide substitutions, small-scale multi-base deletions or insertions, and microsatellite repeats. In addition, two more well-known databases are used to extract information: (i) Ensembl13, a repository which provides comparative information about different
6
Alzheimer Disease & Frontotemporal Dementia Mutation Database
7https://www.ncbi.nlm.nih.gov/ 8
https://www.ncbi.nlm.nih.gov/refseq/
9https://www.ncbi.nlm.nih.gov/gene/ 10
https://www.ncbi.nlm.nih.gov/pubmed/
11
https://www.ncbi.nlm.nih.gov/clinvar/
12
https://www.ncbi.nlm.nih.gov/projects/SNP/
14 species, and tools to support research in many different areas, including gene-disease associations, – this database is supported by the European Molecular Biology Laboratory's and European Bioinformatics Institute (EMBI-EBI); and (ii) AlzForum14, a platform to disseminate evolving knowledge around basic, translational, and clinical research in the field of Alzheimer’s Disease.
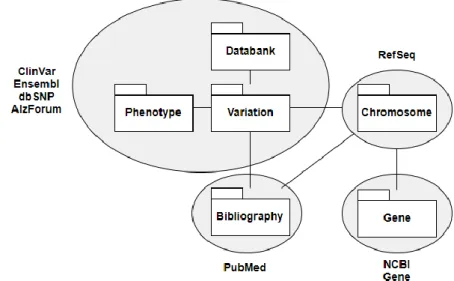
All the selected databases fulfill the established DQ requirements. As can be shown in Figure 6, each database provides information about a specific area of the CSHG. This helps to join together, under a holistic view, all the information required to get a better understanding of the disease.
Figure 6. Distribution of the selected databases according to the CSHG and their areas of knowledge
Some of the reasons why the other databases were excluded are: inactivity of the repository (e.g. AD&FTDMDB), lack of revision from experts (SNPedia) or not enough data about the evidence that supports the relationship between the variation and the disease. LitVar is a special case, due to the fact that it is a useful database supported by NCBI; but it is still under development and, currently, the available release is a BETA version. This affects the believability of the information provided.
6.2Identification
The identification level is a process consisting of two parts:
Identification of the most relevant and accurate data from the genomic repositories selected in the Search level.
Determination of correspondences between the attributes of the genomic repositories and the attributes in the Human Genome Database (HGDB). The HGDB is the core of the GeIS and is based on the structure provided by the CSHG.
The genomic repositories selected in the Search level store a multitude of variations associated with Alzheimer Disease, as well as a huge amount of metadata related with them. For instance, ClinVar stores 221 variations, Ensembl – 1,020 and AlzForum – 355. But not all of them are useful for clinical purposes. Their applicability depends on multiple variables such as the size and specificity of the population selected, within which the study is to be performed, the strength of the evidence which supports the association with the disease or the techniques used to draw the conclusions.
15 In order to select clinically relevant genes and variations, a new set of data quality dimensions has been defined: Accuracy, Completeness, Consistency, Believability and Relevancy. The metrics used to determine relevant variations are listed below.
Accuracy Dimension:
- M1: Review attributes liable to be error-prone. Syntactic errors must be checked using controlled vocabularies and specific data dictionaries.
Completeness Dimension:
- M2: The minimum information required to be stored in the HGDB is present. These attributes have been determined during Phase IV of the DQ Methodology.
Consistency Dimension:
- M3: The information about the variations is defined by using standard vocabularies and verified ontologies to determine critical attributes such as HGVS expressions, pathogenicity or functional effects.
- M4: There must be no conflicts in the clinical interpretation of each variation.
- M5: There must be no conflicts among databases related to the structural characteristics of the variation.
Believability Dimension:
- M6: Each variation must have significant medical or genealogical consequences and be reproducible (e.g. the reported consequence has been independently replicated by at least one group, besides the first group reporting the finding).
- M7: The relationship between the variation and the disease must have at least one link to a published, peer-reviewed paper with credible statistics and free access.
Relevancy Dimension:
- M8: The Minor Allele Frequency (MAF) of the variation must be less than the frequency of the phenotype in the population.
- M9: The inheritance pattern, penetrance and mechanism of the variant must be consistent with the disease.
- M10: The studies provided by the bibliography must have at least 500 participants and it is desirable that they are replicated.
- M11: For pathogenic variants the Odds Ratio must me greater than 1, and for protective variants the Odds Ratio must be less than 1.
- M12: For Genome Wide Association Studies (GWAS) the p-value must me less than 5x10⁻⁸.
Metrics M1, M2 and M3 help to identify errors that must be solved before the information is stored in the database and presented to the user. Metrics M4, M5, M8 and M9 help to identify conflict in the information provided from different repositories that could affect the Veracity of the information, for instance, there could be different interpretations of pathogenicity for the same variation. The rest of the metrics help to ensure that the information selected is sufficiently relevant for the task at hand.
16 relevance and variations accepted as relevant. This classification improves the traceability and replication of the results.
It is important to notice that most of the variations were discarded due to the lack of relevant statistical evidence. This is caused by the characteristics of the disease. EOAD is a rare type of Alzheimer so the studies are performed over small populations or delimited families. Because of that, the evidence currently available is not enough to be used in clinical practice and more research needs to be done.
17 The information associated with the final set of variations is summarized in Table 6.
Table 6. Relevant variants for Early Onset Alzheimer’s Disease ordered by number of associated publications. Ref. represents the original allele, Alt. represents the change which has occurred in the location of the chromosome specified by Chr (Position), and Num. Public. represents the number of publications associated with the variation.
Variation ID Chr (Position) Ref. Alt. Num. Public Gene
rs63751106 chr14 (73640351) T C 7 PSEN1
rs63751416 chr14 (73683878) C G 7 PSEN1
rs63750900 chr14 (73664775) G A 6 PSEN1
rs63751024 chr14 (73659501) T C 6 PSEN1
rs63749805 chr14 (73640285) C T 5 PSEN1
rs63750323 chr14 (73683837) G C 5 PSEN1
rs63751032 chr14 (73685864) T G 5 PSEN1
rs63749835 chr14 (73659507) T C 4 PSEN1
rs63750450 chr14 (73640279) A G 4 PSEN1
rs63750730 chr14 (73640282) C T 4 PSEN1
rs63749962 chr14 (73640278) T G 3 PSEN1
rs63750004 chr14 (73640363) T C 3 PSEN1
rs63750053 chr14 (73659429) G T 3 PSEN1
rs63750569 chr14 (73659419) G A 3 PSEN1
rs63750646 chr14 (73683855) G C 3 PSEN1
rs63751399 chr14 (73637755) T C 3 PSEN1
rs63750687 chr14 (73683845) C G 2 PSEN1
rs63750779 chr14 (73664769) C T 2 PSEN1
rs63750907 chr14 (73640375) C T 2 PSEN1
rs63751003 chr14 (73659443) C T 2 PSEN1
rs63751130 chr14 (73659506) C G 2 PSEN1
rs63750298 chr14 (73673096) A C 1 PSEN1
rs63750299 chr14 (73653598) T G 1 PSEN1
rs63750863 chr14 (73664820) C T 1 PSEN1
All of these variations affect processing or production of beta-amyloid, the protein fragment that is the main component of plaques in the brain. Plaques are abnormal clusters of protein fragments, build up between nerve cells. Beta-amyloid is a prime suspect in the decline and death of brain cells. Several drugs, currently under development, target beta-amyloid as a potential strategy to stop the disease or significantly slow its progression [29], [30]. This corroborates the importance and relevance of the selected variations.
Once the relevant variations are determined, the next step is to identify which data must be extracted from each repository, in order to be stored in the HGDB. The information must be sufficient to allow the unambiguous identification of variations in a patient’s sample, as well as provide enough data about their characteristics to support a genetic diagnosis. Each genomic repository provides different ways of accessing information as well as different data formats (VCF format, tabular text files, XML, etc.).
Another problem is that, due to the lack of standards in representing biological information, it is common to find different ways of representing the same concept. For instance, there are different ways to determine which nucleotides are affected by a variation:
dbSNP presents the nucleotides as two fields named “Ancestral Allele” and “RefSNP Alleles”. If the ancestral allele is an Adenine (A) and the RefSNP allele is a Guanine (G) this means that in a certain position of the DNA sequence, an A is changed by a G.
ClinVar uses the HGVS15 Nomenclature to represent variations where a change of an Adenine and a Guanine are represented by a string such as NG_027670.1:g.292683A>G.
18 Even when both examples represent the same correct information, data must be extracted using different approaches in order to ensure consistency.
Once the information from each database is identified, the next step is to map it to the structure of the HGDB. Additionally, the mechanisms to solve every possible inconsistency must be clearly defined in order to be implemented in the next level of SILE.
6.3Load
Using an Extract-Transform-Load (ETL) process, the relevant data related to the variations identified at the previous level are loaded into the HGDB. By using the Application Programming Interface (API) provided by the selected data sources to access their content, a specific wrapper for each repository has been developed to extract the required data.
At this level, the inconsistencies identified previously must be solved so as to be adequately stored in the database. This is the objective of the subsequent Transform process which ensures the Consistency of the system. The difficulty of the transformation process depends on the complexity of the field and its representation within each data source.
One of the common problems to be faced when integrating the information from the selected databases is the recognition, of duplicate entries. As can be seen in Figure 8, if we compare the original results of the databases that store information about genotype-phenotype relationships (variations), we can observe that 56 of them are common to all the repositories.
Figure 8. Common variations in three of the selected genotype-phenotype databases
Due to the lack of representation standards, the intersection of results necessitates verification if there are discrepancies in the information associated with each variation. For instance, it is common to find conflicts in the location of the variation in the genome. This happens because of the use of different reference sequences to locate the variations, which leads to discrepancies in the start and end positions. Ensembl uses the genome reference version GRCh38 (the latest one), ClinVar uses both versions and AlzForum uses the previous one (GRCh37). As a consequence, there is a requirement to select one of the reference sequences and translate all values to the new coordinates. Another common error is related to the gene affected by the variation. Sometimes the variation occurs in a sequence between two genes (intergenic) and the database shows the nearest gene to the variation. This leads to confusion because the variation is not located in that specific gene and it may be that its function is not affected. It is important to take this situation into account because knowledge evolves quickly and, in the intergenic region, a new gene can be found at any time. An example of this situation occurs when the variation is mapped according to old reference sequences.
19 is the key, when we try to identify the variations present in a patient’s sample, to identify precisely a specific variation leading to an important problem of missing information.
Due to the lack of consensus in the use of standard terminology, it is common to find inconsistencies in the nomenclature related to the type of variations. For instance, Ensembl considers 28 types of variations and ClinVar considers 31 types, based on the type of change (insertion, deletion, etc.). Nevertheless, AlzForum classifies the variations according to their molecular consequence as well as the nucleotides changed (e.g. “Point, missense and GAC to CAC” is type of variation D678H). This situation requires understanding of the ontology used by each data source, in order to create a mapping of the different terms that would guarantee the use of a unified terminology. A similar problem occurs with the name of the disease (phenotype) associated to the variation. There are different ontologies used to classify traits and diseases such as the Human Phenotype Ontology [31], Human Disease Ontology [32] and MedGen16. In this case the mapping of terms is not a trivial task due to the complexity of the disease types and subtypes.
All the problems previously mentioned hinder the process of finding duplicate entries and, in a general way, the entirety of the integration.
Once the errors have been corrected and the load has been finished, the HGDB will store a set of variations selected according to the DQ established and that are ready to be analyzed by specific tools, in order to extract the underlying knowledge.
6.4Exploitation
The aim of the Exploitation level is to extract knowledge from the information system. Nevertheless, this is not a trivial task. Several tools have been developed to support researchers in genetic data analysis. However, the lack of intuitive and interactive-usable mechanisms of such tools, transforms the analysis activity into a complex and time-consuming task. In order to provide a solution useful for clinical purposes, the data exploitation tools must enhance data discovery, enlarge visualization, allow the performance of data analysis operations and contextualize data by augmenting it [33]. One of the tasks that can be performed is related to the enhancement of Precision Medicine (PM). As it has been explained in the introduction, PM is an emerging approach for disease treatment and prevention that takes into account, for each person, individual variability in genes, environment, and lifestyle. This approach allows doctors and researchers to predict more accurately which treatment and prevention strategies for a particular disease will work in which groups of people. This is in contrast to a one-size-fits-all approach, in which disease treatment and prevention strategies are developed for the average person, with less consideration for the differences between individuals.
One of the pillars of PM is the genetic diagnosis which consists of the identification of potentially damaging variations in the DNA of a patient (see Figure 9).
Figure 9. Architecture of a Genomic Information System (GeIS) for genetic diagnosis
20 Following this approach, a tool called VarSearch [34] has been developed, in order to point out genetic variations present in a patient’s sample. The information about the variations presented in the sample are stored in Variant Call Format17 (VCF) files, a standard widely accepted by the biological community. The VCF files are processed by VarSearch in order to determine which variations within the file are also among those stored in the HGDB. As a result, a personalized report is generated, indicating the risk of suffering the disease.
In addition, VarSearch allows the researcher to go into detail about the characteristics of the variations found and the evidence that corroborates their relationship with the disease of interest. As all the information has been extracted from public repositories, it confirms NCF as being a valuable diagnosis tool for an advanced medicine in a precision working environment.
7
Conclusions and Future Work
The interest in moving from a Big Data to a Smart Data perspective comes from the need to extract relevant data that can be used in daily work. This is especially important in fields such as genomics applied to clinical practice, due to the increasing number of public resources that are becoming available, as well as their variable level of quality.
In this article, we have established the importance of using Conceptual Models and Data Quality Methodologies to define a roadmap in order to move from the Big Data perspective to the Smart Data perspective. The lack of an ontological commitment to define core biological terms is solved by using the CSHG. The variable level of quality, which affects the information available, is managed by the development of a Data Quality Methodology based on specific dimensions and metrics.
In order to make the huge amount of available information affordable, both solutions (CSHG and Data Quality Methodology) have been combined to develop a Genomic Information System (GeIS) with the aim of supporting the identification of clinically relevant variations in a patient’s sample. The consolidation has been made by defining SILE, a methodological approach whose main goal is to systematize the search and identification of genomic information to be loaded, analyzed and exploited by a GeIS.
As a proof of concept, SILE has been applied under the context of searching relevant genes and variations related to the risk of suffering Early Onset Alzheimer’s Disease (EOAD). Due to the neuronal degeneration and the early appearance of its symptomatology, specific studies about its genetic characteristics are the key to increasing the quality of life of patients. SILE acts as a valuable tool that experts can use to manage the data which are relevant and sufficiently reliable for this task. A summary of the SILE method and the DQ dimensions used can be seen in Figure 10.
The method has been successfully applied to identify the risk of suffering other diseases such as Neuroblastoma [35]. Currently, it is also being used to extend the underlying HGDB with information related to Crohn’s Disease, migraine, epilepsy and breast cancer. Moreover, a project in collaboration with clinical experts in lung cancer from the “Hospital de Clínicas” in Asuncion, Paraguay, is exhibiting promising development.
Genomics research is under constant evolution and data are generated quicker and quicker. The perspective of Big Data to Smart Data requires that our strategy must be able to adapt to any changes and new findings. The refinement of the tasks to be performed at each level of SILE, the evolution of the CSHG and the quality controls that are applied, conform to a cyclical process that must be continuously refined. This ensures the fulfillment of knowledge needs as long as the evolution of the domain continues.
21
Figure 10. The SILE Method
Acknowledgement
The authors would like to thank the members of the PROS Research Centre Genome group for the fruitful discussions regarding the application of CM in the medicine field. This work has been developed with the financial support of the Spanish State Research Agency and the Generalitat Valenciana under the projects TIN2016-80811-P and PROMETEO/2018/176, co-financed with ERDF. It was also supported by the Research and Development Aid Program (PAID-01-16) of the Universitat Politècnica de València under the FPI grant 2137.
References
[1] K. M. Boycott, M. R. Vanstone, D. E. Bulman, and A. E. MacKenzie, “Rare-disease Genetics in the Era of Next-Generation Sequencing: Discovery to Translation,” Nat. Rev. Genet., vol. 14, no. 10, pp. 681–691, Sep. 2013. Available: https://doi.org/10.1038/nrg3555
[2] C. M. Condit, P. J. Achter, I. Lauer, and E. Sefcovic, “The changing meanings of ‘mutation:’ A contextualized study of public discourse,” Hum. Mutat., vol. 19, no. 1, pp. 69–75, 2002. Available: https://doi.org/10.1002/humu.10023
[3] W. Raghupathi and V. Raghupathi, “Big data analytics in healthcare: promise and potential,” Heal. Inf. Sci. Syst., vol. 2, no. 1, p. 3, 2014. Available: https://doi.org/10.1186/2047-2501-2-3
[4] D. Howe et al., “Big data: The future of biocuration,” Nature, vol. 455, no. 7209. pp. 47–50, 2008. Available: https://doi.org/10.1038/455047a
[5] M. TB and D. AS, “The inevitable application of big data to health care,” J. Am. Med. Assoc., vol. 309, no. 13, pp. 1351–1352, 2013.
22 [7] M. Y. Galperin, X. M. Fernández-Suárez, and D. J. Rigden, “The 24th annual Nucleic Acids Research database
issue: A look back and upcoming changes,” Nucleic Acids Res., vol. 45, no. D1, pp. D1–D11, 2017. Available: https://doi.org/10.1093/nar/gkw1188
[8] M. Ashburner et al., “Gene Ontology: tool for the unification of biology,” Nat. Genet., vol. 25, no. 1, pp. 25– 29, May 2000. Available: https://doi.org/10.1038/75556
[9] The Gene Ontology Consortium, “Expansion of the Gene Ontology knowledgebase and resources,” Nucleic Acids Res., vol. 45, no. D1, pp. D331–D338, Jan. 2017. Available: https://doi.org/10.1093/nar/gkw1108 [10]K. Eilbeck et al., “The Sequence Ontology: a tool for the unification of genome annotations.,” Genome Biol.,
vol. 6, no. 5, p. R44, 2005. Available: https://doi.org/10.1186/gb-2005-6-5-r44
[11]M. Vihinen, “Variation Ontology for annotation of variation effects and mechanisms,” Genome Res., vol. 24, no. 2, pp. 356–364, Feb. 2014. Available: https://doi.org/10.1101/gr.157495.113
[12]N. W. Paton et al., “Conceptual modeling of genomic information,” Bioinformatics, vol. 16, no. 6, pp. 548– 557, 2000.
[13]S. Ram and W. Wei, “Modeling the Semantics of 3D Protein Structures,” in Conceptual Modeling – ER 2004. Lecture Notes in Computer Science, vol. 3288. Springer, pp. 696–708, 2004. Available: https://doi.org/10.1007/978-3-540-30464-7_52
[14]A. Bernasconi, S. Ceri, A. Campi, and M. Masseroli, “Conceptual modeling for genomics: Building an integrated repository of open data,” in Lecture Notes in Computer Science (including subseries Lecture Notes in Artificial Intelligence and Lecture Notes in Bioinformatics), vol. 10650, Springer, pp. 325–339, 2017. Available: https://doi.org/10.1007/978-3-319-69904-2_26
[15]D. Laney, “3D data management: Controlling data volume, velocity and variety.,” META Gr. Res. Note, vol. 6, no. February 2001, p. 70, 2001.
[16]A. Splendiani, M. Donato, and S. Drăghici, “Ontologies for bioinformatics,” in Springer Handbook of Bio-/Neuroinformatics, 2014, pp. 441–461. Available: https://doi.org/10.1007/978-3-642-30574-0_27.
[17]J. F. Reyes Román, Ó. Pastor, J. C. Casamayor, and F. Valverde, “Applying conceptual modeling to better understand the human genome,” in Lecture Notes in Computer Science (including subseries Lecture Notes in Artificial Intelligence and Lecture Notes in Bioinformatics), vol. 9974, pp. 404–412, 2016. Available: https://doi.org/10.1007/978-3-319-46397-1_31
[18]O. Pastor, J. C. Casamayor, M. Celma, L. Mota, M. Á. Pastor, and A. M. Levin, “Conceptual Modeling of Human Genome: Integration Challenges,” in Conceptual Modeling and Its Theoretical Foundations, vol. 7260, Springer, pp.231–250, 2012. Available: https://doi.org/10.1007/978-3-642-28279-9_17
[19]R. Y. Wang and D. M. Strong, “Beyond Accuracy: What Data Quality Means to Data Consumers,” J. Manag. Inf. Syst., vol. 12, no. 4, pp. 5–33, 1996. Available: https://doi.org/10.1080/07421222.1996.11518099
[20]C. Batini, C. Cappiello, C. Francalanci, and A. Maurino, “Methodologies for data quality assessment and improvement,” ACM Comput. Surv., vol. 41, no. 3, pp. 1–52, 2009. Available: https://doi.org/10.1145/1541880.1541883
[21]Y. Wand and R. Y. Wang, “Anchoring data quality dimensions in ontological foundations,” Commun. ACM, vol. 39, no. 11, pp. 86–95, 1996. Available: https://doi.org/10.1145/240455.240479
[22]T. C. Redman, Data Quality for the Information Age, 1st ed. Artech House, Inc., 1997.
[23]F. Naumann, Quality-Driven Query Answering for Integrated Information Systems, vol. 2261. 2002. Available: https://doi.org/10.1007/3-540-45921-9
[24]A. León, J. Reyes, V. Burriel, and F. Valverde, “Data Quality Problems When Integrating Genomic Information,” in Advances in Conceptual Modeling, Link, Seba., S. Link and J. C. Trujillo, Eds. Springer International Publishing, pp. 173–182, 2016. Available: https://doi.org/10.1007/978-3-319-47717-6_15 [25]L. L. Pipino, Y. W. Lee, R. Y. Wang, M. W. Lowell Yang Lee, and R. Y. Yang, “Data Quality Assessment,”
Commun. ACM, vol. 45, no. 4, pp. 211–218, 2002. Available: https://doi.org/10.1145/505248.506010
[26]F. Sidi, P. H. Shariat Panahy, L. S. Affendey, M. a Jabar, H. Ibrahim, and a Mustapha, “Data quality: A survey of data quality dimensions,” Inf. Retr. Knowl. Manag. (CAMP), 2012 Int. Conf., pp. 300–304, 2012. Available: https://doi.org/10.1109/InfRKM.2012.6204995
23 [28]H. Müller, F. Naumann, and J.-C. Freytag, “Data quality in genome databases,” in Proc. Conf. Inf. Qual. (IQ
03), 2003, pp. 269–284.
[29]C. Zhang et al., “Cromolyn Reduces Levels of the Alzheimer’s Disease-Associated Amyloid β-Protein by Promoting Microglial Phagocytosis,” Sci. Rep., vol. 8, no. 1, 2018. Available: https://doi.org/10.1038/s41598-018-19641-2
[30]S. Ramesh et al., “SIRT3 activator Honokiol attenuates β-Amyloid by modulating amyloidogenic pathway,”
PLoS One, vol. 13, no. 1, 2018. Available: https://doi.org/10.1371/journal.pone.0190350
[31]S. Köhler et al., “The Human Phenotype Ontology project: linking molecular biology and disease through phenotype data,” Nucleic Acids Res., vol. 42, no. D1, pp. D966–D974, Jan. 2014. Available: https://doi.org/10.1093/nar/gkt1026
[32]L. M. Schriml et al., “Disease Ontology: a backbone for disease semantic integration,” Nucleic Acids Res., vol. 40, no. D1, pp. D940–D946, Jan. 2012. Available: https://doi.org/10.1093/nar/gkr972
[33]C. E. Iñiguez-Jarrín, J. I. Panach, and Ó. Pastor López, “Defining Interaction Design Patterns to Extract Knowledge from Big Data,” in Advanced Information Systems Engineering, Lecture Notes in Computer Science, vol. 10816, Springer, pp. 490–504, 2018. Available: https://doi.org/10.1007/978-3-319-91563-0_30
[34]J. F. Reyes Román, D. Roldán Martínez, A. García Simón, U. Rueda, and Ó. Pastor, “VarSearch: Annotating Variations using an e-Genomics Framework,” in Proceedings of the 13th International Conference on Evaluation of Novel Approaches to Software Engineering, pp. 328–334, 2018. Available: https://doi.org/10.5220/0006781103280334
[35]V. Burriel, R. J. F. Reyes, A. H. Casanoves, C. Iniguez-Jarrin, and A. Leon, “GeIS based on Conceptual Models for the risk assessment of Neuroblastoma,” in Proceedings - International Conference on Research Challenges in Information Science, 2017, pp. 451–452. Available: https://doi.org/10.1109/RCIS.2017.7956581 [36]N. Askham et al., “The Six Primary Dimensions for Data Quality Assessment”, 2013.