C A S E S T U D Y
Open Access
Optimal configuration analysis for a
campus microgrid
—
a case study
Fahad Iqbal
*and Anwar Shahzad Siddiqui
Abstract
The foremost issues of 21stcentury are challenging demand of electrical energy and to control the emission of Green House Gases (GHG) emissions. Renewable energy resources based sustainable microgrid emerges as one of the best feasible solution for future energy demand while considering zero carbon emission, fossil fuel
independency, and enhanced reliability. In this paper, optimization and implementation of institutional based sustainable microgrid are discussed based on cost analysis, carbon emission, and availability of energy resources. Various microgrid topologies are considered for addressing the most ideal solution. The metrological data such as irradiance is acquired from solar satellite data of NASA (National Aero Space Agency) while the data for wind speed is taken from synergy enviro engineer’s site. HOMER®simulation tool is used for modelling and optimization purpose.
Keywords:Microgrids, Distributed generation, Renewable energy resources, Battery bank, Diesel generator, Solar photovoltaic system, Wind turbine system
1 Introduction
Worldwide, the demand of energy is increasing day by day, if the conventional methods of bulk power gener-ation are not changed then this will lead to major envir-onmental concern because of high carbon emissions which ultimately affect the human health and ecological system badly. To avoid hazardous effect of global warm-ing and due to environmental concerns, government and key stakeholders are now switching the way of power generation from conventional sources to sustainable and renewable energy resources [1].
People in developed countries, have access to reliable and high quality power supply but in developing countries like India, people from most of the states are facing vari-ous issues related to poor quality of power supply like fre-quent power outages, inadequate grid capacity and huge power losses from transmission and distribution network. These problems are very common almost in all rural areas of India [2]. All these issues can be sorted by transforming to microgrids which will not only provide more efficient and reliable power but also provide opportunity to the people of developing countries to live a better life, free from hazardous and polluting emissions.
Future power supply will be less dependent on conven-tional method of power generation because fossil fuels are limited for energy production and public awareness for environment protection are also increases globally. So, there is a need of power generation from environmental friendly techniques. These technologies include power gen-eration from photovoltaic, wind, geothermal, biomass etc. also known as renewable sources of power generation and power generation from non-conventional technologies such as microturbines and fuel cells. These types of power gener-ation sources generally come in distributed genergener-ation sys-tem and may operate in standalone and grid connected mode depending on the requirement of the system. For ex-ample, in remote areas and in faulty conditions these power sources mostly operate in standalone mode otherwise in grid connected mode [3]. Several desirable factors like easy siting, less environmental impact, enhanced system effi-ciency, security and reliability improvement, power quality enhancement and congestion management in transmission and distribution network due to peak shaving reduction can be achieved by employing these technologies [4]. Major concern associated with the use of renewable energy resources is their intermittent nature depending on weather conditions due to which the integration and operation of a microgrid becomes a challengeable task. This issue can be * Correspondence:[email protected]
Department of Electrical Engineering, Jamia Millia Islamia, New Delhi, India
sort out using microturbines, diesel generators, small gas turbines and with the help of high density energy storage devices [5]. However, the use of energy storage devices may not be economical and their use mainly depends on loca-tion and other system configuraloca-tions.
Microgrid can be defined as a part of distribution net-work including one or more distributed energy sources and having the capability to operate either in grid connected or standalone mode deployed in a limited geographical area [6]. There are various available favourable sites for the im-plementation of microgrids like remote areas, rural areas etc. where plenty of renewable energy resources are avail-able for clean and green power generation. In such loca-tions, microgrids can be operated in an islanding mode to achieve reliable and stable power supply by combining loads with the distributed energy resources available on the respected site. Based on market segments, microgrids can be categorized into five types: i) remote “off-grid” Micro-grids ii) Campus/Institutional microMicro-grids iii) Military base microgrids iv) Community/Utility microgrids and v) Commercial and Industrial microgrids [7]. Other way to categorize microgrid is based on the output voltage sup-plied to the load, and according to it microgrids can be classified into two types i) AC microgrid and ii) DC micro-grid. There are many factors which makes microgrids very important, some of them are as follows: During the condi-tions of blackout, natural disaster etc. microgrids can main-tain the normal power supply in the system, cost of Transmission and Distribution (T&D) losses will be saved with the help of microgrid, Demand of electricity is increas-ing day by day which ultimately require expenditure in T&D expansion, microgrids can defer these expenditures, microgrids generally uses renewable energy sources for power generation and these sources are environmental friendly having almost zero emission, quality and reliability of power supply is also enhanced with the help of microgrid in remote locations by means of renewable energy sources
and combined heat and power (CHP) generation, cost of energy can be greatly reduced and so on [8].
In this paper, various topologies of microgrid are analysed to find out the best possible configuration in terms of achieving various desirable objectives like better economical configuration as well as reduction in global warming, co2
footprints and other environmental problems.
The paper is structured into seven sections; first section gives the introduction of the research work, while section 2 discusses the objectives of the research work, and section 3 gives the detailed description of considered test system along with its load profile. Section 4 discusses the cost analysis for a typical microgrid while section 5 elaborates the system components, resources and modelling in detail. Section 6 gives the discussion on the results obtained through simulation considering six different cases and section 7 concludes the findings of the paper.
2 Objectives of this study
The objectives of this study for which the whole analysis is done are:
To reduce the dependency on fossil fuels and conventional method of power generation.
To make a zero-carbon nature through maximum utilization of renewable energy resources with the help of microgrid.
Table 1Approximate Daily Electric Load Consumption of Hostel
Load Rating (W) Usage (hrs/day) Quantity
Fana 80 14 180
Tube Light 40 7 405
Geysera 3000 4 12
Heatera 1000 4 70
Water Coolera 1700 24 13
Coolera 200 13 120
Halogen 1000, 500 10 4, 3
Laptop 70 6 300
Exhaust Fan 160 18 18
Phone charger 3 2 401
a
indicates seasonal load
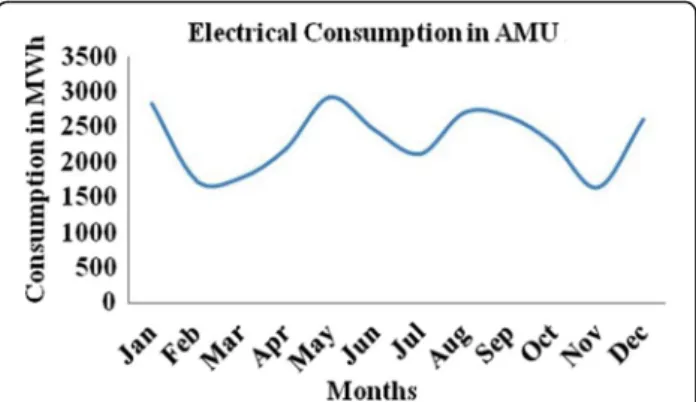
Fig. 1Electrical consumption in AMU for 2016
Help government of India and other major stake holder in realizing faster adoption of microgrids for ecological and environmental benefits.
To reduce the purchases of energy from the grid.
To provide a reliable, sustainable, economical, innovative, and optimize power system in the form of microgrid for commercial and residential purposes.
3 Case description
The demand of energy is rising from various sectors of society such as industries, resident as well as educational Institutes. On national as well as international scale, there are vast list of universities with growing number of depart-ments, canteens and hostels. They added up a mass amount of energy demand on utilities, which can be made independent over the conventional sources by deploying microgrid system using renewable and non-conventional sources of energy. The educational institutes have a
responsibility to become a role model for the nation to save energy and promote optimization. They should also de-velop and promote indigenous technology. They support many faculties and training facilities which can be a good platform to raise the awareness and promote energy saving [9]. For the case study Aligarh Muslim University (AMU) is taken, which is situated in western Uttar Pradesh, India. The study of electricity consumption trend in AMU pro-vides vital information that can be used to analyse, design and implement a suitable solution for the deployment of microgrid that can cut down the electricity usage from con-ventional grid and GHG emissions, thus save environment.
3.1 Electricity Consumption
AMU which is run by central government has a student strength of approx. 39000 [10].Total installed capacity is 13.63 MVA as shown in Table 1 [11], it has 12 faculties which includes more than 110 departments and centers. Their consumption is approx. 65% while 16 halls of resi-dence consume 25% of total consumption [12], annual electricity consumption for 2016 is shown in Fig. 1.
Uttar Pradesh Power Corporation Limited (UPPCL) sanctioned a load of 6.1 MVA to the campus of this university. But due to increase in load demand, univer-sity consumption overshoot the limit of 7.952 MVA in Nov 2014 followed by 7.880 MVA in August 2015 [11].
3.2 Load Profile
Several initiatives have taken by vice chancellor for green and clean campus. In this regard microgrids are investi-gated for residential halls. Nadeem Tarin hostel is one of them which is taken for case study, it includes 146
Fig. 4A typical microgrid structure
rooms as non-sensitive load while dining hall, reading room, Common room and provost office can be consid-ered under the category of sensitive load.
The details of different types of load commonly used in this hostel are listed in Table 1.
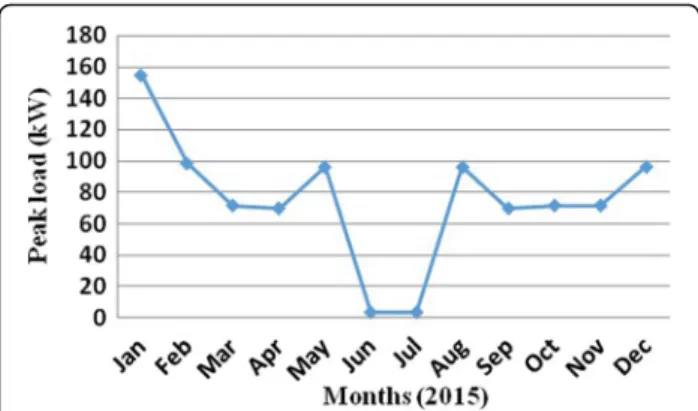
The daily average hostel load is 992.43kWh with a ran-dom variation of 10% while the peak load is 171.78 kW with a random variation of approx. 8%. Average load profile is shown in Fig. 2 and monthly peak load vari-ation is shown in Fig. 3. There is a huge varivari-ation in load profile because a minimum load of approx. 0.54 kW is recorded during the vacation period whereas in peak winter and summer days, load rapidly increases up to 171.78 kW.
4 Cost analysis for a typical microgrid
This section provides the mathematical cost function formulation for a microgrid. The evaluation of microgrid operation can be carried through its cost and emis-sion analysis. Since, a typical microgrid consists of mainly two types of generators viz. dispatchable and non-dispatchable generators, an electric power flow on a typical microgrid can be represented as shown in Fig. 4.
It is to be noted that fixed cost for various Distributed Energy Resources (DERs) incurred due to primary equipment cost and installation does not depend upon power dispatch and can be treated as a constant. Also for DERs which requires a converter for AC/DC conver-sion the cost of converters is included in the fixed costs. The main aim of the cost function formulation is to con-sider the cost of dispatchable units, such as diesel gener-ator, cost of non dispatchable units, e.g. PV, wind, battery storage and cost of power purchased or sold to grid. The operational cost of the microgrid is the sum of all cost incurred in the system [13]. Also, hourly emis-sion from each DER unit is considered to optimize the carbon footprints and levels of pollution from the oper-ating microgrid.
4.1 Cost of diesel generator
Considering the operation time slot for the diesel generator to be ‘t’ (in hours), cost of fuel to be Cf (in
INR), Cmd as the maintenance cost of the diesel
genset, then the total cost of operation for generator (denoted by Cdg) is
Cdg¼Pdg=EffCftþCmdPdgþFdg ð1Þ
Where, Pdg is the power generated by diesel generator
in kW, Effis the efficiency of diesel genset and Fdgis the
fixed cost of diesel generator comprising of equipment and installation cost.
4.2 Cost of PV generator
The PV generator does not incur any running cost/fuel cost since the solar radiation is present throughout the day with-out any expenditure. However, a maintenance cost for the PV panel, depending upon its power production as well as the fixed cost is considered as the operational cost for the PV generator (denoted byCpv).
Cpv¼PpvCmpvþFpv ð2Þ
Where, Ppvis the power generated by the PV generator
in kW, Cmpvis the maintenance cost of PV panel and Fpv
is the fixed cost.
Table 2List of some important parameters
Component Specification
PV Material Polycrystalline Silicon
Size 1480*670*35 mm
Max Power 150watt
Max Power Current 8.29A
Max Power Voltage 18.1 V
Derating Factor 80%
Wind Turbine (WT) Turbine type Upwind
Rotor diameter 21.5 m
Hub heights available 37 m, 31 m, 25 m, 21 m
Rated power 100 kW
Rated rotor speed 60 rpm
Rated output voltage 400 VAC, 50 Hz
Working wind speed 3–25 m/s
Diesel Generator Power Capacity (kW/kVA) 100/125
Rated Voltage 415/240
Rated Speed 1500 rpm
Battery Type 1kWh Lead Acid
Nominal Voltage 12.0 V
Maximum Capacity 83.4 Ah
Round Trip Efficiency 80%
Float Life 10 years
Maximum charge Rate 1 A/Ah
Maximum charge Current 16.7 A
Maximum Discharge Current
24.3 A
Initial State of Charge 98%
Minimum state of Charge 30%
Converter Range 100kWp
Voltage range 310 V-450 V
THD <0.8%
Max Efficiency 97.2%
4.3 Cost of Wind generator
The wind generator operational cost consists mainly of fixed installation cost, equipment cost and the cost of maintenance incurred for power produced from the wind generator (denoted by Cw).
Cw¼PwCmwþNw ð3Þ
Where Pwis the power generated by the PV generator
in kW, Cmwis the maintenance cost for the wind
gener-ator and Nwis combined equipment and installation cost.
4.4 Cost of Battery Storage
The battery storage (BS) is an important part of the micro-grid since it stores surplus energy and supplies deficit energy and maintains stability in microgrid operation. The cost of battery storage can be represented as (denoted by Cbs).
Cbs¼PbsCmbsþCb ð4Þ
Where Pbs is the power charged into the battery
sys-tem and Cmbs is the maintenance cost for the battery
and Cbis the cost of the battery. It is to be noted when
the BS supplies deficit energy to the microgrid then Pbs
is negative denoting revenue for the battery owner.
4.5 Cost of grid supply
A grid is assumed to be an infinite bus which can supply or consume any amount of power. While the microgrid is in grid connected mode, the power supplied from the grid to the microgrid is charged as,
Cgrid¼Pgridα ð5Þ
Where αis cost of electric unit supplied from the grid in INR/kWh.
Also, the cost of power sold to the grid is
Cmgrid ¼Pgridβ ð6Þ
In case when the excess energy is sold to the grid, the factor β is the selling rate of power in INR/kWh and
Pgrid is negative in order to balance the cost equation
and generate revenue for the microgrid. In a typical microgrid scenario, β>α, however the tariff structure varies from location to location.
5 System Components, Resources and Modeling U.S. National Renewable Energy Laboratory (NREL) developed HOMER® optimization tool for better de-signing and planning of microgrids which are mainly fuelled by renewable energy resources. After consider-ing various design topologies and uncertain parame-ters like future fuel prices, wind speed, load growth etc., HOMER® finds out the best optimal results. HOMER® supports the integration of renewable en-ergy resources with the utility grid and works effect-ively in the stand alone as well as grid connected mode of operation of microgrids [14]. Using HOMER® optimization tool, one can check and analyse large number of optimal combinations of various types of i) power sources: wind turbine, solar photovoltaic (PV), microturbine, fuel cell, biomass, utility grid, diesel generator etc. ii) energy storage technologies: battery bank, flow batteries, hydrogen, fly wheels etc. and iii) loads: daily profile with seasonal variation, deferrable, thermal etc.
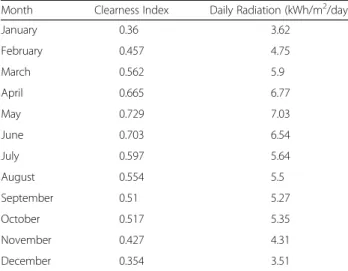
Fig. 5Variation in monthly average solar global horizontal irradiance data Table 3Monthly average solar global horizontal irradiance data
Month Clearness Index Daily Radiation (kWh/m2/day)
January 0.36 3.62
February 0.457 4.75
March 0.562 5.9
April 0.665 6.77
May 0.729 7.03
June 0.703 6.54
July 0.597 5.64
August 0.554 5.5
September 0.51 5.27
October 0.517 5.35
November 0.427 4.31
In HOMER® optimization tool, the total Net Present Cost (NPC) is taken as an economically preferable quan-tity that is used in an optimization process. This NPC includes all the system costs like grid cost, operation cost, replacement cost, maintenance cost, capital cost, fuel consumption cost and other types of miscellaneous cost. Based on the inputs provided by modeler like re-source availability, technological options, equipment costs etc., HOMER® simulates different system configu-rations and as per NPC it displays all the possible techno-economic feasible configurations. The simulation results of HOMER® comes in the form of tables and graphs which ultimately helps modeler in comparing too many feasible configurations simultaneously and ranking them as per techno-economic basis.
Simulation, Optimization and Sensitivity Analysis are the three most important tasks performed by HOMER®. These three parameters evaluate techno-economic feasibility of various available technological options after accounting all possible variations in electric load, energy resource availability, technology cost, etc. i) Simulation: For an entire year and in time steps from 1 min to 1 h, HOMER® simulates the op-eration of a hybrid microgrid. In this area, HOMER®
determines the technical feasibility and lifecycle cost of a hybrid microgrid. The optimization and sensitiv-ity analysis tasks of HOMER® mainly depends on the capability of simulation task. ii) Optimization: In a single run, HOMER® inspects all the possibilities and as per optimization variable of choice, it sorts the system accordingly. In this area, based on search space defined by modeler, minimum total net present cost, constraints, etc., HOMER® displays all the feas-ible results and system configurations. iii) Sensitivity Analysis: In a single run HOMER® compares and checks thousands of possibilities. In this area, HOMER® checks the importance of all parameters variations and aspects with time by running and comparing the results of thousands of simulations. HOMER® finds out the optimal results based on dif-ferent sizes and quantities of the equipment’s along with constraints as defined by user. If the modeler is not confirmed about the best value of any particular variable, then with the help of sensitivity analysis modeler can enter different possible values of that variable and sensitivity analysis shows how the simu-lation results depends on these values.
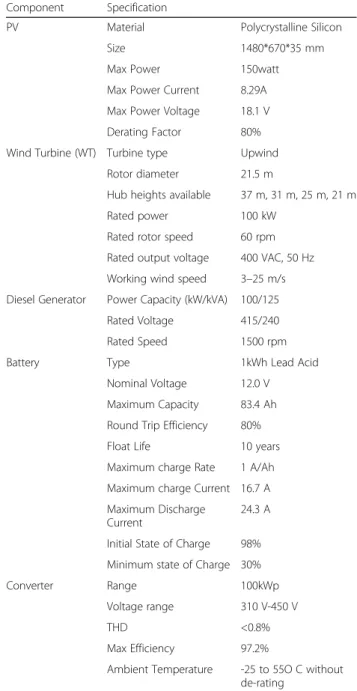
System components like solar photovoltaic panels, wind turbines, diesel generator, converter and battery bank are taken for the modelling of different types of topologies considered in this paper. Important parame-ters related to these components are listed in Table 2.
In this paper, energy demand of the hostel is ad-dresses with the help of different topologies. The daily average load of 992.43 kWh/d with peak load of 171.78 kW is considered for modelling in HOMER®. The details of different system components used in this paper are as follows.
5.1 Solar photovoltaic system
PV panel size, solar radiation and PV cell temperature are some factors which can affect the generation of electrical power supply from solar energy. Lifetime of 25 years are assumed for PV panel and the size of PV
Fig. 6Variation in monthly average wind speed data Table 4Monthly average wind speed data
Month Average (m/s)
January 2.884
February 3.09
March 3.76
April 3.863
May 4.996
June 5.047
July 4.275
August 3.296
September 3.966
October 2.987
November 2.266
panel is varied from 140, 145, 150, 155, 160 kW to evaluate better results.
The equation for calculating the output power of PV panels used in HOMER®is as follows [15]:
PPV ¼fPVYPV
IT
IS ð
7Þ
Where,
fPV: Derating factor of PV
YPV: PV array rated capacity (kW)
IT: Global solar radiation incident on the surface of PV
array (kW/m2)
IS: Standard amount of radiation used to rate the
capacity of PV array (1 kW/m2)
Latitude and Longitude coordinates of Aligarh are 27.8800° N and 78.0800° E respectively. Annual Aver-age Solar Global Horizontal Irradiance Data for the proposed site is 5.35 kWh/m2/day. With reference to the above mentioned coordinates the solar radiation data taken from [16] for HOMER® is as shown in Table 3 and Fig. 5.
5.2 Wind Turbine System
Wind speed and tower height are the main factors which can affect the electrical power supply from wind energy. Lifetime of 20 years are assumed for wind turbine and the size is varied from 90, 95, 100, 105, 110 kW to evalu-ate better results.
The equation for calculating the output power of wind turbine is as follow [17]:
Pwtð Þ ¼t
0;v tð Þ<vci av tð Þ3 −bPr;vci<v tð Þ<vr
Pr;vr<v tð Þ<vco
0;v tð Þ>vco
8 > > < > > :
ð8Þ
Where,
Pr: Mean rated power
vci: Cut-in wind speed
vco: Cut-out wind speed
vr: Rated wind speed
Annual average wind speed at the proposed site is 4.50 m/s. The data showing the variation in wind speed is as shown in Table 4 and Fig. 6 [18].
Figure 7 represents the variation in wind turbine power production at different wind speeds.
5.3 Diesel Generator System
Since, renewable energy resources are intermittent in na-ture, so there are chances of complete and partial out-ages of these resources due to which diesel generator is required as a backup source for meeting the electrical demand of primary load.
Minimum load ratio and lifetime hours of diesel gen-erator are taken as 25% of 15000 respectively for modelling.
Equation for calculating the generator’s fixed cost of energy used in HOMER®is as follow [15]:
Fig. 8HOMER®simulation model for case VI
Cgen;fixed¼Com;genþ Crep;gen
Rgen þ
FoYgenCfuel;eff ð9Þ
Where,
Com,gen: Operation and maintenance cost (INR/hour)
Crep,gen: Replacement cost (INR)
Rgen: Generator lifetime (hours)
Fo: Fuel curve intercept coefficient (fuel/hour/kW)
Ygen: Generator capacity (kW)
Cfuel,eff: Effective price of fuel (INR/quality of fuel). It
includes the cost penalties associated with the emission of pollutants from the generator.
5.4 Battery Bank System
Battery bank size, battery charge and discharge rate are the main influencing factors associated with the power output of the battery bank system. Batteries are essential in hybrid power system to store surplus electrical energy generated through renewable energy resources during low demand periods and to release deficit energy during shortage and high demand periods respectively. Lifetime throughput of
800 kWh are assumed for battery bank and the size is var-ied from 240, 245, 250, 255 kWh to evaluate better results.
Equation for calculating the state of charge (SOC) is as follow [15]:
SOC tð Þ ¼ð1−QÞSOC tð−1Þ þPcdΔð Þt ecd=E ð10Þ
Equation for calculating the life of battery bank (in years) is as follow [13]:
Rbatt ¼ min
NbattQlifetime Qthrpt
;Rbatt;f
!
ð11Þ
Equation for calculating the wear cost of battery is as follow [15]:
Cbw¼
Crep;batt NbattQlifetimepffiffiffiffiffiffiηrt
ð12Þ
Where,
SOC(t) andSOC(t−1): State of charge at time (t) and (t-1) Q: hourly discharging rate
E: Total energy
Fig. 10Monthly average electricity production (Case VI)
ecd: Efficiency of charge and discharge
Nbatt: Number of batteries in a battery bank
Qlifetime: Lifetime throughput of a single battery
Qthrpt: Total amount of energy that cycles through the
battery bank in 1 year (annual throughput)
Rbatt,f: Maximum life regardless of throughput (float life
of the battery)
Crep,batt: Replacement cost of the battery bank
ηrt: Round-trip efficiency
6 Discussion and Evaluation
HOMER®microgrid analysis tool is used for the simula-tion of various microgrid topologies to find out the opti-mal and economical solution among various microgrid topologies considered in this paper. HOMER® simulates various system configurations according to specified technical constraints and gives result based on Net Present Cost (NPC) of the system. HOMER® calculates NPC using equation:
CNPC ¼
Cann;tot
CRF i;RProj
ð13Þ
Where,
Cann,tot: Total annualised cost
i: discount rate
Rproj: Project Lifetime
CRF(i,Rproj): Capital Recovery Factor
In university premises, electric power supply is avail-able almost all the time and the problem of power out-age only occurs in case of severe fault conditions which happens very rarely. The average feed in tariff or grid sell back price of 7 INR/unit is assumed for analysis gener-ated through solar PV and wind turbine system [19, 20].
Analysis of various microgrid topologies based on the considered load profile are as follow:
6.1 Case I: Diesel Generator (168 kW)
In this case, it is assumed that there is no power supply form conventional grid as well as from renewable energy resources. Diesel generator is only the single power source for meeting the whole load demand. This is the worst case in terms of cost of electricity (COE), Net Present Cost (NPC), Operating Cost (OC) and CO2 emissions having
high values of INR 35.48 INR 166 M, INR 12.5 M and 544705 kg/year. respectively. So, supplying power to meet demand only from diesel generator is not a desirable case in terms of economical and environmental aspect.
6.2 Case II: Utility Grid
In this case, it is assumed that all the load demand is supplied by utility Grid. Here, it is assumed that there is
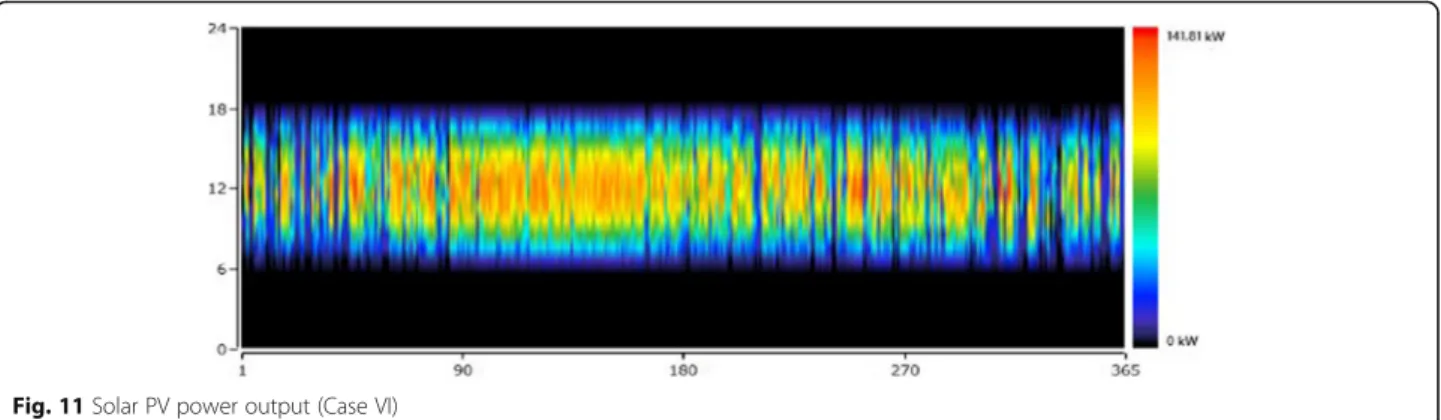
Fig. 11Solar PV power output (Case VI)
no single outage and Grid is available to supply power all over the time. The COE, NPC, OC and CO2
emis-sions obtained in this case are INR 6.0, INR 28.1 M, INR 2.17 M and 228933 kg/year. respectively.
6.3 Case III: Diesel Generator (110 kW), PV (150 kW), wind turbine (100 kW) and Battery bank (250 kWh)
In this case, it is assumed that there is no Grid supply and load demand is fulfilled by the combination of diesel generator and renewable energy sources i.e. through solar PV and wind turbine system. The COE, NPC, OC and CO2emissions obtained in this case are INR 18.65,
INR 87.3 M, 5.36 M and 231948 kg/year. respectively.
6.4 Case IV: Grid and Wind Turbine (100 kW)
In this case, only Grid and wind turbine system are re-sponsible for meeting load demand. The COE, NPC, OC and CO2 emissions obtained in this case are INR 4.64,
INR 25.7 M, 1.52 M and 146436 kg/year respectively.
6.5 Case V: Grid, PV (150 kW) and Battery bank (250 kWh) In this case, only Grid and solar PV system are responsible for meeting load demand. The COE, NPC, OC and CO2
emissions obtained in this case are INR 2.95, INR 18.6 M, 0.896998 M and 106497 kg/year. respectively. If a battery bank of 250 kWh is added in this case to store excess elec-tricity and for supplying power to load in emergency con-ditions then the value of COE, NPC, OC and CO2 emissions will change and increases to INR 3.83, INR 23.2 M, INR 1.11 M and 118289 kg/year. respectively.
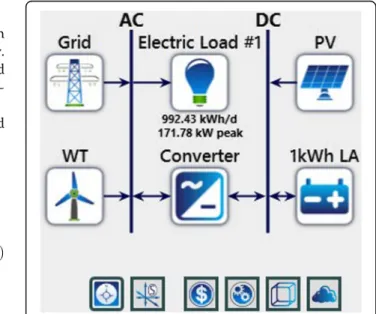
6.6 Case VI: Grid, PV (150 kW), Wind Turbine (100 kW) and Battery bank (250 kWh)
Figure 8 shows a schematic diagram of various compo-nents connected in a HOMER® simulation analysis tool. In this case the combination of Grid, Solar PV and wind turbine system is considered for supplying power to the ex-pected load. The COE, NPC, OC and CO2 emissions ob-tained in this case are INR 2.41, INR 17.3 M, 0.353125 M and 35792 kg/year. respectively. If a battery bank of 250 kWh is added in this case then the values of COE, NPC, OC and CO2 emissions will change to INR 2.85, INR 20.5 M, INR 0.441733 M and 35792 kg/year. respectively.
Figure 9 shows a comparative study by considering the impact of i) emissions like carbon dioxide, carbon mono-oxide, unburned hydrocarbons, particulate mat-ters, sulphur dioxide and nitrogen oxides, ii) energy sold to grid and iii) excess electricity generated in all the six different cases.
From the analysis of various cases as discussed above, it is clear that a combination of grid, solar PV and wind turbine system seems to be the most desirable one in term of economical as well as environmental aspect, because all the values obtained here are the most favourable as compared to other cases.
Figure 10 shows a monthly average electricity produc-tion profile. Load demand is low in the months of June and July because these months come under the period of summer vacations and due to low load demand in these months only the generation from PV and wind tur-bine system is enough for meeting the load demand.
Fig. 13Energy purchased from the grid (Case VI)
Figures 11 and 12 shows a power output from PV and wind turbine system respectively. Figures 13 and 14 shows an energy purchased and sold from and to the Grid respectively.
7 Conclusion
Demand of electricity is increasing day by day and fossil fuels are limited for power generation, so there is a need to adopt non-conventional and environmen-tal friendly methods of power generation to meet the country’s requirements. In view of this Government of India also initiated several subsidy schemes and missions like Jawaharlal Nehru National Solar Mission etc. for setting up power generation project using re-newable energy resources. Deployment of microgrids is one of the best available technology for achieving this goal. Educational institutes have a responsibility to become a role model for the nation to save energy and promote optimization. These institutes support many students, research scholars, faculties and train-ing facilities which can be a good platform to raise the awareness and promote energy saving. In view of this, different microgrid topologies are considered and analyzed in this paper. For different locations and system constraints, these microgrid topologies may differ. Many software’s are available to analyze technical and economical feasibilities. HOMER optimization tool is used in this paper to check all the possible combinations and configurations. Based on large number of simulation results obtained from HOMER, a combination of grid, solar PV and wind turbine system is found to be the most optimal case for the specified load. In this case, the value of COE, NPC, OC and CO2 are found to be less with
respect to the other considered topologies.
Acknowledgements
Not applicable.
Funding
Not applicable.
Availability of data and materials
All data is given in the paper or properly cited wherever necessary.
Authors’contributions
FI carried out all the simulation work along with drafting of the manuscript under the guidance of ASS. Both authors read and approved the final manuscript.
Authors’information
1Fahad Iqbal is currently pursuing Ph.D from Department of Electrical
Engineering, Jamia Millia Islamia (Central University), New Delhi-110025, India. He received M.Tech degree with Honors in Electrical Power System Manage-ment from DepartManage-ment of Electrical Engineering, Jamia Millia Islamia New Delhi, India. He was awarded Gold Medal for his outstanding performance in Master’s Degree. He received B.Tech. degree with Honors in Electrical and Electronics engineering from Integral University, Lucknow, India. He was awarded Silver Medal for his outstanding performance in Bachelor’s degree. His areas of interest are Microgrids, DG’s, DER’s, Renewable Energy Resources, FACTS devices, Power system Management and Power System Deregulation.
2Anwar Shahzad Siddiqui obtained his B.Sc. Engg. (Electrical Engineering)
and M.Sc. Engg. (Power Systems and Electrical Drives) degrees from AMU, Aligarh, both with Honors in 1992 and 1994 respectively. He earned his Ph.D. degree from Jamia Millia Islamia (Central University) New Delhi, India in 2001. He has been teaching and guiding research in Electrical Engineering for about one and a half decade at AMU, Aligarh; JMI, New Delhi and BITS Pilani—Dubai Campus. His research interests include Power System Management and Applications of Artificial Intelligence Techniques in power System. He has more than 80 research papers published in refereed international and national journals and conference of repute.
Competing interests
The authors declare that they have no competing interests.
Consent for publication
Not applicable.
Ethics approval and consent to participate
Not applicable.
Received: 28 April 2017 Accepted: 6 June 2017
References
1. Iqbal, F., Khan, M.T., & Siddiqui, A.S. (2017). Optimal placement of DG and DSTATCOM for loss reduction and voltage profile improvement.Alexandria
Engineering Journal. http://www.sciencedirect.com/science/article/pii/
S1110016817300923 . Accessed 20 June 2017.
2. Dey, A. N., & Basak, P. (2015). A report on relevance of microgrid for developing countries with specific reference to India.International Journal of Advanced Research in Electrical, Electronics and Instrumentation Engineering,
4(6), 5484–5489.
3. Nehrir, M. H., Wang, C., Strunz, K., Aki, H., Ramakumar, R., Bing, J., Miao, Z., & Salameh, Z. (2011). A review of hybrid renewable/alternative energy systems for electric power generation: configurations, control, and applications.IEEE
Transactions on Sustainable Energy, 2(4), 392–403.
4. Kirthiga, M. V., Daniel, S. A., & Gurunathan, S. (2013). A methodology for transforming an existing distribution network into a sustainable
autonomous micro-grid.IEEE Transactions on Sustainable Energy, 4(1), 31–41. 5. Wang, D., Ge, S., Jia, H., Wang, C., Zhou, Y., Lu, N., & Kong, X. (2014). A
demand response and battery storage coordination algorithm for providing microgrid tie-line smoothing services.IEEE Transactions on Sustainable
Energy, 5(2), 476–486.
6. Aghatehrani, R., & Kavasseri, R. (2013). Sensitivity-analysis-based sliding mode control for voltage regulation in microgrids.IEEE Transactions on Sustainable
Energy, 4(1), 50–57.
7. Securicon Information Security Solutions. (2013). Introduction to Microgrids. http://securicon.com/content/new-white-paper-introduction-microgrids-2. Accessed 12 Jan 2016.
8. Banerji, A., Sen, D., Bera, A. K., Ray, D., Paul, D., Bhakat, A., & Biswas, S. K. (2013).Microgrid: A review(pp. 27–35). Trivandrum: IEEE Global Humanitarian Technology Conference: South Asia Satellite (GHTC-SAS).
9. Ahmad, F., & Iqbal, S. (2012). Reducing Electricity Consumption in Educational Institutes: A Case Study on Aligarh Muslim University’s Electricity Usage Scenario.IEEE Students’Conference on Electrical, Electronics
and Computer Science, MANIT Bhopal, 2012,34-38.
10. Annual Report 2014-2015, Aligarh Muslim University. http://www.amu.ac.in/ annreport.jsp. Accessed 05 Jan 2016.
11. Archives 2015, Electricity Department, AMU, India. http://www.amu.ac.in/ electricity.jsp?did=10075. Accessed 03 Jan 2016
12. Proceedings of Workshop on Energy Efficiency and Audit for AMU, BEE India. https://www.beeindia.gov.in/content/energy-auditors. Accessed 21 June 2014.
13. Ali, I., & Hussain, S. M. S. (2016). Communication design for energy management automation in microgrid.IEEE Transactions on Smart Grid, 99, 1–1. doi:10.1109/TSG.2016.2606131.
14. Hafez, O., & Bhattacharya, K. (2012). Optimal planning and design of a renewable energy based supply system for microgrids.Renewable Energy,
15. Lambert, T., Gilman, P., & Lilienthal, P. (2005) Micropower System Modelling with HOMER. In Integration of Alternative Sources of Energy,pp. 379–415. John Wiley & Sons, Inc., Hoboken, NJ, USA. doi: 10.1002/0471755621.ch15. 16. NASA Surface meteorology and Solar Energy: HOMER Data. https://eosweb.
larc.nasa.gov/cgi-bin/sse/HOMER.cgi. Accessed 08 Jan 2016.
17. Li, Y., Chen, X., Xiao, J., & Wei, X. (2014). Optimal configuration for distributed generations in micro-grid system considering diesel as the main control source.IEEE Proceedings of the 2014 International Conference on Advanced Mechatronic Systems (ICAMechS), Kumamoto, 2014, 552-556.
18. Synergy enviro engineers. http://www.synergyenviron.com/. Accessed 20 June 2017.
19. Press Information Bureau, Government of India, Ministry of New and Renewable Energy. http://pib.nic.in/newsite/PrintRelease.aspx?relid=133220. Accessed 10 Jan 2016.