AUSTRALIAN JOURNAL OF BASIC AND
Open Access Journal
Published BY AENSI Publication
© 2016 AENSI Publisher All rights reserved
This work is licensed under the Creative Commons Attribution International
http://creativecommons.org/licenses/by/4.0/
To Cite This Article: V. Mary Kiruba Rani, S.S. Dhenakran and A. Heber David Breast Cancer Image Using Colour Properties
A Mathematical Modelling
Image Using Colour Properties
1V. Mary Kiruba Rani, 2S.S. Dhenakran and 3
1Research Scholar, Computer Science & Engineering, Alagappa University, Karaikudi, India 2Professor, Computer Science & Engineering, Alagappa University, Karaikudi, India 3Senior Clinical Scientist, Dr.Agarwal’s Eye Hospital, Tirunelveli, India
Address For Correspondence:
V. Mary Kiruba Rani, Research Scholar, Computer Science & Engineering, Alagappa University, Karaikudi, India E-mail: [email protected]
A R T I C L E I N F O Article history:
Received 04 December 2015 Accepted 22 January 2016 Available online 14 February 2016
Keywords:
Color map, ultrasound, breast cancer, segmentation
Segmentation is the most potent way for predicting medical disease. Predefined techniques for segmentation of images are available. Medical image with good quality images such from MRI, CT scan would be visually clear for the symptoms
Choosing best quality for feature extraction in ultrasound technique without using noise removal technique is proposed.
Converting ultrasound images into color image using color map properties like Jet, HSV, Hot, Cool, Spring, Summer, Autumn, Winter, Gray, Bone, Copper, Pink, Lines. These supported color maps programmatically used in MATLAB for converting an ultrasound image into a color im
where its value ranges between 0.0 and 1.0. The image is represented as rows and columns and each row is an RGB vector that defines one color. The mth row of the color map defines the mth color, where the map (m, : [r (m) g (m) b (m)]) specifies the intensity of red, green, and blue.
Noise removal is the process of adjusting the image pixel values to get a clear view of an image. To obtain the quality of an image, convert an ultrasound image into an RGB color i
original image.
AUSTRALIAN JOURNAL OF BASIC AND
APPLIED SCIENCES
ISSN:1991-8178 EISSN: 2309-8414 Journal home page: www.ajbasweb.com
© 2016 AENSI Publisher All rights reserved
This work is licensed under the Creative Commons Attribution International License (CC BY).
http://creativecommons.org/licenses/by/4.0/
V. Mary Kiruba Rani, S.S. Dhenakran and A. Heber David., A Mathematical Modelling for Quality Based Ultrasound Breast Cancer Image Using Colour Properties. Aust. J. Basic & Appl. Sci., 10(2): 44-51, 2016
Modelling for Quality Based Ultrasound Breast Cancer
Properties
3A. Heber David
Science & Engineering, Alagappa University, Karaikudi, India Professor, Computer Science & Engineering, Alagappa University, Karaikudi, India Senior Clinical Scientist, Dr.Agarwal’s Eye Hospital, Tirunelveli, India
Research Scholar, Computer Science & Engineering, Alagappa University, Karaikudi, India
A B S T R A C T
Prediction of cancer in an image is most challenging under computerized process. The image chosen must be noisy free for better prediction. The cancer images are available in the form of ultrasound, Magnetic Resonance Image (MRI), Computed Tomography (CT). Since ultrasound image (theme) is not having quality, color map properties are applied to make an ultrasound image to quality image. This coloring preprocessing makes the pixel to high intensity. It helps to predict small particles in an ultrasound image such as node, speculation, angular margin and the quality is measured as Sensitivity, Specificity, Contract Noisy Ratio, and Accuracy. This article has proposed a new technique called Quality Based Image Model (QBIM), using color properties, to generate quality images for segmentation. The aim of this article is to give a new idea for providing a quality image for image segmentation. The resultant image by this approach is better than the image using filtering techniques, which removes noisy spots, smoothening images, sharpening image, and clear visibility of objects. The new approach has tested on a set of ultrasound 2D converted images and positive predicted values are achieved.
INTRODUCTION
Segmentation is the most potent way for predicting medical disease. Predefined techniques for segmentation of images are available. Medical image with good quality images such from MRI, CT scan would be visually clear for the symptoms of disease. However, in the ultrasound image, such quality is missing. Choosing best quality for feature extraction in ultrasound-screened image is challenging criteria. A new technique without using noise removal technique is proposed.
ound images into color image using color map properties like Jet, HSV, Hot, Cool, Spring, Summer, Autumn, Winter, Gray, Bone, Copper, Pink, Lines. These supported color maps programmatically used in MATLAB for converting an ultrasound image into a color image. A color map is defined as mX3 matrix where its value ranges between 0.0 and 1.0. The image is represented as rows and columns and each row is an RGB vector that defines one color. The mth row of the color map defines the mth color, where the map (m, : [r (m) g (m) b (m)]) specifies the intensity of red, green, and blue.
Noise removal is the process of adjusting the image pixel values to get a clear view of an image. To obtain the quality of an image, convert an ultrasound image into an RGB color image and again converting back to its
A Mathematical Modelling for Quality Based Ultrasound
for Quality Based Ultrasound Breast Cancer
Research Scholar, Computer Science & Engineering, Alagappa University, Karaikudi, India.
Prediction of cancer in an image is most challenging under computerized process. The image chosen must be noisy free for better prediction. The cancer images are available the form of ultrasound, Magnetic Resonance Image (MRI), Computed Tomography (CT). Since ultrasound image (theme) is not having quality, color map properties are applied to make an ultrasound image to quality image. This coloring preprocessing
xel to high intensity. It helps to predict small particles in an ultrasound image such as node, speculation, angular margin and the quality is measured as Sensitivity, Specificity, Contract Noisy Ratio, and Accuracy. This article has proposed ue called Quality Based Image Model (QBIM), using color properties, to generate quality images for segmentation. The aim of this article is to give a new idea for providing a quality image for image segmentation. The resultant image by this ter than the image using filtering techniques, which removes noisy spots, smoothening images, sharpening image, and clear visibility of objects. The new approach has tested on a set of ultrasound 2D converted images and positive predicted
Segmentation is the most potent way for predicting medical disease. Predefined techniques for segmentation of images are available. Medical image with good quality images such from MRI, CT scan would of disease. However, in the ultrasound image, such quality is missing. screened image is challenging criteria. A new
ound images into color image using color map properties like Jet, HSV, Hot, Cool, Spring, Summer, Autumn, Winter, Gray, Bone, Copper, Pink, Lines. These supported color maps programmatically age. A color map is defined as mX3 matrix where its value ranges between 0.0 and 1.0. The image is represented as rows and columns and each row is an RGB vector that defines one color. The mth row of the color map defines the mth color, where the map (m, :) =
45 V. Mary Kiruba Rani et al, 2016
Australian Journal of Basic and Applied Sciences, 10(2) Special 2016, Pages: 44-51
Computerized techniques for image feature selection in an ultrasound image are tedious task. Several researches, under color segmentation for an image are performed. The process involves getting the pixel values of RGB components of an image and performing segmentation based on the learning. The quality of an image can be calculated based on the sensitivity, specificity, positive predicted value, negative predicted value. Totaling all measurements gives accuracy. If it is 100%, then the quality of an image is good. The contribution of this article is to provide a better quality image for further computerized processing.
Over the last few decades, quite a lot of techniques were merged for selecting quality images for image segmentation. Color based segmentation on data fusion techniques (Rafika Harrabi and Ezzedine Ben Braiek, 2012) emerged to merge several images of different color spaces. All the images are grouped together to get better segmentation results.
Ultrasound elastography provides a color map for real time gray scale image (Andrew Evans, Pasty Whelehan et.al, 2010). Edge detection of any object in a cancer ultrasound image is a tedious process. Since the image has same pixel values at one position, it is hard to group out the objects within a certain area.
The key idea for color segmentation over an ultrasound image is, to fuse the pixel values of RGB of the original image for increasing the quality (Harrabi R, Ben Braiek E, 2011) and to obtain an optimal segmented image. Color based image selection is done with the help of MATLAB tool which provides User Interface techniques. The feature selection of a processed ultrasound image is calculated with common accuracy values. The values of features range in sonographic speculation (87-90%), Deeper than wide (74-80%), Microlobulation (75%), Hyper echoic (74%), Angular Margins (70%), Branching Pattern (30%), Calcifications (25%). Since the object in an ultrasound image would have minor particles, the quality of an image is to be calculated within certain range. The features for malignant tumor are found accurately if the value resides within the range.
The systematic development of color based quality of images is classified as; RGB, HSV, YIQ, XYZ, LAB, and LUV Color spaces. The result is obtained by merging related images (Andrew Evans, Pasty Whelehan et.al, 2010).The rest of the article is composed as follows: Section II explains the method related to Quality Based Image Modeling. Section III introduces the proposed approach for selection of images. Section IV, deals with resulting part of the work. Final section packs together the discussion with a short conclusion.
Analysis Of Existing Methods:
The present era is a computerized world. Due to the environmental changes, health condition of human also changes. Particularly, the human infected by cancer also showing growth in change. To detect accurately the disease by symptoms, it requires quality image. A few methods, which specify the quality of images, are thrashed out beneath.
Rafika Harrabi and Ezzedine Ben Braiek (2012) proposed new color image segmentation based on the multi-level Thresholding that is processed by combining different data related to same color of the image to increase the quality of the image. The Thresholding is based on the Otsu optimization approach and evidence theory is followed to merge several breast cancer cell images in order to get accurate segmentation results.
Andrew Evans, Patsy Whelehan et al (2010) defined a new technique called quantitative shear wave ultrasound elastography which states that the quality of the images are compared foe classification and extraction of features in ultrasound benign and malignant images.
Wen Zhu, Nancy Zeng and Ning Wang (2010) contribute a technique that finds the accuracy based on the attributes sensitivity, specificity using statistical methods. Receiver Operating Characteristic (ROC) curve predicts the relationship between both sensitivity and specificity to get the best threshold for test.
Ismail Avcibas, Bulent sankur, Khalid Sayood (2002), categorized the image quality measures as pixel-difference based; correlation-based, edge-based and Spectral-based. They finalized the quality of space spectrum, which used simple multi resolution technique for good quality image.
Quality Based Image Model (Qbim):
It is noted that the problem over existing methods on ultrasound image provides a visually unclear image. Further, the minute particles in 2D images are not visible. The proposed QBIM approach overcomes the drawbacks of existing methods.
(A) Color Properties with pixel representation:
A color map technique is implemented with the original ultrasound 2D image and a color map technique applied for converting the image into any color image by setting the properties like: Jet, HSV, Hot, Cool, Spring, Summer, Autumn, Winter, Gray, Bone, Copper, Pink, Lines. These are the default color properties, which add RGB color on the intensity values.
predicting any kind of symptoms related to medical terms. to each pixel Pxy of each row at the location (x, y).
Fig. 1: Color Value calculation of a row in an image
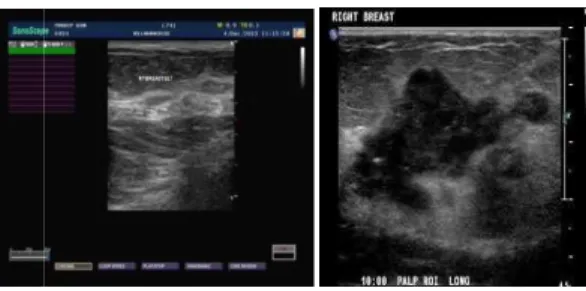
The images chosen for conversion are taken from an ultrasound image. The format of the image is said to be original, i.e. without using any noise removal techniques. The objects to be detected in an ultrasound breast tumor images are irregular shape, taller than wider, cysts, s
Fig. 2: Original ultrasound breast image
The original image is processed with color map features. The images with color properties cannot be directly measured and hence it is converted into grayscale images. Histogram for
the number of colors and its range. The gray converted images are ready for automatic prediction
The complete process for selection of quality image with basis of quality measurements is shown in Fig.3. The color properties such as: Hot, Cool, lines gray, Hsv, copper, jet, winter and more are applied to the original image
Various supporting properties of color map are applied to visualize ultrasound images of Fig.2 and the resultant images are as in Figure 3.
Fig. 3: Ultrasound images using color map properties
predicting any kind of symptoms related to medical terms. In Fig.1, the conversion of an image with color map of each row at the location (x, y).
Color Value calculation of a row in an image.
conversion are taken from an ultrasound image. The format of the image is said to be original, i.e. without using any noise removal techniques. The objects to be detected in an ultrasound breast tumor images are irregular shape, taller than wider, cysts, spreading of tumor cells.
Original ultrasound breast image.
The original image is processed with color map features. The images with color properties cannot be directly measured and hence it is converted into grayscale images. Histogram for these color inputs can predict the number of colors and its range. The gray converted images are ready for automatic prediction
The complete process for selection of quality image with basis of quality measurements is shown in Fig.3. such as: Hot, Cool, lines gray, Hsv, copper, jet, winter and more are applied to the original
Various supporting properties of color map are applied to visualize ultrasound images of Fig.2 and the
trasound images using color map properties.
In Fig.1, the conversion of an image with color map
conversion are taken from an ultrasound image. The format of the image is said to be original, i.e. without using any noise removal techniques. The objects to be detected in an ultrasound breast
The original image is processed with color map features. The images with color properties cannot be these color inputs can predict the number of colors and its range. The gray converted images are ready for automatic prediction
The complete process for selection of quality image with basis of quality measurements is shown in Fig.3. such as: Hot, Cool, lines gray, Hsv, copper, jet, winter and more are applied to the original
47 V. Mary Kiruba Rani et al, 2016
Australian Journal of Basic and Applied Sciences, 10(2) Special 2016, Pages: 44-51
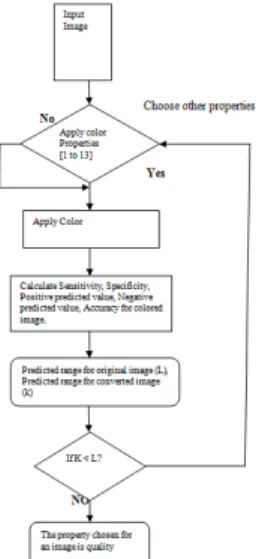
The images generated in Fig.3 are now applying threshold value to increase the intensity of each pixel color. The result is proven that 4-6 values are fixed for good quality. If the threshold value less than 4, the image intensity is slightly changed, but not a clear visual of small particles such as nodes in an ultrasound image are known. If the threshold value greater than 6, shows very high intensity, which results in over brightness and even the object in the ultrasound, gets vanishing.
Then the quality measurements of an image such as sensitivity, specificity, positive predicted value, negative predicted value and accuracy. These measurements should predict the characteristic features of an ultrasound image prescribed by the radiologist.
If the predicted value is greater than the original value, choose the property for auxiliary processing.
Fig. 4: QBIM Method.
Let M , :Ω→ be the images described on the image domain Ω, where M stands for the ultrasound
breast image (original image) and L stands for the converted image. The difference between the images gives the variation of pixel values. The properties of pixel values are maximized for its original value to improve the visibility of objects in. Finding the correct feature in a medical image is also a challenging task.
Xi stands for a single pixel where i € N, N is the set of all pixels of the image. The conversion of the image is,
∑ , → ∗ 2 − (1)
In order to illustrate the methods, initially a single medical image is trained for numerical evaluation. After images are converted into RGB format where each of its primeval colors Red, Green and Blue are represented by 8 bits and its intensity values from 0 to 255. The parameters for image selection are various color maps techniques and size of squared window for calculating the difference intensity value among the foreground and background image.
(B) Analysis of Quality Measurement:
As stated before, the quality measurements of an image are reflected by Sensitivity, Specificity, Positive Predicted value, Negative Predicted Value and Accuracy. True Positive Rate and False Positive rate in turn define these factors.
A True Positive Ratio (TPR) is termed as sensitivity, which approach for finding correct diseases based on the case in point. For example, for ultrasound breast image if the images have the possibility of finding the cancer characteristics, then it is measured as sensitivity or counted to true positive ratio.
False Positive Ratio (FPR) is also said to be specificity, which calculates the negative proportion of the measure. For example, the percentage of finding the normal cancer image which does not contain any malignant features.
Sensitivity refers to testing the presence of a particular characteristic in an image with given nature. It is calculated by predicting true positives with summing true positives and false negatives. The equation states,
= + "#$ %#
Mathematically, referred as,
% = ' ∀ ∑*+,-)Є .
Where, n is the number of images, p is the total number of images which is predicted as positive based on the symptoms; m is the number of images with positive symptoms but with negative result, N is the total count images with negative result . M is the total number of images set for testing.
Specificity refers to detecting the absence of specified character and is calculated with true negatives by adding true negatives and false positives.
5 6 5 = %# %#+ 6#$
This can be deliberated as,
% = ' ∀ ∑*+,-78Є .
∀ ∑*+,-78Є ./ ∀ ∑01,-9 Є .2 ∗ 100 (3)
Since ultrasound images are naturally noisy images, the quality of measurements over noisy image and noisy free images is done. The first calculation for noise ratio is calculated as Contrast to Noisy Ratio (CNR). The noisy ratio is calculated between the background noise and feature of an image. The quantitative result for the dissimilarity images are calculated as,
:;< = LM=G =7A8 H?@8AB N/M=G =7A8 ?=AEFGHI7J 7H K8 N.8=7 >?@8AB CD8=7 ?=AEFGHI7J 7H K8 Mathematically represented as,
:;< =LPHN/P?NOHCO? (4)
Where, Єo is the ratio of mean object.
Єb is the ratio of the mean background noisy image. ρo refers to the variance of region of interest.
ρb refers to the variance of removal of background noise removal
The similarity between original image and processed image is calculated because the shape and size of the image should not differ in any angle. The mathematical representation for
: $# Q #$ R S T :QR [10], is given as,
:QR =U ∑U ~V ,@ NV ,@ N
X (5)
Accuracy (Acc) is defined by the proportion of true results, whether it is true positive or true negative. It is used for testing the degree of dependability of symptoms in an image. Accuracy also states as the number of correct assessments, to the number of all assessments.
Y55 = ZGI8 78F=B [8/ZGI8 )HK B [8/\=]K8 8F=B [8/^=]K8 )HK B [8ZGI8 8F=B [8/ZGI8 )HK B [8
Y55 =∑ Z /Z9/\ /\9∑ Z /Z9 (6)
(C) Feature Extraction:
The basic information of an image is obtained from histogram of an image. The probability of density function is the ratio of the values of the intensity level histogram with total number of pixels in an image.
_ % #` =b∗Ma i=0, 1…N) (7)
Where:
h- Total number of pixels in an object.
H- Total number of cells in the horizontal spatial domain, V- Total number of cells in the vertical spatial domain. N – Total gray level of an image.
The features extracted from ultrasound breast tumor images are Speculation, Taller than Wide, Angular margins, Shadowing, Branching Pattern, Hypoechogenicity, calcification, Duct Extension, Branching pattern, Microlobulation.
(D) Algorithm Specification for selection of quality image:
The following algorithm gives the conversion of pixel values based on the color map properties.
Algorithm QBIM (M, L):
\\ M is the original image, \\ L is the converting color image
\\ size (M) is the total number of pixels in an image \\ avg(i) is the testing image values
49 V. Mary Kiruba Rani et al, 2016
Australian Journal of Basic and Applied Sciences, 10(2) Special 2016, Pages: 44-51 \\ FPR- False Positive Rate
\\ L(i) is the pixel value of converted color image {
u=size (M) v=size (L) if (u==v) {
For i=1 to u x (i)=L (i)
if x (i) ≠ 0 && x (i) > 50 avg(i)=x(i)
else
low (i) =1-x(i) FP=sum+ (avg(i) * low(i)) TP= sum + (avg (i) * L (i)) FN = sum + (x (i) – TP) TN= sum + (1 –FP) TPR = TP / (TP + FN) FPR = FP / (FP + TN) End
End } End }
RESULTS AND DISCUSSION
The following table1 shows the sensitivity, specificity and accuracy values of an ultrasound breast cancer image. These values are calculated by applying various color map properties and found that the accuracy of color map with gray value is 97.80%.
Table 1: prediction table the cancer tumor.
COLORMAP SUPPORTS SENSITIVITY (%) SPECIFICITY (%) ACCURACY (%)
Jet HSV Hot Cool Spring Summer Autumn Winter Gray Bone Copper Pink Lines Normal gray 99.93 100 100 100 100 100 100 100 97.82 97.74 98.16 99.65 100 94.34 81.13 81.09 94.92 81.09 81.1 81.09 81.09 81.09 97.78 97.79 97.15 81.36 86.99 99.19 89.55 89.56 97.19 89.56 89.6 89.56 89.56 89.56 97.80 97.77 97.60 89.55 93.01 97.02
The curve illustrates the functionality of the accuracy values among several color map properties. The Y-axis shows the increasing sensitivity value and X-Y-axis shows the False positive rate and the Y-Y-axis shows the True Positive rate. Here the TPR is considered above 90%.
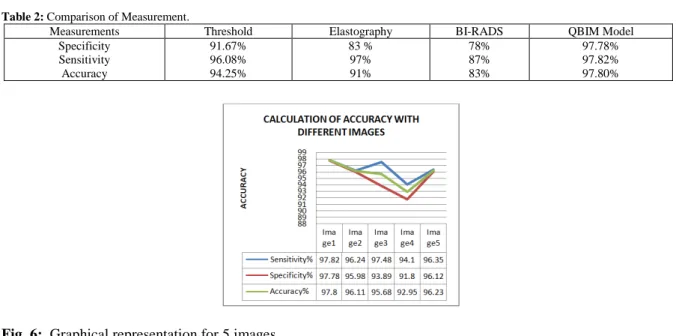
The table below shows the measurement; analysis of ultrasound-converted images by QBIM method and the result is compared with existing techniques Elastography, BI_RADS. The QBIM model shows a better ratio of 97.80%. QBIM method estimates the final accuracy function with respect to high sensitivity (%) i.e. finding of cancer is high and low specificity (%) i.e. less possibility for finding the absence of malignant tumor.
In Fig.5, it explains the outcome of various images with higher accuracy and found that an ultrasound image with gray color map techniques has a greater prediction on cancer images.
The original ultrasound image is converted to color gray image. The edge detection technique is applied to detect the edges clearly and accurately using the canny edge detector. Clearly, all particles in the ultrasound images are separated by edges. This is visible to the user, since the image has higher quality intensity range.
Each image has accuracy above 90%. It is understood that the proposed model gives the more probability in prediction of cancer classification.
Fig. 5: ROC color based image selection.
Table 2: Comparison of Measurement.
Measurements Threshold Elastography BI-RADS QBIM Model
Specificity Sensitivity Accuracy
91.67% 96.08% 94.25%
83 % 97% 91%
78% 87% 83%
97.78% 97.82% 97.80%
Fig. 6: Graphical representation for 5 images.
51 V. Mary Kiruba Rani et al, 2016
Australian Journal of Basic and Applied Sciences, 10(2) Special 2016, Pages: 44-51
The Correlation Quality Index (CQI) is calculated for similarity between original image and Quality based image. The result obtained for both the images is measured as 88.6% for image1, 70.5% for image 2, 63.3% for image 3, 80.2% for image 4, 62.1% image 5. The limitation over QBIM method is that the computation of similarity is possible only when the image is converted to gray map properties.
Contract noisy ratio is calculated to find the clear appearance between background and foreground image. The visibility ratio found are line: 172.42, new gray: 88.50, autumn: 90.52, jet: 135.67, cool: 90.95 cooper: 87.59. These values are evaluated with a total number of pixel values in it. The difference between the signal insensitivities in the Region of Interest and Standard Deviation of the pure image noise is calculated.
Conclusion:
This article is presenting a new approach for choosing a high intensity image for computerized operation. The goal is to achieve quality-based image. Using color image and contract function, the image is enhanced and the features: Speculation, Taller than Wide, Angular margins, Shadowing, Branching Pattern, Hypoechogenicity, calcification, Duct Extension, Branching pattern, Microlobulation are extracted well effectively. The accuracy of calculating quality of an image is above 97%.
Instead of using noise removal techniques, color map function converts the image back to grayscale. The image with high intensity is used for predicting features related to prescribe. This technique is more helpful for segmentation and feature extraction of an ultrasound 2D image.
ACKNOWLEDGEMENT
The authors would like to thank Agarwal research center for translational research, Tirunelveli, Dr.Joseph, Senior Consultant, Dr.Jeyanthi, Radiologist, Pratheep Scan Center Vasudevanallor, Sangarankovil for their kind help and thoughtful comments.
REFERENCES
Agarwal research center for translational research, T irunelveli. Rafika Harrabi and Ezzedine Ben Braiek, 2012, “Color image segmentation using multi-level Thresholding approach and data fusion techniques: application in breast cancer cell images”, EURASIP journal on image and video processing.
Andrew Evans, Pasty Whelehan, 2010. ”Quantitative shear wave ultrasound elastography: initial experience in solid breast masses”, Breast Cancer research.
Harrabi, R., E. Ben Braiek, 2011 ” Color image segmentation using automatic Thresholding techniques”, SSD.
Burnside, E.S., T.J. Hall, 2007. “Differentiating benign from malignant solid breast masses with US strain imaging”, Radiology.
Wen Zhu, Nancy Zeng, 2010. ” Sensitivity, Specificity, Accuracy, Associated confidence interval and ROC analysis with practical SAS implementations”, NESUG.
Ismail Avcibas, Bulent sankur, Khalid Sayood, 2002. ”Statistical evaluation of image quality measures”, Journal of Electronic Imaging.
Yi Xu, Licheng Yu, 2015. “ Vector sparse representation of color image using Quaternion matrix analysis”, IEEE transactions on image processing, 24-4.
Alexandra Kraemer, Ekaterina Kovacheva, Gisela Lanza, 2015. “Projection based evaluation of CT image quality in dimensional metrology”, Digital Industrial Radiology and Computed Tomography.
Bini, A.A.,·M.S. Bhat, 2014. ” Despeckling low SNR, low contrast ultrasound images via anisotropic level set diffusion”, Multidim Syst Sign Process.