M E T H O D O L O G Y
Open Access
In-silico predictive mutagenicity model
generation using supervised learning approaches
Abhik Seal
1*†, Anurag Passi
2†, UC Abdul Jaleel
3, Open Source Drug Discovery Consortium
2and David J Wild
1Abstract
Background:Experimental screening of chemical compounds for biological activity is a time consuming and expensive practice.In silicopredictive models permit inexpensive, rapid“virtual screening”to prioritize selection of compounds for experimental testing. Both experimental andin silicoscreening can be used to test compounds for desirable or undesirable properties. Prior work on prediction of mutagenicity has primarily involved identification of toxicophores rather than whole-molecule predictive models. In this work, we examined a range ofin silico
predictive classification models for prediction of mutagenic properties of compounds, including methods such as J48 and SMO which have not previously been widely applied in cheminformatics.
Results:The Bursi mutagenicity data set containing 4337 compounds (Set 1) and a Benchmark data set of 6512 compounds (Set 2) were taken as input data set in this work. A third data set (Set 3) was prepared by joining up the previous two sets. Classification algorithms including Naïve Bayes, Random Forest, J48 and SMO with 10 fold cross-validation and default parameters were used for model generation on these data sets. Models built using the combined performed better than those developed from the Benchmark data set. Significantly, Random Forest outperformed other classifiers for all the data sets, especially for Set 3 with 89.27% accuracy, 89% precision and ROC of 95.3%. To validate the developed models two external data sets, AID1189 and AID1194, with mutagenicity data were tested showing 62% accuracy with 67% precision and 65% ROC area and 91% accuracy, 91% precision with 96.3% ROC area respectively. A Random Forest model was used on approved drugs from DrugBank and
metabolites from the Zinc Database with True Positives rate almost 85% showing the robustness of the model. Conclusion:We have created a new mutagenicity benchmark data set with around 8,000 compounds. Our work shows that highly accurate predictive mutagenicity models can be built using machine learning methods based on chemical descriptors and trained using this set, and these models provide a complement to toxicophores based methods. Further, our work supports other recent literature in showing that Random Forest models generally outperform other comparable machine learning methods for this kind of application.
Keywords:Molecular descriptors, Machine learning, Mutagenicity, Random forest, Screening, Toxicophores
Background
In the past two decades high throughput screening (HTS) has provided a large amount of experimental data on com-pound biological activities. Data mining and machine learn-ing methods provide an in silico counterpart building predictive models based on chemical structure features and other properties, and training sets of known bioactivities. Despite these capabilities quantitative methods do not tend
to model the biochemical and physiological process well. Recent developments in machine learning have focused on the exploration of large data sets with non–congeneric molecules. The applicability of Quantitative Structure Ac-tivity Relationship (QSAR) studies to predict toxicity is very limited. The rationale behind the use of machine learning is to discover patterns and signatures in data sets from high throughput in-vitro assays. Nonetheless, the development of in-silico models as alternative approaches to mutageni-city assessment of chemicals without animal testing is con-stantly increasing and has attracted researchers in the field of Quantitative Biological Activity Relationship (QBAR) [1] and even toxicology.
* Correspondence:abseal@indiana.edu †Equal contributors
1
Indiana University Bloomington School of Informatics and Computing, Bloomington, USA
Full list of author information is available at the end of the article
Mutagenicity is the ability of a substance to cause genotoxicity. Experimentally, mutagenicity is assessed by Ames test performed on Salmonella typhimurium bacterial strains where each bacterial strain is sensi-tive to specific chemical mutagen [2]. It has been found that the predictive power of positive Ames test for rodent carcinogenicity is high, ranging from 77% to 90% [3]. Kazius et al. [4] assembled a data set of 4337 compounds and derived 29 toxicophores with an error rate of 18% in training set and 15% in a val-idation test set. Helma et al. [5] reported MOLFEA algorithm for generation of descriptors based on mo-lecular fragments for non-congeneric compounds and compared various machine learning algorithms with its data set of 684 compounds derived from
Carcino-genic Potency Database (CPDB: http://potency.
berkeley.edu/). The data set gave an accuracy of 78% with 10 folds of cross validation. Hansen et al. [6] reported a unique new public Ames Mutagenicity data set with 6500 compounds and compared results with commercial and non-commercial tools. Zhang and Sousa [7] also reported the use of MOLMAP descriptors for bond properties which were used for training of Random Forest classifier. Error percen-tages, as low as 15% - 16% were achieved with an external validation set of 472 compounds against a training set of 4083 structures. Up to 91% sensitivity and 93% specificity were obtained from the test sets. Feng et al. [8] used four data sets NCI, Mut, Yeast and Tox and generated four different types of descriptors. Using statistical methods, models were built to link chemical descriptors to the biological activity. King et al. [9] reported different methods for establishing structure activity relationships (SARs). They represented chemical structures by atoms and bond connectivities in combination with inductive logic programming algorithm Progol. They tested 230 pounds which were divided in two sets of 188 com-pounds and 42 comcom-pounds. For 42 comcom-pounds Progol formed a SAR better than linear regression and back propagation. Judson et al. [10] used different classifiers to predict the accuracy of the model of complex chem-ical toxicology data sets. Neural networks and Support Vector Machines (SVM) were at the top of the list of classifiers, predicting with 96% and 99% specificity, re-spectively. They also mentioned that irrelevant features decreased the accuracy rate, with linear discriminant analysis suffering the maximum degradation. Ferarri and Gini [11] proposed the idea of a trained QSAR classifier supervised by a SAR layer that incorporates coded human knowledge. The model is implemented in the CAESAR project (http://www.caesar-project.eu) [12] where initially a classifier is trained on more than four thousand molecules based on Bursi data set by
using molecular descriptors, then in the next step the relative knowledge to complement its practice is extracted from a collection of well-known structural alerts. Votano et al. [13] reported the application of three QSAR methods using artificial neural networks, k-nearest neighbors, and decision forest, to a data set of 3363 diverse compounds. They used molecular con-nectivity indices, electrotopological state indices, and binary indicators to obtain an accuracy of 82%.
Unlike many bioactivities, mutagenicity can be linked to very specific chemical structure fragments and func-tional groups, usually referred to as toxicophores, which interfere with DNA [14-16]. These include aromatic amines, hydroxyl amines, nitroso compounds, epoxides, thiols, nitrogen mustards, aziridines, aromatic azo’s, pro-piolactones, aliphatic halides, thiophenes, heteroatom derivatives, polycylic planar compounds, hydrazine, hydrazide and hydroxylamine. It has also been found that detoxifying structures such as the CF3, SO2NH, SO2OH and aryl sulphonyl derivates render mutagenic compounds non-mutagenic [17].
In this paper, firstly, we have applied four classification algorithms - Naïve Bayes, J48, Random Forest and Se-quential Minimal Optimizer (SMO) - to model the mutagenicity data of compounds. In particular, we were interested in discovering whether such“whole molecule” algorithms are appropriate for mutagenicity prediction, or whether this is better done using simple alerts based on toxicophores. We were also interested in whether we would replicate previous work indicating that Random Forest is a better classifier than other Base and Ensemble classifiers [18]. We tested the model with validation sets (PubChem data sets AID1189 and AID1194, DrugBank [19] approved, and withdrawn drugs and Zinc metabo-lites data (zinc.docking.org/browse/subsets/special.php) [20] all of which indicate that the Random Forest model performs well.
Methods
Data sets
converted the data to the ARFF format for further clas-sification. For set 1“remove useless”operation in Weka, of the initial 179 descriptors, 151 descriptors which con-tained 24 weighted burden number descriptors, 8 prop-erties descriptor and 120 pharmacophore fingerprints were obtained. For set2 and 3 the remove useless oper-ation resulted in 154 descriptors (of the initial 179 descriptors) which contained 24 weighted burden num-ber descriptors, 8 properties descriptors and 123 pharmacophore fingerprints.
For validation of the generated model, external test sets were used. External data sets, AID1189 and AID1194, were taken from EPA DSSTOX data set in the CPDB [22]. AID1189 contained 1477 compounds with 788 mutagens and 689 non-mutagens and AID1194 contained 832 com-pounds with 396 mutagens and 436 non-mutagens. The toxicity models were tested against the 1410 approved drugs and 66 withdrawn drugs from the DrugBank data-base and as well as with the 22080 metabolite data which were taken from the recently published ZINC Data sets. The metabolites may be toxic or non-toxic the idea here is to check whether the compounds formed after metabolism has some mutagenicity or not using our predictive models.
Chemical descriptors
For each data set, descriptors were calculated by PowerMV [23]. PowerMV calculates a total of 6122 descriptors classi-fied as 546 atom pair descriptors, 4662 Carhart descriptors, 735 fragment pair descriptors, 147 pharmacophore finger-prints, 24 Weighted Burden Number descriptor and 8 properties descriptors. Among those we used:
Property descriptorsincluding XlogP (a measure of the propensity of a molecule to partition into water or oil), polar surface area (PSA), number of rotatable bonds, H-bond donors, H-bond acceptors, molecular weight, blood–brain indicator (0 indicating a compound does not pass the BBB, and 1 indicating that a compound passes the BBB) and bad group indicator (the molecule contains a chemically reactive or toxic group).
Pharmacophore Fingerprint descriptors based on
bioi-sosteric principles. They are divided in to six classes to-taling to 147 descriptors.
Weighted Burden number descriptors, a set of continu-ous descriptors and are also a variation of the Burden
number [24]. One of the three properties, namely, electro-negativity, Gasteiger partial charge or atomic lipophilicity and XLogP is placed on the diagonal of the Burden con-nectivity matrix. The off-diagonal elements are weighted by one of the following values: 2.5, 5.0, 7.5 or 10.0. Then the largest and the smallest eigenvalues are used as descriptors.
Machine learning classifiers
Machine learning has been widely used in classifying mole-cules as active or inactive, mutagen or non-mutagen against a protein target [25]. In this work we used Weka [26] open source software which is a collection of different classifiers for data mining and machine learning. It is licensed under GNU GPL. It includes tools for data pre-processing, classi-fication, regression, clustering, association rules, and visualization. Of the many data mining approaches that have been explored, four have evolved to largely dominate other classification methods at present. These are a) Bayesian methods [27] b) Support Vector Machines [28] c)Decisiontrees[29]andd)RandomForest[30,31].
Workflow
The data sets were downloaded in SD File format. The PowerMV descriptor calculation tool was used to generate chemical descriptors. A total of 179 descriptors were gen-erated for all the three data sets used. Bioassay data was appended as an outcome column to each of the data sets in the comma separated values (CSV) file format. The compounds were labeled mutagens and non-mutagens based on the respective bioassay data. After merging of Set1 and Set 2 compounds, the duplicate compounds are removed from the data and it resulted in 8292 compounds representing Set 3 data set. Useless descriptors were removed among the 179 descriptors which resulted in 155 descriptors for Set 2 and Set 3 and 152 descriptors for Set 1. Each data set was trained with 10 fold cross validation with default parameters for all the four classifiers men-tioned earlier. The models generated were tested with remaining 20% test data and also validated using external data sets from PubChem AID1189 and AID1194, Drug-Bank drugs and Zinc metabolites data. Additional file 3 contains the csv formatted file of descriptors for exter-nal datasets. Using the knowledge flow provided by Weka, a workflow represented in Figure 1 was prepared which loads the data sets, applies the classifiers to gen-erate the models which are tested using the test compounds.
Results
The results are discussed for each of the data sets for which the models were developed using the four classi-fiers. The Random Forest was parameterized with 100 trees because we did not find much difference in the out
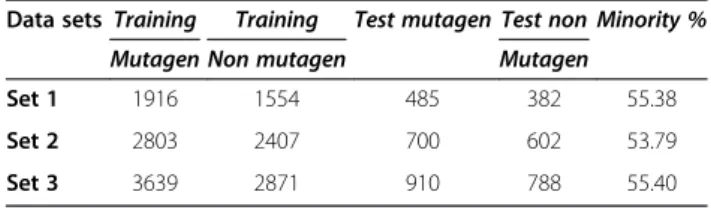
Table 1 Distribution of different data sets and it compounds (mutagens and non-mutagens) in test and train sets
Data sets Training Training Test mutagen Test non Minority %
Mutagen Non mutagen Mutagen
Set 1 1916 1554 485 382 55.38
Set 2 2803 2407 700 602 53.79
of bag error rates for 500 trees (which was around less than 0.5%).
Set 1:The results given in Table 2 show that Random Forest outperformed the other classifiers. For Set 1 the Random Forest classifier classified internal 20% test data with 79.81% accuracy, 79.5% average precision and 89.2% AUC ROC which is the best model for the Set 1. For the external set, AID1189, it classified with 64.65% accuracy, 66.4% Average precision and 67.3% AUC ROC
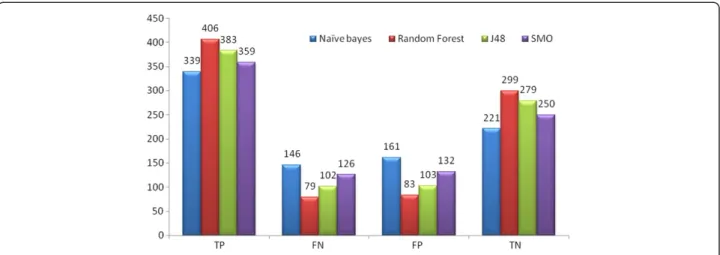
as shown in Table 3. For AID1194 it predicted 84.85% accuracy, 84.9% Average precision and 93.1% AUC ROC as shown in Table 4. Figure 2 depicts the number of True Positive (TP), False Positive (FP), True Negative (TN), and False Negative (FN) compounds predicted in Set 1.
Set 2:The results provided in Table 5 portray the pre-dictive power of the Random Forest algorithm. Here it was observed that for Set 2 the Random Forest classified
Table 4 Result table for AID1194 taken as validation set for the models generated on different sets i.e. Set 1, Set 2 and Set 3
Classifiers Data set Accuracy% Precision % Recall% ROC
Naïve Bayes Set 1 55.76 54.3 42.78 57.50%
Set 2 55.88 54.6 42.27 58.00%
Set 3 61.05 63.2 61.1 66.8%
Random Forest Set 1 84.85 86.3 81 93.1%
Set 2 87.86 87.7 86.58 94.30%
Set 3 90.14 90.1 90.1 96.8%
J48 Set 1 80.88 79.0 80.50 84.20%
Set 2 84.37 85.7 80.50 86.20%
Set 3 87.01 87 87 88.7%
SMO Set 1 62.01 62.6 49.62 67.60%
Set 2 69.23 71.8 57.97 68.70%
Set 3 56.12 57 56.1 61.2%
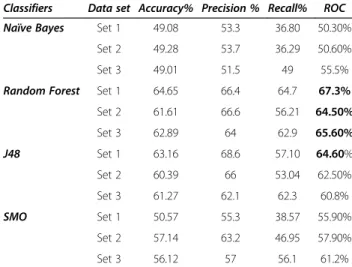
It was found that AID1194 classified better on Set 3 with above 90% accuracy. Table 3 Result table for AID1189 taken as test set for the
models prepared by different sets i.e. Set 1, Set 2 and Set 3 Classifiers Data set Accuracy% Precision % Recall% ROC
Naïve Bayes Set 1 49.08 53.3 36.80 50.30%
Set 2 49.28 53.7 36.29 50.60%
Set 3 49.01 51.5 49 55.5%
Random Forest Set 1 64.65 66.4 64.7 67.3%
Set 2 61.61 66.6 56.21 64.50%
Set 3 62.89 64 62.9 65.60%
J48 Set 1 63.16 68.6 57.10 64.60%
Set 2 60.39 66 53.04 62.50%
Set 3 61.27 62.1 62.3 60.8%
SMO Set 1 50.57 55.3 38.57 55.90%
Set 2 57.14 63.2 46.95 57.90%
Set 3 56.12 57 56.1 61.2%
It was found that AID1194 classified better on Set 3 with above 90% accuracy.
Table 2 Result table for Set 1 with four classifier algorithms Naïve Bayes, Random Forest, J48 and SMO
Classifiers TP% FP% TN% FN% Accuracy% Average Average Average
Precision% Recall% ROC
Naïve Bayes 69.9 42.1 57.9 30.1 64.59 67.8 69.89 71.90%
Random Forest 83.7 21.7 78.3 16.3 79.81 79.5 78.3 89.2%
J48 79 27 73 21 76.35 78.8 78.96 77.20%
SMO 74 34.6 65.4 26 70.24 73.1 74.02 77.10%
Random Forest showed the Best accuracy with 79.81% and ROC Area of 89.2%. It also has high True Positive (TP) rate with low False Positive (FP) rate.
the internal 20% test data with 78.18% accuracy, 77.3% precision and 85% AUC ROC. J48 also performed well with 73.6% accuracy but was not better than Random Forest. With external test set AID1189 it classified with 61.6% accuracy, 66.6% precision and 64.5% ROC area as given in Table 3. With AID1194 it classified 87.86% ac-curacy, 87.7% precision and 94.3% AUC ROC as given in Table 4. Figure 3 depicts the number of True Positive
(TP), False Positive (FP), True Negative (TN), and False Negative (FN) compounds predicted in Set 2.
Set 3: 154 descriptors were taken from initial 179 descriptors ,which contained 24 272 weighted burden number descriptors, 8 properties 273 descriptors and 124 pharmacophore fingerprints. The results are given in Table 6 classifiers. After merging compounds from the two sets it was observed that Random Forest was
Table 5 Result table for Set 2 with four classifier algorithms Naïve Bayes, Random Forest, J48, and SMO
Classifiers TP% FP% TN% FN% Accuracy% Precision % Recall% ROC
Naïve Bayes 70.9 45.5 54.5 29.1 63.28 64.4 70.85 69.60%
Random Forest 80.6 22.4 17.6 19.4 79.18 79.2 79.2 87.4%
J48 74.3 27.1 72.9 25.7 73.65 74.0 74.28 77%
SMO 69.9 37.5 62.5 30.1 66.43 68.4 69.85 78.10%
Random Forest showed the Best accuracy 85.15% with ROC Area 92.4%. It also has high True Positive (TP) rate with low False Positive.
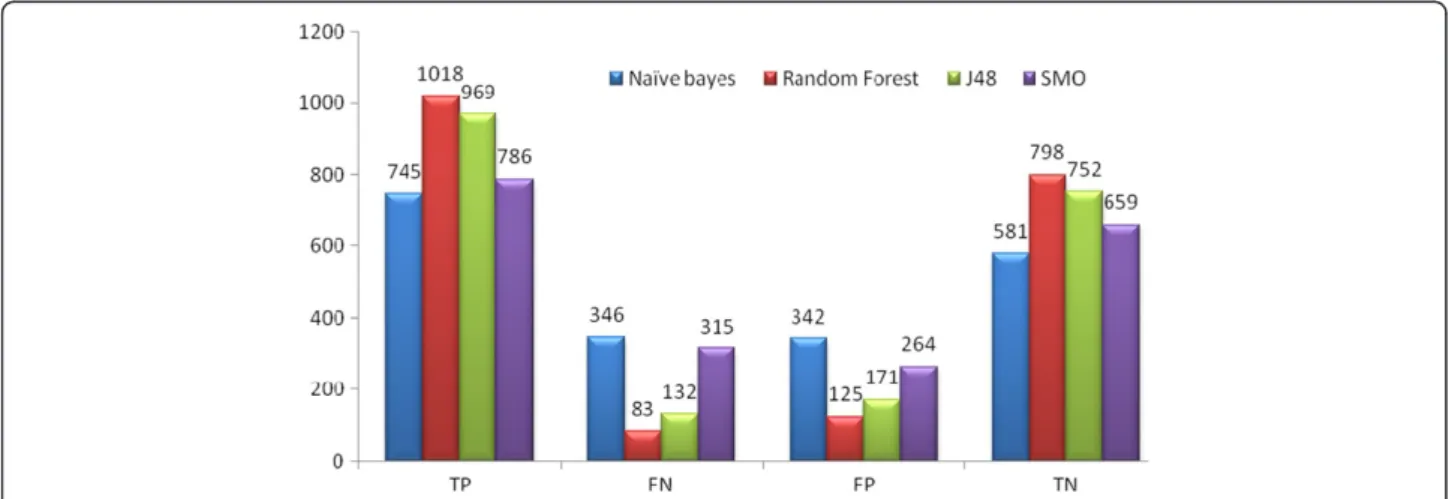
Figure 3The graph represents number of Set 3 compounds classified by TP, FN, FP and TN by Naive Bayes, Random Forest, J48 and SMO classifiers.
better in classifying compounds and for external test sets gave more accurate results than for the other two set (Tables 3 and 4). For the internal 20% test set it gave an accuracy of almost 90% and AUC ROC of 95.3%. For AID1194 it showed an accuracy of 91.9% with ROC area of 96.3%. The other classifier J48 gave an accuracy of 87%. Figure 4 mentions the number of True Positive (TP), False Positive (FP), True Negative (TN), and False Negative (FN) compounds predicted in Set 3.
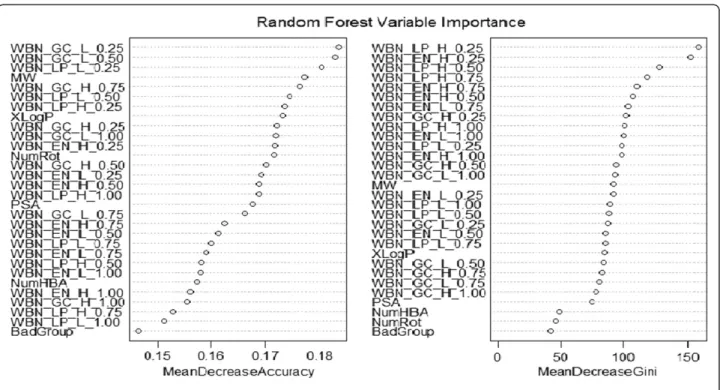
For each of the data sets modeled with Random Forest performance was much better than the other classifiers. The Random Forest model performs an implicit feature selection, using a small subset of "strong variables" for the classification only, leading to its superior perform-ance on high dimensional data. The outcome of this im-plicit feature selection of the Random Forest can be visualized by the "Gini importance". In the Figure 5, im-portant variables used in Random forest model gener-ation are represented. We also used the important variables based on Gini Importance i.e. 30 listed in the diagram to model our data sets. For all the test sets of the three sets the accuracy was in range of 79% to 84%. The variable selection using Gini importance resulted in a decrease of accuracy rate to 1% to 1.5%. Descriptor optimization is an important step while making learning models. Descriptors are often selected based on the cor-relation methodology [32] for example in Weka, a cfs
subset Eval attribute evaluator is present which selects the most uncorrelated descriptors for model generation. The Gini importance showed in the Figure 5 is another approach of variable selection which is based on in-equality among values of a frequency distribution on each split of the tree [33]. It is defined as a ratio with values between 0 and 1: the numerator is the area be-tween the Lorenz curve of the distribution and the uni-form distribution line; the denominator is the area under the uniform distribution line.
We use the models to test the 1410 approved drugs compounds and 66 withdrawn drugs and also 22080 metabolites in the ZINC database. It was assumed that the approved drug compounds would not show muta-genicity and hence, were labeled as non-mutagens. The withdrawn compounds show various pharmacological side effects and among them mutagenicity could also be an important side effect. So, the withdrawn compounds were labeled as mutagens. Among the metabolites 9523 compounds were labeled as mutagens and remaining as non-mutagens arbitrarily. We tested the compounds on the three sets with Random Forest of 100 trees. The Table 7 displays the tested compounds results.
Each model was tested with the drug data and the metabolites data. It was found that every model pre-dicted the drug data with almost the same specificity i.e. the true negatives which were labeled as non- mutagen.
Figure 4The graph represents number of Set 3 compounds classified by TP, FN, FP and TN by Naive Bayes, Random Forest, J48 and SMO classifiers.
Table 6 Result table for Set 3 with four classifier algorithms Naïve Bayes, Random Forest, J48, and SMO
Classifiers TP% FP% TN% FN% Accuracy% Precision % Recall% ROC
Naïve Bayes 66.3 28.2 71.8 33.7 68.84 69.3 68.8 75.8%
Random Forest 86.7 16.6 83.4 13.3 85.15 85.2 85.2 92.4%
J48 83.1 26 74 16.9 78.85 78.9 78.9 80.7%
SMO 76.6 34.4 65.6 29.3 71.4 71.5 71.5 78.5%
Every model predicted with almost more than 84% spe-cificity. To improve the model of prediction of true negatives we also implemented the classification with cost matrix in Weka and tested our data sets. We set the cost of false positive to 2.5 for misclassifying every non-mutagenic compound. Every data set was classified with more than 90% as true negative. The models predicted the withdrawn drugs data with low sensitivity and it predicted most of the compounds as false positives (non-mutagen). The compounds from Zinc metabolites database show very low mutagenic effects to the living systems and after testing with each model it was observed that Set 3 gave the best classification of the compounds. From 9523 mutagen compounds labeled arbitrarily, it pre-dicted 8037 compounds as false negatives (mutagens
compounds labeled predicted as non- mutagens) and 10774 compounds as True negatives (non-mutagens com-pounds labeled predicted as non-mutagens) from 12557 compounds. This indicates that 85% of the compounds in the zinc metabolite dataset are non-mutagenic.
Analysis of false positives and false negatives results
Erroneous compounds i.e. the false positives, false nega-tives were observed for the test set of Set 3, drug data sets, and metabolites. Each data set is described below.
Set 3: The test set contained 1698 compounds of which 910 compounds were classified as mutagens and 788 as non-mutagens. False Negatives (Mutagenic compounds incorrectly classified as Non-Mutagens) appeared in the test sets which resulted in 121 compounds. It was
Table 7 The drug and the metabolites data tested with Set 1, Set 2, Set 3 with random forest
Datasets True Positives False Negatives True Negative False Positives
Set1 (Drug Data) 16.7 83.3 84.6 15.4
Set1(Metabolites) 17.2 82.8 84 16
Set1(Cost sensitive classification of Drug data) 13.6 86.4 90.2 9.8
Set2 (Drug Data) 19.7 80.3 84.4 15.6
Set2 (Metabolites) 16.6 83.4 85.3 14.7
Set2 (Cost sensitive classification of Drug data) 12.3 87.7 91 9
Set3(Drug Data) 21.2 78.8 85.3 14.7
Set3 (Metabolites) 15.6 84.4 85.8 14.2
Set3 (Cost sensitive classification of Drug data) 12.1 87.9 90.8 9.2
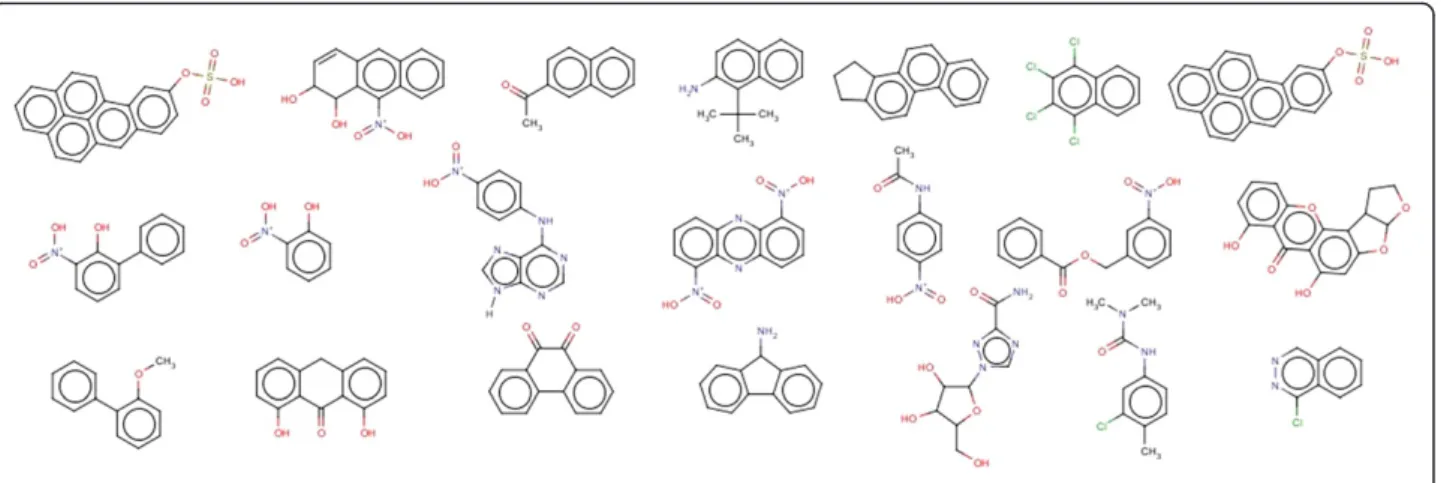
observed that compounds containing toxicophores were being classified as non-mutagens. From 121 false nega-tives, derivatives of 18 aromatic nitro groups, 9 quinoline, 7 butyl acetate, 5 cresol, 4 phenanthrene, 4 acetanilide, 3 carbinol, 3 methyl aminoethanol, 3 azo compounds were observed and the remaining were singletons. Some of the compounds are given in Figure 6. 131 false positives (non mutagenic compounds incorrectly classified as mutagenic) compounds were also predicted by the Random Forest classifier. It was observed that 14 aromatic nitro groups, 21 styrene groups, 4 anisoles, 4 benzylamines, 4 dimethy-laniline, containing compounds were predicted as muta-genic due to presence of aromatic nitro group, 3 quinolines. Additional file 4 contains the smiles and the predicted results of false positives and false negatives
of the test set. Figure 7 shows some false positive compounds.
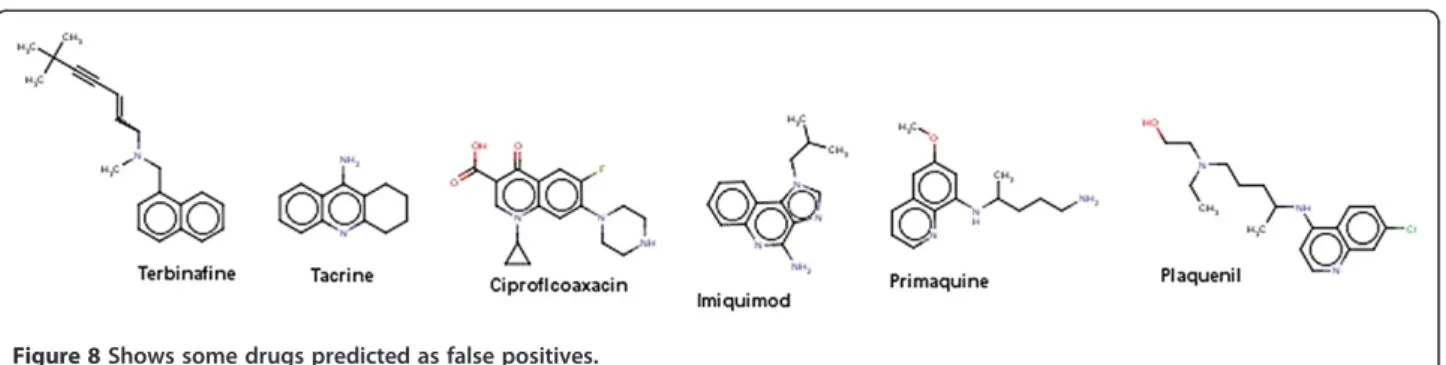
DrugBank data set: It was observed that 207 compounds where predicted as mutagens among 1410 approved drugs. It was found that compounds containing some essential toxicophores were classified as mutagenic. The structures present in the Figure 8 are drugs which are predicted as false positives. For example, Tacrine which was used to treat Alzheimer’s disease is a centrally active acetyl cholin-esterase inhibitor but it was also observed that it induces reversible increase in transaminase activity leading to hep-atic injury to 30-50% of the patients [34]. Ciprofloxacin a flourinated quinoline belonging to the class of antibiotics which includes other drugs such as the enoxacin, fleroxa-cin, norfloxafleroxa-cin, ofloxacin etc. Ciprofloxacin is associated
Figure 7Shows false positive compounds of the test sets.
with fatal liver failure [35] and also it has been associated with cases of renal failure. This drug has been predicted as false positive which indicates that the model predicted the compound which was labeled non mutagen is originally mutagenic.
Of the 66 withdrawn drugs labeled as mutagens, only 14 compounds were identified as mutagens. The drugs were withdrawn from the market due to signs of toxicity and adverse effects to humans. Side effects include hepatotox-icity, hepatitis, teratogenicity (study of human birth defects), myocardial infarction, mutagenicity and others. In the withdrawn data 52 compounds were predicted by Random Forest as non mutagens. Figure 9 shows some of the compounds which are predicted as false negatives. Additional file 5 contains smiles and the predicted results of approved and withdrawn compounds.
Metabolites data set: This data set contained 22080 compounds and around 3269 compounds were pre-dicted as mutagens. The Additional file 6 contains the
ZINC ids and smiles along with predictions of the Ran-dom Forest Set 3 classifier.
Comparison of the random forest with CAESAR
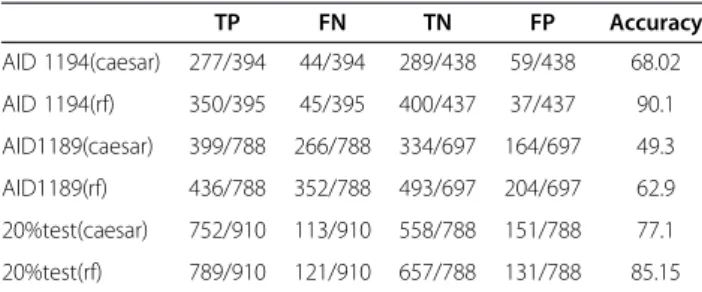
The results of the Random Forest classifier were com-pared with the standalone CAESAR mutagenicity soft-ware (v.2.0). The results are provided in the Table 8. It was observed that CAESAR was unable to predict cer-tain compounds that concer-tained ions in their structure. For the validation sets AID1194, AID 1189 and the test sets of Set 3, the total number of predicted mutagens were 394,788 and 910 respectively. The non-mutagens predicted to be were 438,697 and 788 for the above sets. The CAESAR tool is based on the structural alerts described by Ashby, Kazius et al.
[36]. The tool was unable to predict correctly
163,322,124 compounds for AID 1194, AID1189 and 20% of test set respectively in the validated datasets. The results in the table show number of classified
Figure 9Shows the withdrawn drug compounds predicted as false negative.
compounds with respect to the total number of com-pounds in each of the data sets. The comparison clearly shows that our Random Forest model performed much better than CAESAR and could even classify compounds which are not classified by the tool.
Conclusion
Previously the Benchmark data set was the largest muta-genicity data set containing more than 6000 molecules classified as mutagens and non-mutagens. In this work we were able to create a new mutagenicity data set (Set 3) containing more than 8000 compounds.
The models generated using Random Forest classifier was observed to have a high performance rate. This was proved by a higher sensitivity and specificity results for the validation sets AID1189, AID 1194. Descriptor optimization is important criteria for model generation, the use of Gini importance could play an important role in descriptor space optimization. Other than that the comparative results of descriptor based Random Forest with CAESAR (which is based on the structural alerts) clearly shows that Random Forest has the better predictive ability to classify mutagenic from non-mutagenic. Classifi-cation of the Drug data and the metabolite datasets gave us a clear view the impact of predictive models in drug de-sign and discovery. The mutagenic predictive models could make a great impact in classifying compounds in large repositories such as PubChem and ZINC which could help to accelerate the pipeline of drug discovery.
Additional files
Additional file 1:The Mutagenic training set.
Additional file 2:The Mutagenic test set.
Additional file 3:CSV format file of descriptors for External dataset drugs and metabolites.
Additional file 4:False positive and negative compounds of the test set.
Additional file 5:False positive and false negative compounds of the DrugBank approved and withdrawn drugs.
Additional file 6:Predicted metabolites from ZINC dataset.
Competing interests
The authors have no competing interests in this paper.
Authors’contributions
We would like to mention that Mr. AS and Mr. AP contributed equally to this work and are the first authors of this paper with Mr. AS being the
corresponding author s well. Dr. UCAJ, Dr. DJW, OSDD Consortium are the co-authors of this paper. Dr DJW & Dr UCAJ helped in editing the manuscript. All authors read and approved the final manuscript.
Acknowledgements
We would like to acknowledge the work of Ms. Geetha Sugumaran, Project Fellow, OSDD, CSIR for helping us in formatting and proof reading the paper. Her key inputs aided in representing the data in a comprehensive manner. We also like to thank Accelerys for providing the student edition of pipeline pilot. We would also like to acknowledge Dr. Rajarshi Guha for discussion of the paper. We thank the reviewers for their time and valuable suggestions on the paper.
Author details
1Indiana University Bloomington School of Informatics and Computing,
Bloomington, USA.2Open Source Drug Discovery, Council of Scientific and Industrial Research, New Delhi, India.3Department of Cheminformatics,
Malabar Christian College, Kerala, India.
Received: 28 December 2011 Accepted: 3 April 2012 Published: 15 May 2012
References
1. van Ravenzwaay B, Herold M, Kamp H, Kapp MD, Fabian E, Looser R, Krennrich G, Mellert W, Prokoudine A, Strauss V, Walk T, Wiemer J: Metabolomics: A tool for early detection of toxicological effects and an opportunity for biology based grouping of chemicals-From QSAR to QBAR.Mutat Res2012, [In Press].
2. Ames B:The detection of environmental mutagens and potential.Cancer 1984,53:2030–2040.
3. Mortelmans K, Zeiger E:The ames salmonella/microsome mutagenicity assay.Mutat Res2000,455(1–2):29–60.
4. Kazius J, McGuire J, Bursi R:Derivation and validation of toxicophores for mutagenicity prediction.J Med Chem2005,48(1):312–320.
5. Helma C, Cramer T, Kramer S, Raedt L:Data mining and machine learning techniques for the identification of mutagenicity inducing substructures and structure activity relationships of noncongeneric compounds.J Chem Inf Comput Sci2004,44:1402–1411.
6. Hansen K, Mika S, Schroeter T, Sutter A, Laak A, Hartmann ST, Heinrich N, MullerK P:Benchmark data set for in-silico prediction of ames mutagenicity.J Chem Inf Model2009,49:2077–2081.
7. Zhang QZ, Aires-de-Sousa J:Random forest prediction of mutagenicity from empirical physicochemical descriptors.J Chem Inf Model2007,47:1–8. 8. Feng J, Lurati L, Ouyang H, Robinson T, Wang Y, Yuan S, Young SS:
Predictive toxicology: benchmarking molecular descriptors and statistical methods.J Chem Inf Comput Sci2003,43:1463–1470.
9. King RD, Muggletont SH, Srinivasani A, Sternberg MJE:Structure-activity relationships derived by machine learning: the use of atoms and their bond connectivities to predict mutagenicity by inductive logic programming.Proc Natl Acad Sci1996,93:438–442.
10. Judson R, Elloumi F, Setzer RW, Li Z, Shah I:A comparison of machine learning algorithms for chemical toxicity classification using a simulated multi-scale data model.BMC Bioinf2008,:9–241.
11. Ferrari T, Gini G:An open source multistep model to predict mutagenicity from statistical analysis and relevant structural alerts.Chem Cent J2010, 4(Suppl 1):S2.
12. Benfenati E:The CAESAR project forin silicomodels for the REACH legislation.Chem Central J2010, 4(Suppl 1):I1.
13. Votano JR, Parham M, Hall LH, Kier LB, Oloff S, Tropsha A, Xie QA, Tong W: Three new consensus QSAR models for the prediction of ames genotoxicity.Mutagenesis2004,19:365–377.
14. Ashby J, Tennant RW:Chemical structure, salmonella mutagenicity and extent of carcinogenicity as indicators of genotoxic carcinogenesis among 222 chemicals tested in rodents by the U.S. NCI/NTP.Mutat Res 1988,204(1):17–115.
Table 8 Comparison of Caesar with Random Forest (rf) with the validation sets depicting True Positives (TP), False Negatives (FN), True Negatives (TN), False Positives (FP) and Accuracy
TP FN TN FP Accuracy
AID 1194(caesar) 277/394 44/394 289/438 59/438 68.02
AID 1194(rf) 350/395 45/395 400/437 37/437 90.1
AID1189(caesar) 399/788 266/788 334/697 164/697 49.3
AID1189(rf) 436/788 352/788 493/697 204/697 62.9
20%test(caesar) 752/910 113/910 558/788 151/788 77.1
15. Hakimelahi GH, Khodarahmi GA:The Identification of Toxicophores for the Prediction of Mutagenicity Hepatotoxicity and Cardiotoxicity.J Iran Chem Soc2005,2:244–267.
16. Blagg J:Structure activity relationships for in vitro and in vivo toxicity. Annu R Med Chem2006,41:353–358.
17. Bongsup PC, Beland FA, Marques FM:NMR structural studies of a 15-mer DNA sequence from a rasprotooncogene modified at the first base of codon 61 with the carcinogen 4 -aminobiphenyl.Biochemistry1992, 31(40):9587–9602.
18. Li J, Dierkes P,Gutsell S, Stott I:Assessing different classifiers for in-silico prediction of ames test mutagenicity. Ina poster in the 4thJoint Sheffield Conference on Chemoinformatics: 2007.
19. Knox C, Law V, Jewison T, Liu P, Ly S, Frolkis A, Pon A, Banco K, Mak C, Neveu V, Djoumbou Y, Eisner R, Guo AC, Guo AC, Wishart DS:DrugBank 3.0: a comprehensive resource for 'omics' research on drugs.Nucleic Acids Res2011,39:D1035–D1041.
20. Irwin J, Shoichet B:Zinc–a free database of commercially available compounds for virtual screening.J Chem Inf Model2005,45(1):177–182. 21. Accelrys, Inc., 10188 Telesis Court, Suite 100, San Diego, CA. URL:
[http://accelrys.com/products/pipeline-pilot/]
22. Gold LS, Slone TH, Ames BN, Manley NB, Garfinkel GB, Rohrbach L: Carcinogenic Potency Database. In Handbook of Carcinogenic Potency and Genotoxicity Databases. Boca Raton: CRC Press; 1997:1–605.
23. Liu K, Feng J, Young SS, Power MV:A Software Environment for Molecular Viewing, Descriptor Generation, Data Analysis and Hit Evaluation.J Chem Inf Model2005,45(2):515–522.
24. Burden FR:Molecular identification number for substructure searches. J Chem Inf Comput Sci1989,29:225–227.
25. Schierz AC:Virtual screening of bioassay data.J Cheminformatics2009, 1:21.
26. [http://www.cs.waikato.ac.nz/ml/weka/index.html]
27. Friedman N, Geiger D, Goldszmidt M:Bayesian network classifiers.Mach Learn1997,29:131–163.
28. Keerthi S, Gilbert E:Convergence of a generalized SMO algorithm for SVM classifier design.Mach Learn2002,46:351–360.
29. Murthy A:Automatic construction of decision trees from data: a multi-disciplinary survey.Data Min Knowledge Discovery1998,2:345–389. 30. Dietterich TG:An experimental comparison of three methods for constructing ensembles of decision trees: bagging, boosting, and randomization.Mach Learn2000,40:139–157.
31. Ehrman TM, Barlow DJ, Hylands J, 2:Virtual Screening of Chinese Herbs with Random Forest.J ChemInf Model2007,47:264–278.
32. Singla D, Anurag M, Dash D, Raghava G:A web server for predicting inhibitors against bacterial target GlmU protein.BMCPharmacol2011, 11:5.
33. Menze BH, Kelm BM, Masuch R, Himmelreich U, Bachert P, Petrich W:A comparison of Random Forest and its Gini importance with standard chemometric methods for the feature selection and classification of spectral data.BMC Bioinforma2009,10:213.
34. Lagadic D, Rissel M, Le Bot MA:Guillouzo toxic effects of tacrine on primary hepatocytes and liver epithelial cells in culture.Cell Biol Toxicol 1998,14:5361–5373.
35. Fuchs S, Simon Z, Brezis M:Fatal hepatic failure associated with ciprofloxacin.Lancet1994,242:738–739.
36. Ashby J:Fundamental structural alerts to potential carcinogenicity or non carcinogenicity.Environ Mutagen1985,7:919–921.
doi:10.1186/1758-2946-4-10
Cite this article as:Sealet al.:In-silico predictive mutagenicity model generation using supervised learning approaches.Journal of
Cheminformatics20124:10. Open access provides opportunities to our
colleagues in other parts of the globe, by allowing anyone to view the content free of charge.
Publish with
Chemistry
Central and every
scientist can read your work free of charge
W. Jeffery Hurst, The Hershey Company.
available free of charge to the entire scientific community peer reviewed and published immediately upon acceptance cited in PubMed and archived on PubMed Central yours you keep the copyright
Submit your manuscript here: