AUSTRALIAN JOURNAL OF BASIC AND
Open Access Journal
Published BY AENSI Publication
© 2016 AENSI Publisher All rights reserved
This work is licensed under the Creative Commons Attribution International License (CC BY). http://creativecommons.org/licenses/by/4.0/
To Cite This Article: Balaji A, S. Sendhilkumar, G.S. Mahalakshmi Average Semantic Filters. Aust. J. Basic & Appl. Sci.,
Progressive Path Analysis using Optimized Discrete and Continuous
Average Semantic Filters
1Balaji A, 2S. Sendhilkumar, 3G.S. Mahalakshmi
1Department of Computer Science and Engineering, KCG College of Technology, Karappakam, Chennai 600097, 2Department of Information Science and Technology, College of Engineering Guindy, Anna University, Chennai 600025 3
Department of Computer Science & Engineering,College of Engineering Guindy, Anna University, Chennai 600025,
Address For Correspondence:
Balaji A,Department of Computer Science and Engineering, KCG College of Technology, Karappakam, Chen E-mail: [email protected]
A R T I C L E I N F O Article history:
Received 04 December 2015 Accepted 22 January 2016 Available online 14 February 2016
Keywords: Power graphs,
Work Progress trajectory, Research Progress Analysis
The ultimate aim of any research work is for the work to be carried out by many other researchers or the same author by bringing in similar kind of new
of the proposed idea or by applying the idea in a different domain. For this we propose an idea to track the work progress of the research field through text mining. We also analyze the co
research works to avoid leaving out any significant works of the past. In this work, we employ various
work progress which is further used to trace the
to trace the development trajectory of a particular research paper by application of semantic document analysis techniques. The study provides valuable information for academic researchers an
development trajectory of any given research paper. It incorporates the integrated main path analysis approach, with which it helps to view the true path in which the research idea said in the seed research paper has progressed. It gives the valid citations of the paper that have really carried out the research paper work in future. For this, we have utilized power graphs to represent the multitude of information contained in the citation trajectories. The use of power graph
any loss of information. The outcome of the study shows both most significant and last significant work progress graph of the research paper. In summary, the proposed work is target
in identifying, (i) most progressive research happened so far, (ii) optimized methods to find progressive research path.
Background And Related Work:
AUSTRALIAN JOURNAL OF BASIC AND
APPLIED SCIENCES
ISSN:1991-8178 EISSN: 2309-8414 Journal home page: www.ajbasweb.com
© 2016 AENSI Publisher All rights reserved
Creative Commons Attribution International License (CC BY). http://creativecommons.org/licenses/by/4.0/
Balaji A, S. Sendhilkumar, G.S. Mahalakshmi, Progressive Path Analysis using Optimized Discrete and Continuous Aust. J. Basic & Appl. Sci., 10(2): 224-233, 2016
Progressive Path Analysis using Optimized Discrete and Continuous
Average Semantic Filters
G.S. Mahalakshmi
Department of Computer Science and Engineering, KCG College of Technology, Karappakam, Chennai 600097, Department of Information Science and Technology, College of Engineering Guindy, Anna University, Chennai 600025 Department of Computer Science & Engineering,College of Engineering Guindy, Anna University, Chennai 600025,
Balaji A,Department of Computer Science and Engineering, KCG College of Technology, Karappakam, Chennai 600097, Tamilnadu, India.
A B S T R A C T
Research progress analysis is most promising research which fits to any research disciplines. Analyzing the progressive research trajectories leads to understanding the overall research contributing in a particular direction. This paper
interesting problem of tracking the progressive research path of scientific publications using derived semantic measures across citation networks
INTRODUCTION
The ultimate aim of any research work is for the work to be carried out by many other researchers or the same author by bringing in similar kind of new approaches or proposing additional concepts or as an extension of the proposed idea or by applying the idea in a different domain. For this we propose an idea to track the work progress of the research field through text mining. We also analyze the co-citations and cross
research works to avoid leaving out any significant works of the past.
In this work, we employ various bibliometric methods to analyse and track the most significant paths of work progress which is further used to trace the developing trajectory of a research paper. Our main objective is to trace the development trajectory of a particular research paper by application of semantic document analysis techniques. The study provides valuable information for academic researchers and scholars to gain insights into development trajectory of any given research paper. It incorporates the integrated main path analysis approach, with which it helps to view the true path in which the research idea said in the seed research paper has ssed. It gives the valid citations of the paper that have really carried out the research paper work in future. For this, we have utilized power graphs to represent the multitude of information contained in the citation trajectories. The use of power graphs also contribute to dimensionality reduction of citation networks without any loss of information. The outcome of the study shows both most significant and last significant work progress graph of the research paper. In summary, the proposed work is targeted towards deliverables that help in identifying, (i) most progressive research happened so far, (ii) optimized methods to find progressive research
Progressive Path Analysis using Optimized Discrete and Continuous
Progressive Path Analysis using Optimized Discrete and Continuous
Department of Computer Science and Engineering, KCG College of Technology, Karappakam, Chennai 600097, Tamilnadu, India Department of Information Science and Technology, College of Engineering Guindy, Anna University, Chennai 600025,Tamilnadu, India Department of Computer Science & Engineering,College of Engineering Guindy, Anna University, Chennai 600025, Tamilnadu, India
nai 600097, Tamilnadu, India.
Research progress analysis is most promising research which fits to any research disciplines. Analyzing the progressive research trajectories leads to understanding the overall research contributing in a particular direction. This paper discusses an interesting problem of tracking the progressive research path of scientific publications
The ultimate aim of any research work is for the work to be carried out by many other researchers or the approaches or proposing additional concepts or as an extension of the proposed idea or by applying the idea in a different domain. For this we propose an idea to track the work tions and cross-citations among
a larger sample the citation network of the centrality productivity literature and later to the social network analysis field (Hummon et al., 1993) as well as to the conflict-resolution field (Carley et al., 1993). Methodologically, Batagelj [3] proposed a major advancement of the method, enhancing main path analysis by offering efficient algorithms for determining various versions of the significance index.
Verspagen [18] traced the development trajectories of fuel cell technology using patent citation data. Mina
et al., (2007) discovered the growth and transformation of coronary artery disease treatment using both
bibliographic and patent citation data. Carlero-Medina and Noyons(2008) studied the development path of the absorptive capacity research field. Lucio-Arias and Leydesdorff(2008) combined main path analysis with HistCite and path-dependent transitions methods in the study of fullerenes and nanotube technology. Harris et
al. (2009) examined the discovery and delivery literature in secondhand smoke by applying the main path
analysis.
More recent studies using the method include those on the development path of data envelopment analysis and on the research history of the ethics of nanotechnology (Lu 2012). There is another work on exploring technological development trajectories (2007)by analyzing various main paths on the patent data and built the citation network.
In 2001, many communication and social networks that have power-law link distributions, containing a few nodes that have a very high degree and many with low degree were discussed byAdamic et al (2001). This heterogeneity of high connectivity nodes play the important role of hubs in communication and networking, a fact that can be exploited when designing efficient search algorithms. They introduce a number of local search strategies that utilize high degree nodes in power-law graphs and that have costs scaling sub linearly with the size of the graph.
In 2009, attribute reduction was found to be one of important issues in rough sets (Chen et al., 2009). This paper proposed power graphs and which were then a new knowledge representation strategies for effective representation of network data. Top-down and bottom-up search algorithms on power graph were also proposed, which can translate the well-known computing problem of attribute reduction into a significant search problem using power graphs. Remarkably the algorithms provided a new method in attribute reduction and the efficiency of the method has been proved in theoretical analysis. The main objective was to provide a novel knowledge representation for attribute reduction question.
Analyzing Research Progress Trajectories:
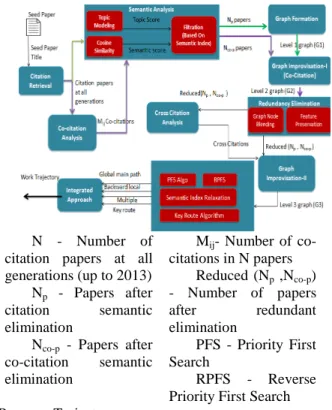
The complete flow of events for the Research progress analysis is shown in Fig. 1. The construction of power graphs proposed in (2013) is explained in detail in this section. The seed papers that were considered for analysis is shown in Table I.
Table 1: Seed Publication considered under various Domains
Paper Title Domain Citation Count
Hirsch, J.E. “An Index to Quantify an Individual’s Scientific Research Output” 2005 PNAS (2005)
Text Mining 2706
Semantic Analysis with Filtration:
N - Number of citation papers at all generations (up to 2013) Np - Papers after
citation semantic
elimination
Nco-p - Papers after
co-citation semantic
elimination
Mij- Number of
co-citations in N papers Reduced (Np ,Nco-p)
- Number of papers
after redundant
elimination
PFS - Priority First Search
RPFS - Reverse Priority First Search
Fig. 1: Analysis of Research Progress Trajectory
Co- Citation Analysis:
We find the co-citations of papers and trace all possible co-citations using CiteSeer. Co-citations are denoted as Mij, where i is a co-citation to j, i= 1 to n, j=1 to k where k is the no of co-citations in Ni. For all the
co-citation papers, we perform semantic analysis for filtration The set of co-citation papers that are preserved after elimination is notated by Nco-p.
Redundancy Elimination:
The papers which are present in N and not present in Npand have again appeared in Nco-p are the key papers
to be considered for whose features have to be preserved. This redundancy elimination and feature preservation would result in papers referred as Reduced (Np, Nco-p ). For this set of papers, cross citation analysis has to be
performed.
Cross- Citation Analysis:
In cross-citation analysis (Mahalakshmi et al., 2013), we use two level features for clustering, one, the list of keywords suggested in the paper explicitly and the other, collection of topics modeled via topic modeling. In each cluster the new citation links between the papers are found and this results in an increase of edges in graph (G2), which leads to the graph (G3).
Graph Formation:
The graph is formed by considering the seed paper as the root node with the citation papers Np as the child
nodes with directed edges indicating the citation relationship with the seed paper. The edges also carry the semantic score index (section 3.1) as weight. We form an acyclic graph that has directed edges and is devoid of cycles, initially to start the graph formation process.
Step 1: Forming Directed Acyclic Graphs (DAG’s):
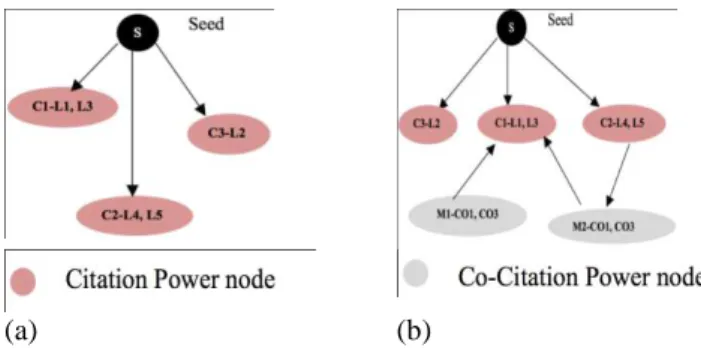
The citations of the seed paper across all generations are represented using directed acyclic graphs. Constructing DAGs ensures there are no cycles within the graphs (Mahalakshmi et al., 2013). Consider C1, C2, C3 to be the citation papers of the seed paper, S. Let C1 be present at levels L1, L3 and C2 to be present in levels L4 and L5.Let C3 belong to level L2.These are represented in DAG using 5 citation nodes and a seed paper node. We call this graph, say G1 (refer Fig. 3a).
Step 2: Converting to Power Graphs:
because it offers greater parallelism, reduces network communication and provides a new highly effective approach to distributed graph placement.
(a) (b)
Fig. 2: a) Power Graph Representation of G1. b) Power graph representation of G3
Step 3: Bringing in Co-citations:
The co-citations for the graph G1 is also brought into the graph. Since this involves increase in number of nodes, the co-citation information is also blended within the power nodes. If M1 and M2 are co-citations of C1, 2 co-citation nodes are to be added to G1. But this co-citation information is blended in C1 power node thus bringing in co-citation information without adding further nodes. We call this graph as G2 (refer Fig. 3b).
Step 4: Adding Cross Citations:
The citations that are present between various clusters are analyzed in cross citation analysis. Suppose if C1 belongs to network cluster and C2 in software engineering cluster. The citations between them are analyzed after clustering the citation papers. After bringing cross citation information in G2, we call the final graph as G3 (refer Fig. 3c).
(a) (b)
(c)
Fig. 3: a) DAG – G1. b) G2 (G1 with co-citations). c) G3 (G2 with cross-citations)
Integrated Approach:
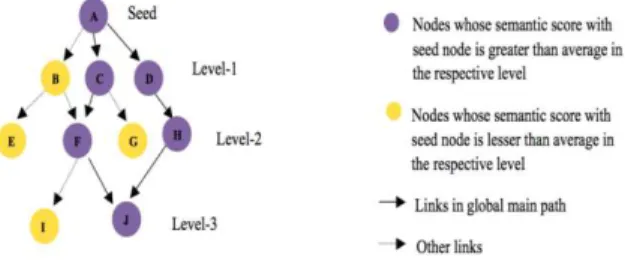
Fig. 4: Sample Graph using Global Main Path
The global main path searches forward from the source to the sinks and is traced using Priority First Search. Consider a sample graph (refer Fig. 4) which contains node A as seed node, nodes B, C and D in level-1(depth=1), nodes E, F, G and H in level-2(depth=2), and nodes I and J in level-3(depth=3). Suppose the nodes C and D in level-1 have a semantic score higher than the average semantic score of level-1, then the paths through C and D are considered. Now in level-2 the nodes F and H are traversed as they have a semantic score higher than the average. Similarly in level-3, node J has a higher semantic score than the average of level-3. Thus we get two global main paths namely A-C-F-J and A-D-H-J.
For Backward Local Main Path, the semantic scores of the papers involved are traced in reverse order. Multiple Main Path approach uses Semantic Index Relaxation (SRI). At every level we find the average semantic score of all nodes. By relaxing the threshold value we consider all the nodes that are higher than the threshold value. Using the Key Route Algorithm we take the most significant link and begin a search from the key rather than from the source or sink.
Ranking and Optimisation of Semantic Research Paths:
The paths obtained in integrated approach are ranked based on the following criteria:
• Length of Path: More length indicates more frequently the works are carried out.
• Popularity: Significant idea attracts more works, hence good work progress (through citation count). The citation counts for all the nodes in a path are added and the average is taken as popularity score.
• Relevancy Score: Average of similarity scores of nodes in a path with respect to the seed paper, gives
relevancy score which indicates more relevant work progress.
Algorithm 1:
Progressive Path Analysis
Input: G3 paths Output: Progressive path
1) Find the longest path length.
2) Obtain the popularity score for every node. 3) Determine the relevancy count for every node. 4) Sort the paths according to the values obtained.
5) Rank the paths based on length, popularity and relevancy count.
Ranking paths (refer Algorithm 1) lead us to derive the significant deliverables of the overall system. The country details of the papers are obtained and whichever country has contributed more papers is considered to be the best work contributing country in that particular domain. To find the parallel research work carried on during a particular time period, after redundancy elimination, the new co-citation nodes are to be added to the graph G1. These nodes are linked by the citation nodes, which existed already in G1 and are cited by the co-nodes in G2. Hence, if a co-citation paper has passed the similarity filtration phase but the citation papers that resulted in bringing the co-citation paper have got filtered, and if these papers are on the same timeline (say, publication year), then these co-citation papers are considered to be parallel works.
The paths found in the graph G3 are quite large in number. In order to improve the quality of the paths found in G3 we propose three optimization approaches. Each approach adds different filtration factors over the ranked set of semantic research paths which helps us to obtain varied results.
Optimization Approach using Discrete Average Semantic Score Filtration (DASS):
4) Determine the paths for the filtered nodes that offers better semantic match between the papers in the path and reduction in the number of paths between any nodes.
Fig. 5: Optimization Approach using DASS
Consider a sample graph (refer Fig. 6) which contains node A as seed node, nodes B and C in level 1(depth=1), nodes D, E, F in
level-semantic score of B and C are taken. The node C has higher level-semantic score than level retained whereas the node B is filtered. Similarly in level
semantic score than level-2 and level
analyzing through the retained nodes, we obtain a path A optimization approach using DASS.
Fig. 6: Sample Graph using Optimization Approach using DASS
Backward Paths for Optimization Approach using DASS
In this approach (refer Algorithm 3), the cosine similarity value is taken for all nodes in the graph with respect to the leaf node instead of the seed node. Then we do edge reversal for all the edges in the graph G3. The same procedure for optimization approach
in each level with respect to the leaf node is taken and this val
the nodes whose semantic score is greater than the threshold value are retained. From the set of retained nodes, we trace the paths backwards from leaf nodes to seed node. The paths determined using this app
forward approach through optimization approach
Algorithm 3: Backward Paths for Optimization Approach using DASS Input: G3 paths Output: Optimized path I
1) Consider the nodes that are retai
2) For these nodes find the semantic score comparing it with the leaf node.
3) Take the nodes whose cosine similarity value between the leaf paper and the other papers at all levels are greater than the average semantic score val
4) Trace the path backwards from leaf to seed node.
Fig. 7: Sample Graph for Backward Paths using Optimization Approach using DASS
Determine the paths for the filtered nodes that offers better semantic match between the papers in the tion in the number of paths between any nodes.
Optimization Approach using DASS
Consider a sample graph (refer Fig. 6) which contains node A as seed node, nodes B and C in level -2(depth=2), and nodes G and H in level-3(depth=3).In level
semantic score of B and C are taken. The node C has higher semantic score than level-1’s average so node C is retained whereas the node B is filtered. Similarly in level-2 and level-3, the nodes E and H are having
2 and level-3’s average values. Hence the nodes D, F and G are filtered. When analyzing through the retained nodes, we obtain a path A-C-E-H, which is said to be the optimum path using optimization approach using DASS.
Sample Graph using Optimization Approach using DASS
Backward Paths for Optimization Approach using DASS:
In this approach (refer Algorithm 3), the cosine similarity value is taken for all nodes in the graph with the seed node. Then we do edge reversal for all the edges in the graph G3. The same procedure for optimization approach-I is applied here. The average of the semantic score of all the nodes in each level with respect to the leaf node is taken and this value is considered to be the threshold value. Only the nodes whose semantic score is greater than the threshold value are retained. From the set of retained nodes, we trace the paths backwards from leaf nodes to seed node. The paths determined using this app
forward approach through optimization approach-I imply the goodness of the path obtained.
Algorithm 3: Backward Paths for Optimization Approach using DASS:
Optimized path I - backward
Consider the nodes that are retained in optimization approach I.
For these nodes find the semantic score comparing it with the leaf node.
Take the nodes whose cosine similarity value between the leaf paper and the other papers at all levels are greater than the average semantic score value.
Trace the path backwards from leaf to seed node.
Sample Graph for Backward Paths using Optimization Approach using DASS
Determine the paths for the filtered nodes that offers better semantic match between the papers in the
Consider a sample graph (refer Fig. 6) which contains node A as seed node, nodes B and C in level-3(depth=3).In level-1, the average
1’s average so node C is 3, the nodes E and H are having higher 3’s average values. Hence the nodes D, F and G are filtered. When H, which is said to be the optimum path using
In this approach (refer Algorithm 3), the cosine similarity value is taken for all nodes in the graph with the seed node. Then we do edge reversal for all the edges in the graph G3. The I is applied here. The average of the semantic score of all the nodes ue is considered to be the threshold value. Only the nodes whose semantic score is greater than the threshold value are retained. From the set of retained nodes, we trace the paths backwards from leaf nodes to seed node. The paths determined using this approach and the
I imply the goodness of the path obtained.
Consider a sample graph (refer Fig. 7), which contains node A as seed node, nodes B, C, D in level 1(depth=1), nodes E, F, G, H in level
the leaf node as the node J. The cosine simil
and the average semantic score is taken as overall threshold value. In level semantic score greater than threshold value and are hence retained whereas node
in level-1 nodes C and D are retained and node B is filtered. From the set of retained nodes we traverse the paths backward from leaf to seed node, if seed node is also retained when seed’s semantic score is greater than threshold with respect to leaf node. Thus the backward paths are J
forward path in reverse order, then the forward path is said to be backward optimum.
Optimization Approach using Continuous Average Semantic Score
From the graph (G3), we arrange the nodes of the graph level wise based on the depth value from the seed node. In this approach, the cosine similarity value between the seed node and the respective nodes in the first level is determined. Then we find the average of semantic scores of all nodes at first level alone and the first level’s average semantic score value is taken as threshold and the nodes whose semantic score is greater than the average are only retained in first level. For the
corresponding second level nodes and for those nodes alone, average semantic score threshold based filtration is done. For these retained nodes in second level we proceed for third level and fi
only. This process proceeds for all levels. From this approach we obtain paths that survive this multilevel filtration (refer Fig. 8 & Algorithm 4).
Algorithm 4: Optimization Approach using CASS Input: G3 paths Output: Optimized path II
1) Determine the semantic score for each node in the graph using the cosine similarity algorithm in comparison with the seed paper.
2) Consider the nodes in each level separately and calculate the semantic score average for every level.
3) Retain the nodes whose semantic score are above each level’s average.
4) Determine the paths for all the retained nodes.
Fig. 8: Optimization Approach using CASS
Consider a sample graph (Fig. 9), which contains node A as seed node, nodes B and C in nodes D, E, F in level-2(depth=2), and nodes G and H in level
of B and C are taken. The node C has higher semantic score than level whereas the node B is filtered. In level
higher value than threshold is retained. Node D is ignored since its parent node B got filtered in first level itself. In level-3, nodes G and H are considered since t
H, H passes the filtration phase to give the optimum path as A
Fig. 9: Sample Graph using Optimization Approach using CASS
Data Set:
The seed paper for which we find the work progress trajectory is Hirsch, J.E. “An Index to Quantify an Individual’s Scientific Research Output”, 2005, PNAS which has 2706 citations at the first generation. Table II shows the total citations and the available citations for
Consider a sample graph (refer Fig. 7), which contains node A as seed node, nodes B, C, D in level 1(depth=1), nodes E, F, G, H in level-2(depth=2), and nodes I and J in level-3(depth=3).In level
the leaf node as the node J. The cosine similarity value for all the nodes is determined with respect to leaf node J and the average semantic score is taken as overall threshold value. In level-2, nodes F and H are having semantic score greater than threshold value and are hence retained whereas nodes E and G are filtered. Similarly 1 nodes C and D are retained and node B is filtered. From the set of retained nodes we traverse the paths backward from leaf to seed node, if seed node is also retained when seed’s semantic score is greater than hreshold with respect to leaf node. Thus the backward paths are J-H-D-A and J-F-C-A. If we obtain the same forward path in reverse order, then the forward path is said to be backward optimum.
Optimization Approach using Continuous Average Semantic Score Filtration (CASS):
From the graph (G3), we arrange the nodes of the graph level wise based on the depth value from the seed node. In this approach, the cosine similarity value between the seed node and the respective nodes in the first Then we find the average of semantic scores of all nodes at first level alone and the first level’s average semantic score value is taken as threshold and the nodes whose semantic score is greater than the average are only retained in first level. For the set of retained nodes alone in first level, we consider their corresponding second level nodes and for those nodes alone, average semantic score threshold based filtration is done. For these retained nodes in second level we proceed for third level and filtration is done for those nodes only. This process proceeds for all levels. From this approach we obtain paths that survive this multilevel filtration (refer Fig. 8 & Algorithm 4).
Algorithm 4: Optimization Approach using CASS:
ptimized path II
Determine the semantic score for each node in the graph using the cosine similarity algorithm in
Consider the nodes in each level separately and calculate the semantic score average for every level. he nodes whose semantic score are above each level’s average.
Determine the paths for all the retained nodes.
Optimization Approach using CASS
Consider a sample graph (Fig. 9), which contains node A as seed node, nodes B and C in
2(depth=2), and nodes G and H in level-3(depth=3).In level-1, the average semantic score of B and C are taken. The node C has higher semantic score than level-1’s average so node C is retained filtered. In level-2 average semantic score of E and F are only considered and E, having higher value than threshold is retained. Node D is ignored since its parent node B got filtered in first level itself. 3, nodes G and H are considered since their parent node E alone is retained in that level. Between G and H, H passes the filtration phase to give the optimum path as A-C-E-H.
Sample Graph using Optimization Approach using CASS
RESULTS AND DISCUSSION
which we find the work progress trajectory is Hirsch, J.E. “An Index to Quantify an Individual’s Scientific Research Output”, 2005, PNAS which has 2706 citations at the first generation. Table II shows the total citations and the available citations for the first and second generations.
Consider a sample graph (refer Fig. 7), which contains node A as seed node, nodes B, C, D in level-3(depth=3).In level-3, we consider arity value for all the nodes is determined with respect to leaf node J 2, nodes F and H are having s E and G are filtered. Similarly 1 nodes C and D are retained and node B is filtered. From the set of retained nodes we traverse the paths backward from leaf to seed node, if seed node is also retained when seed’s semantic score is greater than A. If we obtain the same
From the graph (G3), we arrange the nodes of the graph level wise based on the depth value from the seed node. In this approach, the cosine similarity value between the seed node and the respective nodes in the first Then we find the average of semantic scores of all nodes at first level alone and the first level’s average semantic score value is taken as threshold and the nodes whose semantic score is greater than the set of retained nodes alone in first level, we consider their corresponding second level nodes and for those nodes alone, average semantic score threshold based filtration is ltration is done for those nodes only. This process proceeds for all levels. From this approach we obtain paths that survive this multilevel
Determine the semantic score for each node in the graph using the cosine similarity algorithm in
Consider the nodes in each level separately and calculate the semantic score average for every level.
Consider a sample graph (Fig. 9), which contains node A as seed node, nodes B and C in level-1(depth=1), 1, the average semantic score 1’s average so node C is retained 2 average semantic score of E and F are only considered and E, having higher value than threshold is retained. Node D is ignored since its parent node B got filtered in first level itself. heir parent node E alone is retained in that level. Between G and
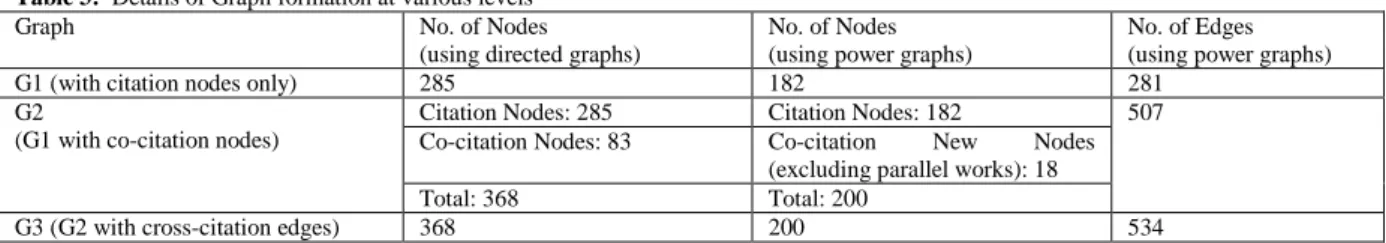
The number of edges in every graph is also determined. For G1 we consider breadth first search for level 1 using DAG and depth first search for level 1 using power graphs.
Table 3: Details of Graph formation at various levels
Graph No. of Nodes
(using directed graphs)
No. of Nodes (using power graphs)
No. of Edges (using power graphs)
G1 (with citation nodes only) 285 182 281
G2
(G1 with co-citation nodes)
Citation Nodes: 285 Citation Nodes: 182 507
Co-citation Nodes: 83 Co-citation New Nodes (excluding parallel works): 18
Total: 368 Total: 200
G3 (G2 with cross-citation edges) 368 200 534
Path Analysis:
Refer Table IV for the input and output path details for Global Main Path, Backward Local Main Path and Key Route Main Path Approach.
Table 4: Path details for Global, Backward Local and Key Route Main Path Analysis
Paths Global Main Path Backward Local Main Path Key Route Main Path
Input Seed Paper, Leaf Node Seed Paper, Leaf Node Key Node, Any Node
Output Paths from Seed Paper to Leaf Node
Paths from Leaf Node to Seed Paper Paths from Key Node to Any Node
Analyzing Optimization Approaches:
We evaluate the results for accuracy based on the validity of paths, which is discussed below for each approach. The paths obtained using backward and forward approach through optimization using DASS implies the goodness of the approach. These nodes have very high semantic score ranging from 0.4 to 0.5 but low popularity. Generally if a node occurs in any level it is considered as a part of the path. But for the backward approach in optimization using DASS, consider the path Q2 (Refer table V). We have node 209 which did not occur in any of the levels but it got included in the path because this node has been co-cited by some other node. This implies that the node got included due to parallel work. Thus in spite of including co-citations the dimensionality reduction was good. In path Q1 (Refer table V), node 056 is a level paper with no co-citee and has no popularity as well. Hence in this case we check if the level is a leaf level or not. Here node 056 is in the leaf level and we trace the path backwards from node 056.
In optimization using CASS, we obtained path R1 (Refer table V), whose nodes occur in many levels and are co-citations of other nodes as well. Here we evolve a path from 2005 to 2013 that is a narrow and ideal path as the features of the nodes such as co-citee and levels are ideally close. Therefore this infers that these nodes are good papers and many people are following the work.
Table 5: Paths after using Optimization Approaches
Reference Path No. Path Description Ranking Based on
Relevancy
Ranking Based on Popularity
P
1 000-198-209-102-056 1 17
2 000-198-209-102-097-056 2 2
3 000-209-102-056 3 10
4 000-198-209-102-107-056 4 23
5 000-198-209-102-107-097-056 5 26
6 000-198-209-107-056 6 16
7 000-209-102-097-056 7 20
8 000-209-102-107-056 8 19
9 000-198-209-107-097-056 9 22
10 000-209-102-107-097-056 10 25
11 000-056 11 1
12 000-209-107-056 12 9
13 000-095-056 13 4
14 000-206-095-056 14 13
15 000-097-056 15 3
16 000-206-096-056 16 12
17 000-209-107-097-056 17 18
19 000-206-096-097-056 19 21
20 000-096-097-056 20 11
21 000-194-095-056 21 8
22 000-194-097-056 22 7
23 000-194-096-056 23 5
24 000-194-107-056 24 6
25 000-194-096-097-056 25 14
26 000-194-107-097-056 26 15
Q 1 056-107-209 1 1
2 056-097-107-209 2 2
R 1 000-174-167 1 1
For Optimization using DASS, we have 26 forward and 2 backward paths. In the 26 forward paths, since the path P2 ranks second based on relevancy and popularity (Refer P in table V), it is considered as the progressive path. Between the 2 backward paths, path Q1 ranks first in both popularity and relevancy (Refer Q in table V) and is taken as the progressive path. We take meta-information such as the semantic score, popularity and year of publication of every node and also check if the node occurs at any level or is a co-citee or not. Based on this information we validate our results.
Conclusion:
In this paper, we have proposed to track the most progressive research happened with respect to a research publication across timeline. The semantically relevant citation network thus obtained is mined for various graph analysis approaches to arrive at the significant research progress trajectory. In addition, we have ranked the paths based on length, popularity and similarity. We have also proposed discrete and continuous derived semantic filter based optimization approaches for tracing the most significant paths. However, the resulting paths are huge in number and therefore, a more improvised dimensionality reduction approach has to be devised for identifying handful of progressive research paths which will be really helpful in terms of analyzing research progress.
REFRENCES
Adamic, L.A., R.M. Lukose, A.R. Puniyani and B.A. Huberman, 2001. “Search in power-law networks.” Physical review E, 64(4): 046135.
Ali, N.H. and N.S. Ibrahim, 2012. “Porter Stemming Algorithm for Semantic Checking.” In Proceedings of 16th International Conference on Computer and Information Technology, pp: 253-258.
Batagelj, V., 2003. “Efficient algorithms for citation network analysis.” arXiv preprint cs/0309023.
Calero-Medina, C. and E.C. Noyons, 2008. “Combining mapping and citation network analysis for a better understanding of the scientific development: The case of the absorptive capacity field.” Journal of Informetrics, 2(4): 272-279.
Carley, K.M., N.P. Hummon and M. Harty, 1993.“Scientific Influence An Analysis of the Main Path Structure in the Journal of Conflict Resolution.” Science Communication, 14(4): 417-447.
Chen, Y. and D. Miao, 2009. “Searching algorithm for attribute reduction based on power graph.” Chinese Journal of Computers, 32(8): 1486-1492.
Garfield, E., I.H. Sher and R.J. Torpie, 1964. “The use of citation data in writing the history of science”.Institute For Scientific Information Inc Philadelphia PA.
Harris, J.K., D.A. Luke, R.B. Zuckerman and S.C. Shelton, 2009. “Forty years of secondhand smoke research: the gap between discovery and delivery”.American Journal of Preventive Medicine, 36(6): 538-548.
Hirsch, J.E., 2005. “An index to quantify an individual's scientific research output.” Proceedings of the National academy of Sciences of the United States of America, 102(46): 16569-16572.
Hummon, N.P. and P. Doreian, 1989.“Connectivity in a citation network: The development of DNA theory”. Social Networks, 11(1): 39-63.
Hummon, N.P., P. Doreian and L.C. Freeman, 1990. “Analyzing the structure of the centrality-productivity literature created between 1948 and 1979”. Science Communication, 11(4): 459-480.
Hummon, N.P. and K. Carley, 1993.“Social networks as normal science”.Social networks, 15(1): 71-106. Korf, R.E., 1985. “Depth-first iterative-deepening: An optimal admissible tree search.” Artificial
intelligence, 27(1): 97-109.
Lu, L.Y.Y., Y.L. Lan and J.S. Liu, 2012. “A novel approach for exploring technological development trajectories.” In Management of Innovation and Technology (ICMIT), 2012 IEEE International Conference, pp. 504-509, June, IEEE.