R E S E A R C H
Open Access
Development of a tool to measure
person-centered maternity care in developing
settings: validation in a rural and urban
Kenyan population
Patience A. Afulani
1*, Nadia Diamond-Smith
1, Ginger Golub
2and May Sudhinaraset
1,3Abstract
Background:Person-centered reproductive health care is recognized as critical to improving reproductive health outcomes. Yet, little research exists on how to operationalize it. We extend the literature in this area by developing and validating a tool to measure person-centered maternity care. We describe the process of developing the tool and present the results of psychometric analyses to assess its validity and reliability in a rural and urban setting in Kenya. Methods:We followed standard procedures for scale development. First, we reviewed the literature to define our construct and identify domains, and developed items to measure each domain. Next, we conducted expert reviews to assess content validity; and cognitive interviews with potential respondents to assess clarity, appropriateness, and relevance of the questions. The questions were then refined and administered in surveys; and survey results used to assess construct and criterion validity and reliability.
Results:The exploratory factor analysis yielded one dominant factor in both the rural and urban settings. Three factors with eigenvalues greater than one were identified for the rural sample and four factors identified for the urban sample. Thirty of the 38 items administered in the survey were retained based on the factors loadings and correlation between the items. Twenty-five items load very well onto a single factor in both the rural and urban sample, with five items loading well in either the rural or urban sample, but not in both samples. These 30 items also load on three sub-scales that we created to measure dignified and respectful care, communication and autonomy, and supportive care. The Chronbach alpha for the main scale is greater than 0.8 in both samples, and that for the sub-scales are between 0.6 and 0.8. The main scale and sub-scales are correlated with global measures of satisfaction with maternity services, suggesting criterion validity.
Conclusions:We present a 30-item scale with three sub-scales to measure person-centered maternity care. This scale has high validity and reliability in a rural and urban setting in Kenya. Validation in additional settings is however needed. This scale will facilitate measurement to improve person-centered maternity care, and subsequently improve reproductive outcomes.
Keywords:Person-centered care, Maternity care, Measurement, Validation, Developing settings, Sub-Saharan Africa, Kenya
* Correspondence:[email protected]
1School of Medicine, University of California, San Francisco, USA Full list of author information is available at the end of the article
Plain English summary
High maternal mortality remains a pressing problem in developing settings. Poor person-centered maternity care contributes both directly and indirectly to this problem. Person-centered maternity care refers to care during childbirth that is respectful and responsive to individual women and their families’ preferences, needs, and values. Person-centered maternity care emphasizes the quality of patient experience. Although experts in mater-nal health recognize the importance of person-centered maternity care, a consistent way to measure this con-struct has not yet been developed. We hope to address this problem by presenting a tool to measure person-centered maternity care. In this paper, we describe the process of developing the tool, and the analysis to test whether the tool measures what it is intended to meas-ure consistently. Our analysis shows that the tool that we developed—comprised of 30 questions—is an effect-ive tool to measure person-centered maternity care in both rural and urban settings in Kenya. The tool in-cludes questions to measure dignity and respect, com-munication and autonomy, and supportive care. This tool is likely useful in other developing settings, although more testing is required in additional settings. The tool can be used for research to identify the factors that affect person-centered maternity care, as well as its con-sequences. Program planners may also use this tool to identify which aspects of person-centered maternity care need attention, and to assess if interventions lead to im-provements in women’s experiences during childbirth.
Background
Despite progress in reducing maternal mortality, devel-oping regions still account for approximately 99% of glo-bal maternal deaths, with sub-Saharan Africa accounting for roughly 66% of these deaths [1]. Historically, limited access to maternal health services has contributed sig-nificantly to adverse maternal outcomes [2–4]. However, increases in use of maternal health services over the past decade has not been matched with reductions in mater-nal mortality, exposing a crucial gap in quality of care [5–7]. This has increased the momentum for improving quality of maternal and reproductive health care in the last few years, with calls for a more comprehensive focus on quality of care—beyond provision of essential services solely [8–10].
Recent evidence of poor treatment of women during childbirth and related calls to action have increased at-tention on poor person-centered care during childbirth in developing settings [5, 10]. Although these calls to ac-tion utilize positive terminology such as respectful and dignified maternity care [11, 12], the terminology used to describe the growing body of research on this topic has largely been negative, with terms like“disrespect and
abuse” [13–17], “obstetric violence” [18, 19], “ dehuma-nized care” [20, 21], and “mistreatment of women” [22, 23]. A landscape analysis by Bowser and Hill in 2010 de-scribed seven manifestations of disrespect and abuse of women during childbirth. These included physical abuse, non-dignified care, non-consented care, non-confidential care, discrimination, abandonment, and detainment [14]. In a mixed methods systematic review, Bohren et al. (2015) also identified seven domains of mistreatment commonly described in the qualitative literature, includ-ing physical abuse, sexual abuse, verbal abuse, stigma and discrimination, failure to meet professional stan-dards of care, poor rapport between women and pro-viders, and health system conditions and constraints [22]. This review also highlighted the lack of standard-ized quantitative measures to evaluate women’s experi-ence during childbirth [22].
Person-Centered Maternity Care (PCMC) highlights respectful maternity care as part of the broader interest in person-centered care. PCMC expands the discussion beyond poor treatment to emphasize holistic, responsive, and dignified maternity care. PCMC emphasizes experi-ence of care, and includes dimensions such as communi-cation, respect and dignity, and emotional support, which are highlighted in the World Health Organization (WHO) quality of care framework for maternal and newborn health [24]. It is these person-centered dimen-sions that most often influence patients’ perceptions of quality of care and satisfaction with services [25–30]. Moreover, patients’ perceptions of quality of care indi-cate how well health systems meet patients’ expecta-tions, as well as their trust in the system [30, 31]. These person-centered dimensions also affect clinical outcomes [32]. A recent systematic review found that patient ex-perience was positively associated with clinical effective-ness and safety in more than 75% of published studies [33]. Additionally, person-centered care affects demand for services [34–36].
found that fear of receiving undignified care was one of the primary reasons for women choosing not to deliver in a facility [39]. Given the introduction of free mater-nity services in Kenya that reduce financial barriers to accessing care [40], perceptions of poor PCMC may be accounting for a larger proportion of the disparities in facility deliveries. A recent survey of women leaving postnatal wards in Kenya found that 20% of women re-ported some form of mistreatment, primarily non-dignified care, neglect or abandonment, non-confidential care, and detainment for not paying fees [13]. Another recent study in Kenya showed poor quality of antenatal and delivery care in many facilities in Kenya, with poor women being more likely to receive poor quality care: only 17% of all women and 8% of poor women had ac-cess to minimally adequate delivery care [41].
Poor PCMC has multiplicative effects, as it can dir-ectly lead to poor pregnancy outcomes, in addition to decreased demand for services [5, 10, 42]. It results in delayed, inadequate, unnecessary, or harmful care, min-imizing the opportunity for health gains for both mothers and babies [10]. PCMC therefore needs more emphasis as a valued quality domain, as well as an indi-cator of human rights [5, 12, 11]. Despite growing evi-dence of its importance, there is a lack of consensus on how to operationalize PCMC. Most studies on mistreat-ment of women have been qualitative [22], and the few quantitative studies use binary measures [13, 43]. To our knowledge, only one published study has validated a tool to measure perceptions of respectful maternity care in a developing setting using standard procedures for scale development including psychometric analysis [44]. With-out standardized and validated tools, the momentum be-hind measuring and improving PCMC could stagnate due to lack of clarity in what constitutes PCMC, and how best to target focused intervention efforts. There is therefore an urgent need to develop and validate tools to assess PCMC that can be used across multiple de-veloping contexts. We aim to extend the literature by developing and validating a person-centered maternity care scale. This tool will have both research and pro-grammatic utility. It will be useful for research to understand the determinants and consequences of poor PCMC, and will help health programs and pro-viders to develop and target interventions. In addition, the tool has the potential to be used for fu-ture needs assessments, as well as monitoring and evaluation of interventions to improve PCMC.
Methods
Here we discuss the scale development and validation process used in this study, which took place in both Kenya and India. We focus on the Kenyan data in this paper and where relevant, the components of the
process that took place in India are mentioned. The re-sults of the development and validation process in India will be presented in a separate analysis. We used the fol-lowing standard procedures for scale development and validation [45, 46].
Defining the construct of person-centered maternity care and identifying domains
As PCMC is a relatively new concept in developing set-tings, we examined bodies of work that discuss overlap-ping issues related to PCMC, though do not necessarily use terms such as PCMC. This includes literature from health system responsiveness [47–49], perceived quality of care [50, 51], mistreatment of women during child-birth [13, 14, 22], and the general literature on quality of care for maternal health [24, 28, 52–54]. In addition, we examined the general literature on person-centered care, which is mostly from developed settings [55–58]. Al-though framed differently, these separate bodies of work include important aspects of PCMC.
Following this review, we adopted the following defin-ition of person-centered maternity care: “Providing ma-ternity care that is respectful and responsive to individual women and their families’ preferences, needs, and values, and ensuring that their values guide all clin-ical decisions,” a definition from the Institute of Medi-cine [57]. PCMC includes timely and equitable care. We identified 10 domains of PCMC, namely:
1. Dignity and Respect 2. Autonomy
3. Privacy and Confidentiality 4. Communication
5. Social Support 6. Supportive Care
7. Predictability and Transparency of Payments 8. Trust
9. Stigma and Discrimination 10.Health Facility environment
Item generation
Following the identification of these domains, we devel-oped an item pool with questions capturing each of the domains. Many of the questions were based on ques-tions used in existing tools addressing one or more of the domains of interest [13, 44, 49–51]. The first draft of our tool contained approximately 40 items, which were statements with 5-point response options ranging from 1:“strongly agree”to 5:“strongly disagree”.
Expert reviews
then sent revised versions to other maternal health aca-demic experts to review. We received individual inputs from six maternal health experts outside our core team. A formal expert review was then conducted by bringing together eight Maternal and Child Health experts in Kenya to review the items in a focus group discussion format. These experts included academic researchers, as well as public health and clinical practitioners with sev-eral years of experience. The meeting was held in a con-ference room at the Kenya Medical Research Institute. The expert reviews yielded suggestions for rewording many questions, as well as inclusion of additional ques-tions for some of the domains. Following expert review, the number of items had increased to approximately 70 questions, and included multiple ways of asking the same questions. Some expert reviewers also strongly recommended against using the “strongly agree” to “strongly disagree” response format, which has been shown to have high acquiescence bias [59]. Thus, we framed the questions in two ways for test-ing followtest-ing expert reviews. An initial set had the statements with response options in the form of
“strongly disagree,” “disagree,” “neither disagree nor agree,” “agree,” or “strongly agree;” while the second-ary set contained questions with frequency responses in the form of “never”, “a few times”, “sometimes”,
“most of the time”, and “all the time”.
Cognitive interviews
Cognitive interviews are an integral component of scale construction [60]. Cognitive interviews were conducted to improve our understanding of how participants inter-nalized the questions; assess if the questions were being interpreted as intended; evaluate problems with the wording of questions; evaluate whether questions were context appropriate and salient; and finally, to assess ap-propriate length of the tool [60–62].
The initial cognitive interviews for this project were conducted in India. Six cognitive interviews were con-ducted with women post-delivery in two government fa-cilities in Uttar Pradesh in March, 2016. Interviews were conducted by two teams of two interviewers each, with one acting as a note taker. Respondents were eligible if they were between 18 and 49 years, had just delivered in the postpartum ward, had not had a cesarean section, and felt well enough to be interviewed. Recruitment and informed consent took place in the labor ward. Inter-views were conducted in Hindi and detailed notes were taken by one of the research team members and then translated into English.
Through review of the initial Indian interviews, the re-search team learned that respondents struggled when provided with statements and asked to state if they
“strongly disagreed,” “disagreed,” “neither disagreed nor
agreed,” “agreed”, or “strongly agreed”; a proportion of the respondents simply replied“sometimes” to a major-ity of the questions. Thus, all questions were changed to utilize the frequency format as suggested by our expert reviewers in Kenya. In addition, the middle response op-tion (“sometimes”) was dropped, as the majority of re-spondents frequently gravitated towards this response. While translating interviews into Swahili and Luo, the research team learned that the distinction between a
“few times” and“sometimes” was not clear in the trans-lated versions, further supporting the need to drop the middle category. Questions were revised following the initial cognitive interviews to a set of approximately 60 questions, and a subsequent round of cognitive inter-views were conducted with women in Kenya.
The cognitive interviews in Kenya were conducted be-tween May and June 2016 at three government health facilities in Kiambu County, by three female interviewers trained in cognitive interviewing. Working closely with facility staff, interviewers purposively identified ten women for the interviews. Respondents were eligible if they were aged 18-49 years, delivered in the preceding 7 days at one of the study facilities, and felt well enough to participate. Recruitment and written informed con-sent took place in a private space within facility grounds to ensure confidentiality. Respondents were also asked if the interview could be audio-recorded during the con-senting process, though this did not constitute an eligi-bility criterion. At the time of consent, respondents were given the option of continuing with the cognitive view in a private space at the facility or having the inter-view conducted at their home within the next few days. All but one of the interviews occurred at a private space in the health facility, and all gave consent for audio re-cording. Cognitive interviews were conducted in English and/or Swahili based on the respondent’s language pref-erence. Mobile phone airtime credit in the amount of approximately $1.50 was provided to respondents to thank them for their participation in the study. Audio recordings were transcribed verbatim and concurrently translated to English, if necessary, by independent con-sultants. Quality assurance checks were performed on all transcripts by comparing them to the audio recordings.
A cognitive interview guide developed by the research team directed interviewers to ask how frequently a person-centered care indicator occurred, followed by a rating of the importance of the indicator, with probes to understand why/why not, and/or in which circumstance each item would be appropriate/inappropriate (e.g. being called by name, being shouted at or scolded by a pro-vider, etc.).
did you arrive at that answer? Was this question difficult for you to answer? How would you rephrase this ques-tion to make it better? When a quesques-tion was framed in multiple ways, respondents were asked which of the questions they preferred with regard to ease of understanding.
The research team then examined the distribution of responses as well as the ratings of their importance. Transcripts were reviewed to identify ambiguous or con-fusing questions, and responses to as to why respon-dents answered the way they did. Following these analyses, questions that did not work well in the cogni-tive interviews were removed and those that seemed un-clear revised. This exercise reduced the number of items to 38, with each question containing a 4-point response scale: “no, never”, “yes, a few times”, “yes, most of the time” and “yes, all the time.” In addition, responses for two questions on verbal and physical abuse were chan-ged to (“no never”, “yes, once,” “yes, a few times”, and
“yes, many times”) to account for the low prevalence of overt abuse, while retaining the same scale as the other responses options. A “not applicable” response option was added to questions where the cognitive interviews revealed that the question might not be relevant to all respondents. Revised items were then pretested with the full questionnaire among a convenience sample of about 39 women in the participating facilities. Final revisions were then made, although minor at this point in the re-finement process.
Translation
The translation of the tool was an iterative process, starting before the cognitive interviews and continuing until the version used in the survey was finalized. We recognized that nuances in language could affect the meaning of the questions, and some of the words in the English version may not have words in the local lan-guages that directly translated to how they were used in English. To handle this, we spent a substantial amount of time during training of field officers to ensure that questions had the same meaning, even if the words used were a bit more colloquial. The tool was first translated into Swahili by someone who could speak both English and Swahili. During training of the field officers for the cognitive interviews, additional changes were made to the translated versions based on input from the field of-ficers who spoke both English and Swahili. An example is the use the slang phrase,“kitu kidogo”, directly trans-lating tosomething small, instead of bribe which we ori-ginally used. Field officers suggested we use this phrase for bribe as this is how it was best understood by Ken-yans. The Luo translation went through a similar process of discussing the questions with the field officers during their training for the surveys. The final translated
versions were based on consensus with the field team. Given the group input of multiple local language speakers to the tool, we believe the questions in the dif-ferent languages were similar in meaning.
Survey
The final set of items was administered as part of two separate surveys in Kenya: in a rural setting and an urban setting.
Rural sample
In Migori County, a predominantly rural county in west-ern Kenya, a survey was conducted in August and Sep-tember 2016. The sample was comprised of women who delivered in the 9 weeks preceding the survey in the County. Women were recruited at health facilities (in the delivery wards and postnatal clinics), and in their homes. A multistage sampling approach was used to se-lect women. First, the county was divided into 8 strata based on the 8 sub-counties in the county. All health units in each stratum were then identified and10 health units randomly selected. Within each selected health unit, women who delivered in the preceding 9 weeks were identified with the help of the Community Health Volunteer assigned to that health unit. The target was to conduct approximately 200 interviews in each sub-county. The first 20 eligible women in each health unit who were available were interviewed. If the target was not met after interviews in all the selected health units were completed, more health units in that sub-county were sampled. Twelve trained data collectors conducted the interviews, with one interviewer from each sub-county and an additional interviewer in the four larger sub-counties. The interviews were conducted in English, Swahili, and Luo in private spaces in health facilities or in the homes of the respondents. All participants pro-vided written informed consent after receiving informa-tion about the research. They were given a gift of 200 Kenyan shillings (~$2). The majority of data was col-lected using the RedCap application, with data uploaded directly online. In instances where the Internet connec-tion was poor, the interviews were entered on paper and transferred to RedCap when the data collector reached a place with better connectivity. Quality assurance checks were performed throughout the data collection. A total of 1052 women were interviewed, with a response rate above 98%. We performed psychometric analysis using data from women who delivered in a health facility (877) and who had complete information on all the items (N= 857).
Urban sample
Nairobi and Kiambu Counties using the same PCMC tool. Nairobi is the National capital of Kenya and is 100% urban. Kiambu County is 60% urban, but our sam-ple was drawn from the urban portions of the county [63]. The sample was comprised of women who deliv-ered within a week of the survey in any of the seven par-ticipating health facilities. The post-partum length is shorter here because this was the target group for this project, and we did not have the flexibility of changing this sample. Six trained interviewers conducted the in-terviews. Respondents were identified with the help of health of facility staff and invited to participate in the survey. Recruitment and consenting took place in a pri-vate space within facility grounds, and respondents were given the option of continuing with the interview in a private space at the facility or having the interview at their home within the next few days. All but three of the interviews occurred at a private space in the health facil-ity. Interviews were conducted in English and/or Swahili. All participants provided written informed consent after receiving information about the research. Respondents were given mobile phone airtime worth approximately $1.50 in appreciation of their participation. Interviews were conducted using the SurveyCTO platform, with data uploaded to the server at the end of each day. Qual-ity assurance checks were performed throughout the data collection. A total of 531 women were interviewed. We performed the psychometric analysis using data from women who had complete information on all the items (N= 530).
Psychometric analyses
We first examined the distributions of all the items, comparing the two samples. In instances where ques-tions had responses in the“not applicable” category, we decided to convert the“not applicable”category into the highest category to obtain a uniform scale for the psy-chometric analysis. This approach is conservative as it assumes the highest quality rating for each “not applic-able” response. For example, for the question on labor support, we assume that someone who said “they did not want a support person” would have been allowed one if they so desired. We reverse coded negative items in order for responses to reflect a scale of 0 as the lowest level to 3 as the highest level. We then constructed a correlation matrix to examine the correlations among the items.
We conducted the psychometric analysis to assess the validity and reliability of the tool. Validity is the degree to which the items in a survey tool measure the phenomenon or construct it is intended to measure [64]. Common types of validity that need to be considered in scale development are content, construct, and criterion related validity [46]. Content validity assesses whether
the items represent all possible indicators relevant to the construct [46]. We assured content validity through a comprehensive literature search to develop a definition for the construct, to identify related domains based on empirical research and theory, and then developing items that represent each domain identified. The expert reviews were also used to optimize content validity.
Construct validity is the degree to which a measure re-lates to other measures in theoretically predictable ways, or how well the items represent the underlying concep-tual structure [46, 64]. Factor analysis is an important step in psychometric analysis. It is used to examine the interrelationships among a set of variables, thus, can be used to assess construct validity. Factor analysis is also a data reduction method used to re-express data on mul-tiple variables with fewer dimensions and to reduce a set of observed variables to a smaller, more parsimonious set of variables [45, 46, 65]. We conducted exploratory factor analysis using principal factoring. We used the Kaiser-Meyer-Olkin (KMO) measure of sampling ad-equacy to assess if the variables were suitable for factor analysis. The KMO measure has values between 0 and 1, with small values indicating that overall, the variables have little in common to warrant a principal compo-nents analysis. Values above 0.5 are considered satisfac-tory for factor analysis [66]. We used a KMO value of 0.5 as the criterion for sampling adequacy.
The factor analysis was an iterative process. First, we conducted the factor analysis for the rural and urban samples separately, and also with the combined sample. We then examined the Eigenvalues (the amount of infor-mation captured by a factor) and scree plots (plots of Ei-genvalues) to determine the number of factors to extract. We used both Kaiser’s rule of retaining only fac-tors with eigenvalues exceeding unity and the“break” in the scree plot to decide on how many factors to retain [45, 46, 65]. We then conducted subsequent factor ana-lysis and examined the item loadings to determine which items to retain or delete. Item loading is the degrees to which the original item scores correlate with the compo-nents. We used a cut off of 0.3 at the initial stage [67]. Items that did not have a loading of 0.3 or higher on any of the extracted factors in the 3 samples were thus dropped after the first set of factor analysis. Further rounds of factor analysis were conducted to decide on the final set of items and sub-scales. In these subsequent stages, the cut off for deletion was varied based on the theoretical importance of the item.
aligns the factor axes as closely as possible to the groups of the original variables [45, 60, 66]. As the PCMC do-mains were theoretically related and the extracted compo-nents were correlated, we used oblique rotation. We tested our final factor structure in confirmatory factor analysis with various samples stratified by setting, location of interview, postpartum length, age of respondent, and educational level of respondent. We also examined the Pearson correlation coefficient between the components identified by factor analysis to assess construct validity.
Criterion-related validity refers to whether the meas-ure is related to other measmeas-ures or outcomes in theoret-ically predictable ways [46, 64]. One approach to determining criterion validity is through hypothesis test-ing [67]. Consistent with other work we hypothesized that the PCMC scale would be correlated with global measures of satisfaction with care and quality of care [28, 44]. We tested this by regressing the main scale and sub-scales on women’s ratings of their satisfaction with the services, the quality of care they received during de-livery, and whether she would deliver in the same facility if she were to have another baby.
Reliability refers to the degree to which a measure-ment tool produces stable and consistent results [46]. For a measure to be valid, it must also be reliable, but a reliable measure may not necessarily be valid [64]. We assessed the internal consistency reliability using Cron-bach’s alpha. Cronbach’s alpha ranges from 0 to 1. Higher score imply greater reliability; with 0.7 or higher generally considered sufficient evidence of reliability [45]. An extremely high alpha (>0.95) might however suggest redundancy among some indicators [46]. Reli-ability across settings was also examined by testing for the difference between scores in the rural and urban sample. We used STATA version 14 to perform the stat-istical analyses.
Results
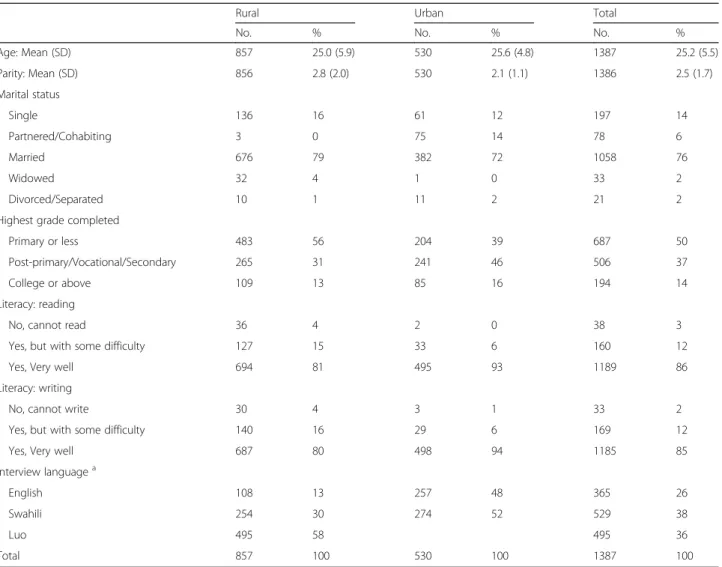
Table 1 shows the demographic characteristics of re-spondents for the urban and rural samples. The average age is about 25 years for the rural sample, and 26 years for the urban sample. Approximately 79% of the women in the rural sample are married, compared to 72% for the urban sample. Women in the urban sample are slightly more educated than those in the rural sample. Close to 40% of the interviews in the rural sample oc-curred at a health facility, as compared to all the inter-views in the urban sample. The postpartum length for women interviewed in the rural sample is distributed be-tween zero and 9 weeks. Only women less than a week postpartum were interviewed in the urban sample.
Table 2 shows the original domains, the questions for each domain, and comments on decisions taken related to that item. The distributions for the items are shown
in Additional file 1: Appendix 1. With few exceptions, the responses generally ranged between 0 and 3. Not-ably, the responses for the labor and delivery support questions in the urban sample had a large proportion of responses in the “not applicable” category. Over 40% of respondents in the urban sample did not want a support person during labor or delivery. This category was recoded into the“all the time” category for the psycho-metric analysis and likely has implications for the factor structure obtained for the urban sample.
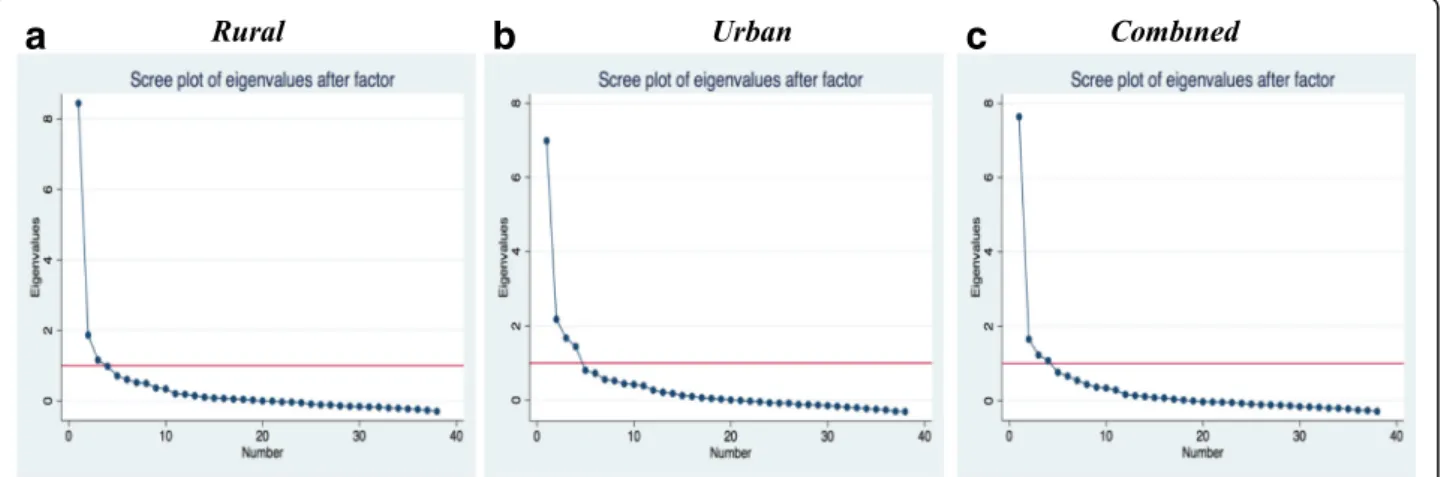
There is good correlation among the majority of items, with correlations between 0.2 and 0.8. None of the items had correlations >0.8. Five items had correlations of <0.2 with all other items. The KMO measure of sampling ad-equacy for all items are greater than 0.5, with an overall KMO of 0.91, indicating that overall the variables are satisfactory for factor analysis. The initial exploratory factor analysis yielded 3 factors with eigenvalues of greater than one for the rural sample, accounting for 84% of the variance among the items. For the urban sample, the exploratory factor analysis yielded four fac-tors with eigenvalues of greater than one accounting for 86% of the variance. When the two samples were com-bined, we had four factors with eigenvalues of greater than one, accounting for 91% of the variance. When we examine the difference in eigenvalues between the fac-tors and scree plots (Fig. 1a, b and c) for each sample, we find that even though there are three or four factors with eigenvalues of more than one, there is one domin-ant factor in all samples. This means that depending on which criteria we use for factor extraction, we could have three or four sub-scales or just one unified scale.
correlated; therefore“paid attention during stay”was de-leted, as it was less specific. Items deleted and the ratio-nales for deletion are shown in Table 2. Thirty items remained after this process, including items from all of the original domains, with the exception of discrimin-ation and transparency and predictability of payments.
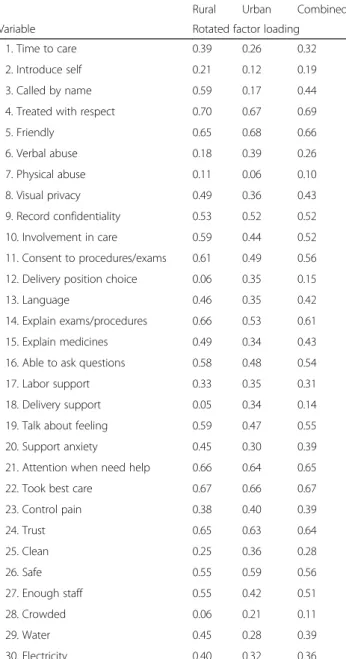
Another round of factor analysis with the 30 items yielded two factors with eigenvalues greater than 1 for the rural sample and four factors for the urban sample. When the point of the“break”in the scree plot was used as the criteria for factor extraction, it suggested one sin-gle underlying factor structure for both samples. Thus, we ran another set of factor analysis retaining only one factor for all the samples with the remaining 30 items. Loadings of the items onto this factor were each >0.2, with the exception of the following: “Physical abuse” loaded at less than 0.2 on both samples; “position of choice”,“delivery support”, and“crowding”loaded at less than 0.2 in the rural sample; and “provider introduce self” and“called by name” loaded at less than 0.2 in the
urban sample (shown on Table 3). In the combined sam-ple, the items with low loadings on the single factor were
“provider introduce self”, “physical abuse”, “position of choice”, “delivery support”, and “crowding.” This sug-gests that one unified person-centered maternity care scale could be constructed, with between 24 and 30 items, depending on whether we used a purely statistical criterion and dropped all items with low loadings or in-cluded with low loadings based on theoretical relevance.
On the other hand, if we used Kaiser’s rule of retaining factors with eigenvalues exceeding unity, then we would have had between 2 and 4 factors (or sub-scales) making up our PCMC scale. To assess this, we conducted an-other set of factor analysis with the 30 items, retaining 3 factors for each sample. In the rural sample, all items ex-cept those on verbal and physical abuse load onto to the first two factors, with the more subjective measures (e.g.
“treated with respect”, “treated in friendly manner”) tending to load on the first factor and the less subjective (e.g.“providers introduce themselves”,“called by name”)
Table 1Distribution of selected demographic variables
Rural Urban Total
No. % No. % No. %
Age: Mean (SD) 857 25.0 (5.9) 530 25.6 (4.8) 1387 25.2 (5.5)
Parity: Mean (SD) 856 2.8 (2.0) 530 2.1 (1.1) 1386 2.5 (1.7)
Marital status
Single 136 16 61 12 197 14
Partnered/Cohabiting 3 0 75 14 78 6
Married 676 79 382 72 1058 76
Widowed 32 4 1 0 33 2
Divorced/Separated 10 1 11 2 21 2
Highest grade completed
Primary or less 483 56 204 39 687 50
Post-primary/Vocational/Secondary 265 31 241 46 506 37
College or above 109 13 85 16 194 14
Literacy: reading
No, cannot read 36 4 2 0 38 3
Yes, but with some difficulty 127 15 33 6 160 12
Yes, Very well 694 81 495 93 1189 86
Literacy: writing
No, cannot write 30 4 3 1 33 2
Yes, but with some difficulty 140 16 29 6 169 12
Yes, Very well 687 80 498 94 1185 85
Interview languagea
English 108 13 257 48 365 26
Swahili 254 30 274 52 529 38
Luo 495 58 495 36
Total 857 100 530 100 1387 100
a
Table 2Items for person-centered maternity care scale
Original Domain Question Referred to in
text as
Comment
Dignity/Respect 1. How did you feel about the amount of time you waited? Would you say it was very short, just a little long, somewhat long, or very long?
Time to care Retained
Dignity/Respect 2. During your time in the health facility did the doctors, nurses, or other health care providers introduce themselves to you when they first came to see you?
Introduce self Retained but loads better in rural than urban sample
Dignity/Respect 3. Did the doctors, nurses, or other health care providers call you by your name?
Called by name
Retained but loads better in rural than urban sample
Dignity/Respect 4. Did the doctors, nurses, or other staff at the facility treat you with respect?
Treated with respect
Retained
Dignity/Respect 5. Did the doctors, nurses, and other staff at the facility treat you in a friendly manner?
Friendly Retained
Dignity/Respect 6. Did the doctors, nurses, and other staff at the facility show they cared for you?
Show cared Deleted: correlated with friendly and respect
Dignity/Respect 7. Did you feel the doctors, nurses, or other health providers shouted at you, scolded, insulted, threatened, or talked to you rudely?
Verbal abuse Retained
Dignity/Respect 8. Did you feel like you were treated roughly like pushed, beaten, slapped, pinched, physically restrained, or gagged?
Physical abuse Retained but loads better in rural than urban sample
Dignity/Respect 9. Did you feel like you were forced to stay at the health facility against your will because you could not pay your bill?
Stay against will
Deleted: low correlation with other items and low loading in all samples
Privacy/ Confidentiality
10. When you were speaking to the doctors, nurses or other staff at the facility, did you feel other people not involved in your care could hear what you were discussing?
Auditory privacy
Deleted: low correlation with other items and low loading in all samples
Privacy/ Confidentiality
11. During examinations in the labor room, were you covered up with a cloth or blanket or screened with a curtain so that you did not feel exposed?
Visual privacy Retained
Privacy/ Confidentiality
12. Do you feel like your health information was or will be kept confidential at this facility?
Record confidentiality
Retained
Autonomy 13. Did you feel like the doctors, nurses or other staff at the facility involved you in decisions about your care?
Involvement in care
Retained
Autonomy 14. Did the doctors, nurses or other staff at the facility ask your permission/consent before doing procedures and examinations on you?
Consent to procedures/ exams
Retained
Autonomy 15. During the delivery, do you feel like you were able to be in the position of your choice?
Delivery position choice
Retained but loads better in urban than rural sample
Communication 16. Did the doctors, nurses or other staff at the facility speak to you in a language you could understand?
Language Retained
Communication 17. Did the doctors and nurses explain to you why they were doing examinations or procedures on you?
Explain exams/ procedures
Retained
Communication 18. Did the doctors and nurses explain to you why they were giving you any medicine?
Explain medicines
Retained
Communication 19. Did you feel you could ask the doctors, nurses or other staff at the facility any questions you had?
Able to ask questions
Retained
Social Support 20. Were you allowed to have someone you wanted (outside of staff at the facility, such as family or friends) to stay with you during labor?
Labor support Retained
Social Support 21. Were you allowed to have someone you wanted to stay with you during delivery?
Delivery support
Retained but loads better in urban than rural sample
Supportive Care 22. Did the doctors and nurses at the facility talk to you about how you were feeling?
Talk about feeling
Retained
Supportive Care 23. Did the doctors, nurses or other staff at the facility support your anxieties and fears?
Support anxiety
Retained
loading on the second factor. Only verbal and phys-ical abuse loaded on the third factor, although ver-bal abuse also had a reasonably high loading (EV = 0.25) with other items on dignity and respect on the first factor. The items on health facility
environment also loaded onto the first factor, except for “crowding,” which had low factor loading (less than 0.1) on all 3 retained factors in the rural sam-ple. Most of the items on communication loaded on the second factor.
Table 2Items for person-centered maternity care scale(Continued)
Original Domain Question Referred to in
text as
Comment
Supportive Care 25. Do you feel the doctors or nurses did everything they could to help control your pain?
Control pain Retained
Supportive Care 26. When you needed help, did you feel the doctors, nurses or other staff at the facility paid attention?
Attention when need help
Retained
Supportive Care 27. Did you feel the doctors and nurses paid attention to you during your stay in the facility?
Attention during stay
Deleted: correlated with attention when needing help
Supportive Care 28. Were you allowed to eat or drink when you were hungry/thirsty? Allowed to eat/drink
Deleted: low correlation with other items and low loading in all samples
Trust 29. Did you feel the doctors, nurses or other staff at the facility took the best care of you?
Took best care Retained
Trust 30. Did you feel you could completely trust the doctors, nurses or other staff at the facility with regards to your care?
Trust Retained
Predictability &transparency of payments
31. During your time at the facility, did any staff at the facility ask you or your family for kitu kidogo? (colloquial translation for bribe)
Bribe Deleted: low correlation with other items and low loading in all samples
Stigma & Discrimination
32. During your time in the health facility, would you say you were treated differently because of any personal attribute…like your age, marital status, number of children, your education, wealth, your connections with the facility, or something like that?
Differential treatment
Deleted: low correlation with other items and low loading in all samples
Facility environment 33. Do you think there was enough health staff in the facility to care for you?
Enough staff Retained
Facility environment 34. Thinking about the labor and postnatal wards, Did you feel the health facility was crowded?
Crowded Retained but loads better in urban than rural sample
Facility environment 35. Thinking about the wards, washrooms and the general environment of the health facility, will you say the facility was very clean, clean, dirty, or very dirty?
Clean Retained but loads better in rural than urban sample
Facility environment 36. Was there water in the facility? Water Retained
Facility environment 37. Was there electricity in the facility? Electricity Retained
Facility environment 38. In general, did you feel safe in the health facility? Safe Retained
a
b
c
For the urban sample, however, only “labor and deliv-ery support” and “position of choice” questions loaded onto the third factor, with most of the communication and autonomy related items loading on first factor and the rest on the second factor. Verbal abuse loaded on the first factor with the other items on dignity and re-spect, and physical abuse did not load on any of the retained factors in the urban sample.“Crowding”loaded with the other health facility environment items in the urban sample. A few items also loaded on more than one factor. We decided not to use cross loading as a sole criterion for item deletion at this stage. Instead, the dis-tribution of the items, theoretical rationale, and the
judgment of the study team was used [44]. If an item cross-loaded on more than one factor, the item was retained in the factor it loaded highest on. The differ-ence in factor loadings was greater than 0.1 in most cases, which was judged sufficient to warrant this approach.
The factor analysis thus suggested a unified scale with possibility of 3 sub-scales based on the factors extracted. However, because the factors extracted included a mix of items from each of the original domains, it was diffi-cult to ascertain what each factor represented conceptu-ally. We therefore decided to regroup the retained items into 3 sub-scales based on the factor loadings and con-ceptual domains drawn from the experience of care cat-egories in the WHO quality of care framework for maternal and newborn care. We created sub-scales for: Dignity and Respect (DR), Communication and Auton-omy (CA), and Supportive Care (SC). We then con-ducted factor analysis with the items in each of these groups, in an iterative process, moving items that did not load in their assigned group until each loaded well with a group. We considered having a separate sub-scale for the items related to health facility environment (HFE), as they seemed conceptually distinct from the other items focused on interpersonal interactions. But we decided against a separate HFE sub-scale because it had low reliability as a subscale. We decided to retain these items in the SC sub-scale because they are needed to provide supportive care, and most of them loaded well with other items in that group. Each sub-scale yielded one factor, with most items loading reasonable well onto the extracted factor.
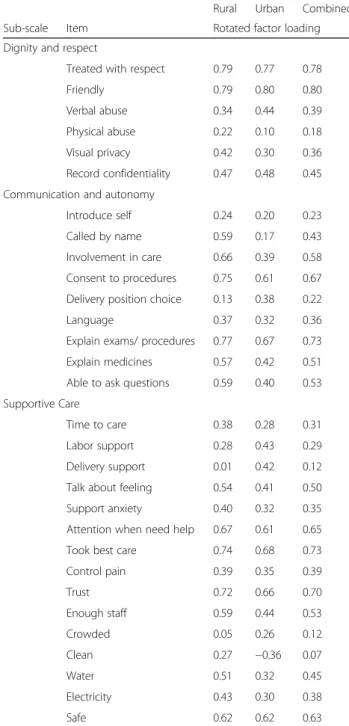
As shown in Table 4, the factor loadings were at least 0.2, with most greater than 0.40. The exceptions were
“physical abuse,” “called by name,” “delivery support,”
“crowding,”and“cleanliness,”which had loadings of less than 0.2 on their sub-scales. Of note,“cleanliness”had a negative loading on the SC sub-scale in the urban sam-ple. We considered cleanliness might be more represen-tative of dignity and respect, thus, we run the factor analysis retaining this item in the DR sub-scale. But it loaded negatively on the DR sub-scale for the urban sample. Factor loadings for cleanliness on the SC sub-scale were slightly higher than that on DR sub-sub-scale in the rural and combined samples. Furthermore, with the confirmatory factor analysis utilizing the combined sam-ple, the coefficient for cleanliness was significant (p < 0.05) in the SC scale, but not in the DR sub-scale. Therefore, we maintained cleanliness in the SC sub-scale. The coefficients for all the other items were significant in the confirmatory factor analysis.
The factor analysis using the full sample, as well as for samples stratified by setting, place of interview, postpar-tum length, age, and education, yielded similar results
Table 3Rotated factor loadings of items on dominant factor for main scale
Rural Urban Combined
Variable Rotated factor loading
1. Time to care 0.39 0.26 0.32
2. Introduce self 0.21 0.12 0.19
3. Called by name 0.59 0.17 0.44
4. Treated with respect 0.70 0.67 0.69
5. Friendly 0.65 0.68 0.66
6. Verbal abuse 0.18 0.39 0.26
7. Physical abuse 0.11 0.06 0.10
8. Visual privacy 0.49 0.36 0.43
9. Record confidentiality 0.53 0.52 0.52
10. Involvement in care 0.59 0.44 0.52
11. Consent to procedures/exams 0.61 0.49 0.56
12. Delivery position choice 0.06 0.35 0.15
13. Language 0.46 0.35 0.42
14. Explain exams/procedures 0.66 0.53 0.61
15. Explain medicines 0.49 0.34 0.43
16. Able to ask questions 0.58 0.48 0.54
17. Labor support 0.33 0.35 0.31
18. Delivery support 0.05 0.34 0.14
19. Talk about feeling 0.59 0.47 0.55
20. Support anxiety 0.45 0.30 0.39
21. Attention when need help 0.66 0.64 0.65
22. Took best care 0.67 0.66 0.67
23. Control pain 0.38 0.40 0.39
24. Trust 0.65 0.63 0.64
25. Clean 0.25 0.36 0.28
26. Safe 0.55 0.59 0.56
27. Enough staff 0.55 0.42 0.51
28. Crowded 0.06 0.21 0.11
29. Water 0.45 0.28 0.39
(results not shown) with“physical abuse,” “delivery pos-ition choice,” “delivery support person,” “crowding,”and
“cleanliness” being the only items that did not consist-ently have factor loadings of >0.2 in all the samples. Therefore, as with the main scale, if we were to decide on the scale based purely on the statistical analysis, these 5 items would be dropped to have 25-items that work reasonably well in both rural and urban settings. How-ever, given the theoretical significance of these items and that some loaded relatively well in one sample but not
the other, we have decided to retain them in the current version of the scale to be tested in future validation studies. The sub-scales are strongly correlated with each other, with correlation coefficients (r) ranging from 0.53 to 0.63, and with the main scale (r= 0.75, 0.86, and 0.9 for DR, CA, and SC respectively).
The full 30-item PCMC scale has good internal consistency reliability, with Cronbach’s alpha of 0.88 for the rural sample, 0.83 for the urban sample, and 0.86 for the combined sample. Dropping“physical abuse,” “ deliv-ery position choice,” “delivery support person,” and
“crowding” only marginally increased the alphas to 0.89 and 0.87 for the rural and combined samples respect-ively. The alpha for the urban sample does not change due to dropping these items. The Cronbach’s alphas for the sub-scales for Dignity and Respect, Communication and Autonomy, and Supportive Care for both the rural sample and urban samples are within acceptable ranges from 0.6 to 0.8 (Table 5). Dropping “physical abuse” marginally increases the alpha for the DR sub-scale to 0.67 for the rural sample and to 0.64 for the urban scale. Dropping “delivery position choice” increases the alpha for CA sub-scale for the rural sample to 0.80 and mar-ginally decreases that for the urban sample to 0.61. Dropping “delivery support,” “crowding,” and “ cleanli-ness” increases the alpha for SC sub-scale for the rural sample to 0.79 and decreases that for the urban sample to 0.69. Thus, improving reliability is not a compelling reason for dropping these items.
The mean PCMC score (based on the sum of all the items in the scale) for the rural sample is 59.5 (SD = 13.6) with a range of 21 to 90, and that for the urban sample
Table 4Rotated factor loadings on dominant factor for sub-scales
Rural Urban Combined
Sub-scale Item Rotated factor loading
Dignity and respect
Treated with respect 0.79 0.77 0.78
Friendly 0.79 0.80 0.80
Verbal abuse 0.34 0.44 0.39
Physical abuse 0.22 0.10 0.18
Visual privacy 0.42 0.30 0.36
Record confidentiality 0.47 0.48 0.45
Communication and autonomy
Introduce self 0.24 0.20 0.23
Called by name 0.59 0.17 0.43
Involvement in care 0.66 0.39 0.58
Consent to procedures 0.75 0.61 0.67
Delivery position choice 0.13 0.38 0.22
Language 0.37 0.32 0.36
Explain exams/ procedures 0.77 0.67 0.73
Explain medicines 0.57 0.42 0.51
Able to ask questions 0.59 0.40 0.53
Supportive Care
Time to care 0.38 0.28 0.31
Labor support 0.28 0.43 0.29
Delivery support 0.01 0.42 0.12
Talk about feeling 0.54 0.41 0.50
Support anxiety 0.40 0.32 0.35
Attention when need help 0.67 0.61 0.65
Took best care 0.74 0.68 0.73
Control pain 0.39 0.35 0.39
Trust 0.72 0.66 0.70
Enough staff 0.59 0.44 0.53
Crowded 0.05 0.26 0.12
Clean 0.27 −0.36 0.07
Water 0.51 0.32 0.45
Electricity 0.43 0.30 0.38
Safe 0.62 0.62 0.63
Table 5Reliability and distribution of Full PCMC scale and sub-scales
Alpha Mean SD Min Max
Rural
Full PCMC Scale 0.88 59.5 13.6 21.0 90.0
Dignity and respect 0.66 15.1 2.9 3.0 18.0
Communication and autonomy 0.78 13.9 5.9 1.0 27.0
Supportive Care 0.75 30.5 6.8 8.0 45.0
Urban
Full PCMC Scale 0.83 60.2 12.3 22.0 86.0
Dignity and respect 0.61 14.4 2.9 3.0 18.0
Communication and autonomy 0.62 15.1 4.7 3.0 26.0
Supportive Care 0.72 30.4 6.5 10.0 44.0
Combined
Full PCMC Scale 0.86 59.8 13.1 21.0 90.0
Dignity and respect 0.63 14.8 2.9 3.0 18.0
Communication and autonomy 0.73 14.4 5.5 1.0 27.0
is 60.2 (SD = 12.3), with a range of 22 to 86. The differ-ence is not significant (p= 0.85). The means for the sub-scales are also shown in Table 5. The differences be-tween the means for the rural and urban samples are significant (p< 0.001) for DR and CA, although not for SC.
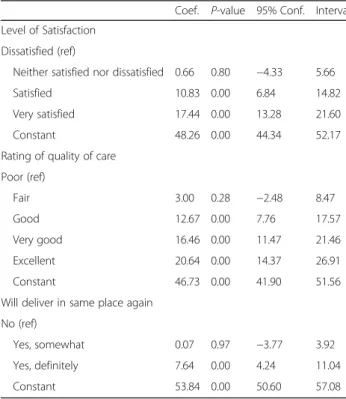
The regression of each of the sub-scales and the full scale on patients’ ratings of satisfaction with services, general quality ratings, and whether the woman would deliver in the same facility if she were to have another baby shows the sub-scales are individually and collect-ively correlated with the global measures of satisfaction and quality of care, which suggests high criterion valid-ity. Table 6 shows the bivariate linear regressions for these global measures on the PCMC scale (reversed for ease of interpretation and to show graded increase in global measures with increasing PCMC scores).
Discussion
The World Health Organization includes women’s expe-riences of care and person-centered outcomes as pri-mary components in their quality of care framework for maternal and newborn health [24]. There is however no consensus on how to measure these constructs. We de-scribe the process of developing and validating a scale to measure person-centered maternity care. We present a 30-item scale that can be used to measure women’s per-ceptions of person-centered care during labor and
delivery, and show that it is has high validity and reliabil-ity in both rural and urban settings in Kenya. The scale has high content validity based on our extensive litera-ture and expert reviews. The exploratory factor analysis suggests high construct validity—the items measure an underlying construct, which we believe to be PCMC based on the content validity. It also has high criterion validity, being strongly correlated with global measures of satisfaction and quality of maternity care. In addition, it has high internal reliability, with an alpha well above the recommended level of 0.7. There currently is no gold-standard tool in this area of work, hence we are un-able to test the performance of the PCMC tool against a gold standard. We present the 30-item scale with three sub-scales for “Dignity and respect,” “Communication and autonomy,”and “Supportive care.”These sub-scales also have good content, construct, and criterion validity, with reliability within acceptable ranges of 0.6 to 0.8.
We used DeVellis’ guidelines in scale development, which include use of theory, specificity of measures, and choosing items that reflect the purpose of the scale to guide items to include [46, 68]. As our goal was to de-velop a theory based but practical PCMC scale that can be easily administered in various contexts, we decided to include five items that differed in factor loadings across urban and rural contexts to be conservative and over in-clusive, rather than over exclusive. Redundancy is rec-ommended in early stages of scale development to achieve inclusiveness [68]. We retained “physical abuse” it has been shown to be important to PCMC in extant literature and is common in many global contexts [13, 14, 22]. Similarly, we retained the items on “delivery support,” “delivery position choice,” “crowding,” and
“cleanliness,” as these are salient aspects of PCMC [22, 28, 34, 69–71]. Such inclusiveness is necessary to con-struct a measure that will be valid across multiple set-tings and countries. If these items do not work well in other settings, it may then be appropriate to consider ex-cluding them in future validations. On the other hand, we dropped items like differential treatment, stay against will, and auditory privacy that are important to respect-ful maternity care and PCMC because they had low fac-tor loadings in both samples in the initial analysis per the criteria we used. The distribution of these items likely contributed to the low loadings. Thus, even though these did not make it into the current version of the PCMC scale, they are still important to consider po-tentially as stand-alone questions in PCMC research as they may be more important in other settings.
We started off with several domains, which we knew to be closely interrelated, to ensure that we developed a comprehensive set of items. Thus, we expected that our items would represent a smaller number of factors than our original domains. While our factor analysis
Table 6Bivariate linear regression of person-centered maternity care score on global measures of satisfaction with maternity services
Coef. P-value 95% Conf. Interval
Level of Satisfaction
Dissatisfied (ref)
Neither satisfied nor dissatisfied 0.66 0.80 −4.33 5.66
Satisfied 10.83 0.00 6.84 14.82
Very satisfied 17.44 0.00 13.28 21.60
Constant 48.26 0.00 44.34 52.17
Rating of quality of care
Poor (ref)
Fair 3.00 0.28 −2.48 8.47
Good 12.67 0.00 7.76 17.57
Very good 16.46 0.00 11.47 21.46
Excellent 20.64 0.00 14.37 26.91
Constant 46.73 0.00 41.90 51.56
Will deliver in same place again
No (ref)
Yes, somewhat 0.07 0.97 −3.77 3.92
Yes, definitely 7.64 0.00 4.24 11.04
suggested a possibility of 2 to 4 sub-scales, the items did not load systematically into clean conceptual categories. This is expected given the correlation between the PCMC domains and related items. Also, the domains are overlapping rather than discrete. Thus whether“one is asked permission before procedures”is grouped under dignity and respect, communication, or autonomy is a subjective decision. This can be said of several of the items in the tool, although it is expected that there will be less disagreement as to whether these items consti-tute PCMC. Thus, to provide sub-scales that are prac-tical and theory driven, we came up with the three components drawing on the experience of care domains in the WHO quality of care framework for maternal and newborn health [24]. We then examined these sub-scales in further factor analysis to ensure that only items correlated with that component were included in the sub-scale. With few exceptions, the suggested items for each sub-scale load relatively well onto the sub-scales. These sub-scales however have lower reliability (alpha between 0.6 and 0.8) than the overall 30-item scale (alpha greater than 0.8). Thus the analysis provides stronger support for a unified PCMC scale. For practical purposes, however, the sub-scales may be more useful for identifying aspects of PCMC to target for quality improvement.
We examined the PCMC scale in both a rural and urban setting to assess differences in the two contexts. It is important to note that the majority of items have strong factor loadings (>0.3) in both rural and urban set-tings, suggesting that this 30-item scale works relatively well in multiple contexts. Some of the items, however, work better in the rural sample, while others work better in the urban sample. One potential reason for these dif-ferences is the distribution of the variables in the differ-ent settings. For example, very few responddiffer-ents in the urban reported physical abuse during their childbirth (approximately 2% said they experienced physical abuse), which could account for the poor loading with the other items. The distribution for the rural sample is slightly better, although still low; approximately 5% of respon-dents said they experienced physical abuse.
Another potential reason for the rural/urban differ-ence is the differdiffer-ences in the sampling approaches. First, the eligibility criteria for the urban sample included only women who delivered in the preceding week, while that for rural sample included women who delivered in the preceding 9 weeks. The mean PCMC score for women who were less than 1 week postpartum is higher than that of those greater than 1 week postpartum (67 com-pared to 59,p< 0.0001). This is consistent with studies that suggest that women are less likely to report negative experiences when interviewed immediately following de-livery, compared to when interviewed 5 to 10 weeks
postpartum [72]. This is potentially due to social desirabil-ity bias and the joy of having just delivered a baby. Second, all interviews for the urban sample were conducted in a health facility, whereas only about 40% of the rural inter-views were in a facility. The mean PCMC score for women who were interviewed in a health facility is slightly higher than that of those interviewed in the community (62 com-pared to 58, p = 0.0003). This is also unsurprising as women may not be willing to express their dissatisfaction with the care received while they are still within the health facility; they will be more comfortable talking about their experiences in their own home as opposed to a facility set-ting. Notwithstanding these differences in the sampling, the mean PCMC scores for the rural and urban sample was not significantly different (59 compared to 60,
p = 0.85). This suggests that this scale may be used to measure PCMC in facility-based samples as well as community-based samples of recently delivered women up to 9 weeks postpartum, and potentially beyond.
Aside from the differences in sampling, the findings may also reflect characteristics of respondents and broader social norms in rural versus urban settings. There were small but significant differences in age, edu-cation, and marital status, with the rural women more likely to be younger, married, and with less education. These are characteristics that could affect participant re-sponses. Moreover, expectations of care, which in turn affects satisfaction with care, [25, 28, 73] may differ be-tween urban and rural women. In addition, the health facilities from which women were recruited in the two settings may have contributed to the findings. For ex-ample, urban facilities are typically more crowded com-pared to rural settings. Therefore, policies and norms around support persons in urban settings may reflect the higher volume of patients and limited space in these facilities, reflecting that a larger proportion of urban women do not want a labor and delivery support person. That the scale worked reasonably well in these different situations suggests its potential applicability in other parts of Kenya, Africa, and potentially other developing countries and regions.
As in any research, there are a number of limitations to this study. First, our respondents are not generalizable to all women in Kenya, and the health facilities from which women were recruited are not nationally repre-sentative. In our urban sample for example, some inter-vention facilities were chosen based on their willingness to participate in future quality improvement interven-tions. This willingness may indicate organizational readi-ness to change and therefore may represent higher quality facilities. Other facilities were nominated by the County, which might indicate facilities identified to have problems that could benefit from quality improvement. Additionally, all facilities in the urban area were higher-level public facilities. This was a selection criterion for the facilities to ensure delivery volumes were high enough to achieve our sample size targets. We do not know how the PCMC measures will work in smaller health centers, clinics, or private health facilities in urban Kenya. While there was no restriction for the type of delivery facility in the rural sample, interviews that occurred in health facilities were conducted in facilities selected for an intervention to improve prematurity out-comes, which included quality improvement activities. These included both hospitals and health centers, but comprised specifically of high delivery volume facilities. Thus, women who delivered in these facilities, which have been primed for quality improvement, are overrep-resented in our sample. Validation of the PCMC scale in other contexts will help to assess its portability across settings.
Second, there are a number of items that have a “not applicable” response option. We included these items because they were conceptually very relevant to PCMC even if they did not apply to all respondents. Coding the not applicable category into the highest category (“all the time”) biases our results towards reporting higher levels of person-centered care. There is however no right or wrong way of addressing this challenge. If all“not ap-plicable” responses had been coded as “missing”, ap-proximately half of the urban sample would have been lost. Coding this category as missing on the “labor and delivery support” questions that had the largest propor-tion of respondents in the “not applicable” category (about 20% of combined sample), however, does not sig-nificantly change the findings. We avoided using imputa-tions to maintain the ease of interpreting our findings, and to provide a simple roadmap for others using the scale to deal with the“not applicable”categories.
In addition, 30 items could be considered too many items in a scale. While redundancy is recommended in early stages of scale development to be inclusive, it might be possible to develop a shorter version of the scale as it is used over time across settings, and re-searchers are able to identify which items perform best
across settings. For example, 44.7% of women in the urban setting did not want a support person during labor and 48.7% did not want a support person during delivery. While labor and delivery support is an import-ant issue in many settings, it may not be desired by all women for a variety of reasons [69–71, 74]. Further-more, during site visits to the facilities in urban settings, the study team became aware that labor and delivery rooms are oftentimes too crowded for women to have support persons other than facility staff in the room. We have retained delivery support, as well as crowding, in the current version of the tool, as we believe it is import-ant for women to have a support person if so desired. With more evidence from other settings, we could shorten the scale to include only items that are relevant to the majority of women in different settings.
Moreover, while our sub-scales were both theoretically and data-driven, theory sometimes weighed more. Fu-ture validations might therefore reconsider which items fit into which sub-scale. For example, we decided to re-tain the health facility environment items in the SC sub-scale because the separate HFE sub-sub-scale had low reli-ability, and we reasoned the HFE items are needed to provide supportive care. Most of the HFE items loaded well with other items in the SC sub-scale. There were however some items like “crowding” and “cleanliness,” which did not load well on the SC sub-scale across the settings: crowding loaded well in the urban sample, but not the rural sample, while cleanliness loaded well in the rural sample, but not urban sample. We have retained these items on the SC sub-scale as they are conceptually and empirically very relevant [75]. Future studies will help provide more empirical support for these sub-scales.
Conclusions
scale can also be administered before and after interven-tions to improve women’s experiences during child-birth—for needs assessments as well as for monitoring and evaluation of the interventions. Facility heads and health management teams could support periodic admin-istration of this tool to women receiving care in their facil-ities to assess the level of PCMC in their facilfacil-ities and to identify aspects of PCMC to target for quality improve-ment. Developing complementary person-centered scales for other reproductive health services, such as antenatal care and family planning, will help drive the agenda to im-prove person-centered reproductive health care as a means of improving reproductive health outcomes.
Additional file.
Additional file 1:Appendix 1.Distribution of person-centered mater-nity care variables. (DOCX 126 kb)
Abbreviations
CA:Communication and autonomy; DR: Dignity and respect; HFE: Health facility environment; KMO: Kaiser-Meyer-Olkin; PCMC: Person-centered maternity care; SC: Supportive care; WHO: World Health Organization
Acknowledgments
We will like to thank all the people who reviewed the items in the tool at various stages in its development and gave us feedback, including Sanghita Bhattacharyya, Aradhana Srivastava, Leah Kirumbi, Linet Ouma, Ruth Muia, Nerea Ojanga, Lucy Kanja, Nancy Mugosi, Linner Koech, Rahel Muchwana, Craig Cohen, Dilys Walker, Miriam Kupperman, Paula Tavrow, Beryl Akinyi Ogola, and Kajal Nitin. We are also grateful to all the members of the SPARQ, PTBI, and PQCC study teams, and especially Dominic Montagu for reviewing and giving us feedback on this manuscript and Katie Giessler for editorial review. Finally, we like to express our gratitude to all our data collectors and study participants in Kenya.
Funding
This work was a collaboration between the Perceived Quality of Care during Childbirth (PQCC) Study nested within the Kenya arm of the Preterm Birth Initiative (PTBi) Program, and the Strengthening People-centered Accessibil-ity, Respect, and Quality (SPARQ) project. The PQCC study is funded by the University of California, San Francisco PTBi transdisciplinary post-doctoral fel-lowship, which is in turn funded by the Bill and Melinda Gates Foundation [OPP1107312]; and Marc and Lynne Benioff. The SPARQ project is funded by the Bill and Melinda Gates Foundation [OPP1127467] and the David and Lucile Packard Foundation. The funders had no role in the study design, data collection and analysis, decision to publish, or preparation of the manuscript.
Availability of data and materials
The datasets analyzed for this manuscript are available from the corresponding author on reasonable request.
Authors’contributions
PA led the development of the tool, conceived the manuscript, conducted the analysis, and led the writing. ND, GG, and MS supported the
development of the tool and the writing of the manuscript. All authors read and approved the final manuscript.
Ethics approval and consent to participate
The proposal and study materials for the two projects that provide data for this manuscript were reviewed and approved by the UCSF Committee for Human Subjects research (IRB numbers 15-18,458 and 15-18,008) and the Kenya Medical Research Institute Scientific and Ethics Review Unit (protocol IDs KEMRI/SERU/CCR/039/3286 and non-KEMRI 526). All participants provided written informed consent prior to participation.
Consent for publication
Not applicable.
Competing interests
The authors declare that they have no competing interests.
Publisher’s Note
Springer Nature remains neutral with regard to jurisdictional claims in published maps and institutional affiliations.
Author details 1
School of Medicine, University of California, San Francisco, USA.2Innovations for Poverty Action, Nairobi, Kenya.3Fielding School of Public Health, University of California, Los Angeles, USA.
Received: 3 May 2017 Accepted: 8 September 2017
References
1. Alkema L, Chou D, Hogan D, Zhang S, Moller A-B, Gemmill A, et al. Global, regional, and national levels and trends in maternal mortality between 1990 and 2015, with scenario-based projections to 2030: a systematic analysis by the UN Maternal Mortality Estimation Inter-Agency Group. Lancet. 2016;387: 462–74.
2. WHO. Making pregnancy safer: the critical role of the skilled attendant. Jt. Statement. Geneva: WHO ICM FIGO; 2004.
3. Kinney MV, Kerber KJ, Black RE, Cohen B, Nkrumah F, Coovadia H, et al. Sub-Saharan Africa’s Mothers, Newborns, and Children: Where and Why Do They Die? PLoS Med. 2010;7:e1000294.
4. Friberg IK, Kinney MV, Lawn JE, Kerber KJ, Odubanjo MO, Bergh A-M, et al. Sub-Saharan Africa’s mothers, newborns, and children: how many lives could be saved with targeted health interventions? PLoS Med. 2010;7: e1000295.
5. Koblinsky M, Moyer CA, Calvert C, Campbell J, Campbell OMR, Feigl AB, et al. Quality maternity care for every woman, everywhere: a call to action. The Lancet [Internet]. 2016 [cited 2016 Sep 24]; Available from: http://linkinghub. elsevier.com/retrieve/pii/S0140673616313332
6. van den Broek NR, Graham WJ. Quality of care for maternal and newborn health: the neglected agenda. BJOG Int J Obstet Gynaecol. 2009;116(Suppl 1):18–21.
7. Graham WJ, Varghese B. Quality, quality, quality: gaps in the continuum of care. Lancet. 2012;379:e5–6.
8. Ceschia A, Horton R. Maternal health: time for a radical reappraisal. The Lancet [Internet]. 2016 [cited 2016 Sep 24]; Available from: http://linkinghub. elsevier.com/retrieve/pii/S0140673616315343
9. Souza JP, Gülmezoglu AM, Vogel J, Carroli G, Lumbiganon P, Qureshi Z, et al. Moving beyond essential interventions for reduction of maternal mortality (the WHO Multicountry Survey on Maternal and Newborn Health): a cross-sectional study. Lancet. 2013;381:1747–55.
10. Miller S, Abalos E, Chamillard M, Ciapponi A, Colaci D, Comandé D, et al. Beyond too little, too late and too much, too soon: a pathway towards evidence-based, respectful maternity care worldwide. The Lancet [Internet]. 2016 [cited 2016 Sep 24]; Available from: http://linkinghub.elsevier.com/ retrieve/pii/S0140673616314726
11. The White Ribbon Alliance. Respectful Maternity Care: The Universal Rights of Childbearing Women (Full charter) [Internet]. [cited 2017 Mar 28]. Available from: http://www.healthpolicyproject.com/index.cfm?ID= publications&get=pubID&pubID=46
12. Kinney MV, Boldosser-Boesch A, McCallon B. Quality, equity, and dignity for women and babies. The Lancet [Internet]. 2016 [cited 2016 Sep 24]; Available from: http://linkinghub.elsevier.com/retrieve/pii/ S0140673616315252
13. Abuya T, Warren CE, Miller N, Njuki R, Ndwiga C, Maranga A, et al. Exploring the Prevalence of Disrespect and Abuse during Childbirth in Kenya. PLoS ONE [Internet]. 2015 [cited 2015 Aug 31];10. Available from: http://www. ncbi.nlm.nih.gov/pmc/articles/PMC4401776/