Open Access
Research
Effects of low carbohydrate diets high in red meats or poultry, fish
and shellfish on plasma lipids and weight loss
Bridget A Cassady
1, Nicole L Charboneau
1, Emily E Brys
1, Kristin A Crouse
1,
Donald C Beitz
2and Ted Wilson*
1Address: 1Department of Biology, Winona State University, Winona, MN, USA and 2Department of Animal Science, Iowa State University, Ames,
IA, USA
Email: Bridget A Cassady - [email protected]; Nicole L Charboneau - [email protected]; Emily E Brys - [email protected]; Kristin A Crouse - [email protected]; Donald C Beitz - [email protected]; Ted Wilson* - [email protected]
* Corresponding author
Abstract
Background: Low carbohydrate diets (LCDs) have been demonstrated to be effective tools for promoting weight loss and an improved plasma lipid profile. Such diets are often associated with increased meat consumption, either poultry, fish, and shellfish (PFS), which are generally high in polyunsaturated fat (PUFA) or red meats (RM), generally high in saturated fat (SFA). The fatty acid profile and content of a diet may influence the plasma lipid profile of humans. This study examined whether the type of meat consumed could influence the outcome of an LCD.
Methods: Moderately obese subjects consumed two different LCDs as part of a weight loss regimen: 1) a diet high in foods of mammalian origin (RM) intended to contain more SFA, or 2) a diet high in PFS intended to contain more PUFA. Diet dependent changes in body weight, nutritional intake, and plasma lipids were evaluated during a 28 day study period.
Results: Both diets were associated with significant weight loss after 28 days, -5.26 ± 0.84 kg and -5.74 ± 0.63 kg for RM and PFS groups, respectively. The PFS diet was associated with a significantly higher intake of PUFA and cholesterol. Despite high cholesterol and fat intakes, neither diet was associated with significant changes in plasma cholesterol or the plasma lipoprotein cholesterol profile. While plasma triglycerides were reduced in both groups, the effect was only statistically significant for the PFS diet.
Background
Obesity is a primary risk factor for coronary heart disease (CHD) and mortality [1]. Between 2001 and 2002, 65.7 % of Americans were classified as clinically overweight or obese [2]. Presently, 29% of men and 24% of women claim to be attempting to lose weight or maintain previ-ously achieved weight losses [3]. Orthodox dietary recom-mendations seek to promote weight loss, weight control
or improved plasma lipid profiles by placing upper limits on the total intake of sugars, fat, and cholesterol [4,5]. The American Heart Association, for example, recommends that persons consume less than 300 mg cholesterol/day [4]. A fat intake of greater than 35 % of total calories has been suggested to increase saturated fat intake which, in theory, also makes avoidance of excess caloric intake
dif-Published: 31 October 2007
Nutrition & Metabolism 2007, 4:23 doi:10.1186/1743-7075-4-23
Received: 9 February 2007 Accepted: 31 October 2007
This article is available from: http://www.nutritionandmetabolism.com/content/4/1/23
© 2007 Cassady et al; licensee BioMed Central Ltd.
ficult [5]. The same guidelines suggest maintaining carbo-hydrate intake between 45 and 65% of total calories [5].
Low carbohydrate diets (LCD) are associated with a fat intake percentage that typically exceeds orthodox recom-mendations. LCDs represent a way to reduce caloric intake, promote weight loss, and reduce the atherogenic-ity of the plasma lipid profile. The meta-analysis of studies between January 1, 1980 and February 28, 2005 by Nord-mann et al [6] demonstrated that relative to low-fat energy restricted diets, LCDs have a better efficacy for weight loss promotion and improved plasma lipid profiles than low-fat diets during the first six months of administration [6]. LCDs have been demonstrated to lead to significant improvements in the plasma lipid profile and, presuma-bly, CHD risk [7-10]. The benefits of LCDs on the lipid profile have been shown to occur independently of weight loss [9,11].
LCDs are often referred to as 'ketogenic' because of the accumulation of ketone bodies in the plasma and urine that is observed when carbohydrate restriction is imposed. Effective weight loss with a calorie-restricted LCD does not absolutely require the establishment of ketosis, although detection of ketosis is often used as a biomarker for monitoring dietary compliance [12,13].
Increased cholesterol and saturated fatty acid (SFA) intake has been associated with increased CHD mortality [14]. In contrast, others have suggested that SFA limitations may be unwarranted, especially when considered in the con-text of a LCD [15]. Palmitic acid is a primary dietary SFA and tends to be hypercholesterolemic [16], though not if administered in the presence of linolenic acid [17]. Stearic acid is primarily obtained from beef fat [18] and increased stearic acid intake actually improves the lipid profile [16,18]. Diets high in polyunsaturated fatty acids (PUFA) of marine origin tend to decrease plasma triglycerides, improve the plasma cholesterol profile, and reduce the risk of CHD [18-20]. Fish and fish oils are primary sources of eicosapentaenoic acid and docosahexaenoic acid, the two primary protective n-3 oils [21]. These associations lead to the promotion of increased fish consumption as part of the American Heart Association's dietary recom-mendations for reducing CHD [4].
The content of SFA and PUFA in different foods varies greatly [22]. Food products derived from mammals (e.g. milk, cheese, and meats) tend to contain SFA to PUFA ratios of 11:1 to 4:1. Food products derived from poultry (especially eggs), fish (mainly cold water varieties) and shellfish (including shrimp) tend to have SFA to PUFA ratios of 3:1 or less. These two different food groupings have the potential to exert different effects on plasma trig-lycerides and lipoprotein cholesterol. Previous studies of
the LCD have not compared different types of foods with different lipid profiles for effects on weight loss and the plasma lipid profile.
The present study examined the dietary effects of two dif-ferent diets under free-living conditions encountered by typical dieters using an LCD. The LCD diets compared in this study were either high in foods of mammalian origin (red meats; RM) and presumed to be high in SFA, or high in poultry, fish, and shellfish (PFS) and presumed to be high in PUFA.
Methods
Subjects and design
Subjects were recruited for the study following ethical approval by the Winona State University Human Subjects Committee. Subjects were self-described as overweight, non-smokers between the ages of 30 and 50 years who were not currently taking cholesterol-lowering drugs. Sub-jects were required to refrain from alcohol for one week prior to the start of the study (January 10, 2005) and for the remainder of the 28 days of the study. Subjects were screened for eligibility by phone and 21 eligible subjects were invited to attend an orientation session during the week prior to the study. Eighteen individuals, 6 males and 12 females, participated in the study. The baseline body mass index of the 12 moderately obese persons who com-pleted the study was 31.71 ± 0.97 (kg/m2). The primary
motivation for study participation was achievement of desired weight loss. Subjects received no monetary com-pensation for their participation.
This study sought to determine the effect of a LCD com-posed of either RM (red meats or products of mammalian origin, and presumably containing more SFA) or PFS (poultry, fish and shellfish, and presumably containing more PUFA) on weight loss and plasma lipids. The study attempted to create conditions that would be similar to those encountered by typical free-living people attempt-ing to lose weight in a non-clinical atmosphere.
to exclude caffeinated beverages and other sweetened bev-erages from their diet. Alcohol intake was limited to no more than one drink per week. Foods high in soy protein were permitted for either group, although diet records revealed soy-products were seldom consumed by either group. Since PFS subjects expressed concern about being able or willing to avoid cheese (mammalian origin and high in saturated fat) for 28 days, no more than 3 oz of cheese per day was permitted for both groups as a way to improve dietary compliance. However, cow's milk was not permitted by either group. The subjects were ran-domly assigned to a LCD high in RM or PFS and for the following 28 days and the subjects of both groups were responsible for purchasing, preparing, and consuming the foods specific to their assigned group. At the instructional session, subjects were also shown how to maintain a food journal that would record daily food intake during the study.
Subjects were contacted by phone or e-mail one to three times per week in order to answer any questions about dietary compliance, food journal completion, and to pro-mote improved dietary compliance. Aerobic exercise was suggested as a means of promoting maximal weight loss, but no attempt was made to quantify subject physical activity during the study.
Following an overnight fast (≥ 9 hours; water only), sub-jects visited the laboratory between 6:00 and 8:00 AM on days 0, 7, 14, 21, and 28. During these visits subjects sub-mitted their food journals, were weighed, and provided with a new food journal for self-recording of daily food intake. Journals were used for monitoring dietary compli-ance and to provide subjects with feedback on what foods were and were not acceptable. After the interview, urine samples were collected and analyzed for the presence of ketones with Bayer Multistix 10 SG reagent strips. Urine samples were tested immediately to determine if subjects had reached a ketotic state. The presence of > 5 mg of ketones/dL was considered positive.
Plasma lipid analysis
Venous blood samples were collected on days 0 and 28 and centrifuged to obtain plasma which was evacuated with nitrogen gas, flash frozen in liquid nitrogen, and stored at -80°Celsius until analysis. At the conclusion of the study, plasma total cholesterol, LDL cholesterol, HDL cholesterol, and triglyceride concentrations were meas-ured in duplicate by using a Dade Behring Dimension RxL clinical chemistry analyzer and direct measurement (Deerfield, IL). The plasma fatty acid profile of day-28 plasma samples was generated to assess overall dietary compliance. Plasma was extracted using a modified Folch wet tissue lipid extraction [25]. Total lipids were esterified using acetyl chloride/methanol for 1 hour at 80°C [26]. A
temperature-programmed procedure was used [27] and fatty acids were identified by comparing the retention time with the GLC 461 standard purchased from Nu-chek-Prep (Elysian, MN). The fatty acid composition was calcu-lated using the peak areas on a percentage basis. Eleven plasma samples (RM = 4; PFS = 7) were found to be suit-able for plasma fatty acid analysis.
Nutritional analysis
Nutritional content of the two diets was analyzed using the weekly food diaries and the Interactive Healthy Eating Index (IHEI) dietary assessment tool [28]. Nutrient intake profiles for the 28-day study were created for each subject and the average nutrient intake between day 0 and 28 was calculated for each subject.
Statistical analysis
Collected data were analyzed by using the Microsoft Excel data analysis package for descriptive statistics and two-tailed Student's t-test for comparison between the two treatment groups (Microsoft Corporation, Redmond, WA). The Statistical Analysis Software (SAS) Program (8.0) was used to perform a repeated measures analysis for evaluating the significance of changes in weight across time within each group (SAS Institute, Cary, NC). All descriptive values were expressed as mean ± standard error of the mean (SEM).
Results
Subject attrition
Of the 18 persons who started the study (RM; n = 9 and PFS; n = 9), data collected from 12 subjects (RM; n = 5 and PFS; n = 7) were used in the final analysis. Data were not used from six subjects: one dropped out voluntarily, one was dropped when found to have been taking Lipitor for the control of blood lipids throughout the study, one was dropped due to taking large dose NSAIDs for an injury, two were dropped from the study because of gross dietary non-compliance, and one was dropped for failure to pro-vide a detailed dietary record.
Effect of diet on weight and ketones
Baseline body mass index (kg/m2) in the RM and PFS
Effect of diets on nutrient intake
Average carbohydrate intake of the RM and PFS groups was not significantly different at 61 ± 27 and 50 ± 22 g/ day, respectively. The intake of total calories, protein, fiber, total fat, SFA, and monounsaturated fat was also not significantly different between the two groups over the course of the 28-day study period (Table 2), although SFA intake did approach statistical significance. However, per-sons consuming the PFS diet did consume significantly more PUFA (p = 0.031) and cholesterol (p = 0.036) than persons consuming the RM diet.
Effect of diets on plasma fatty acids
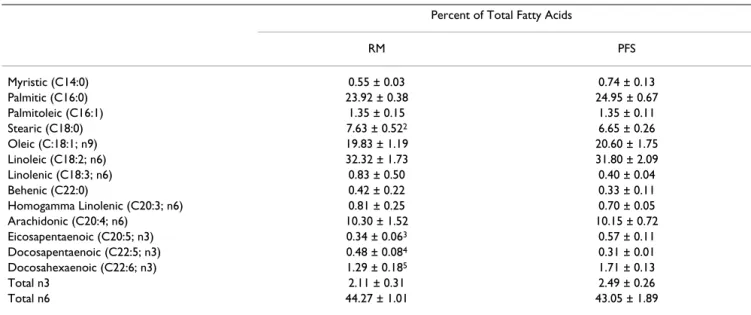
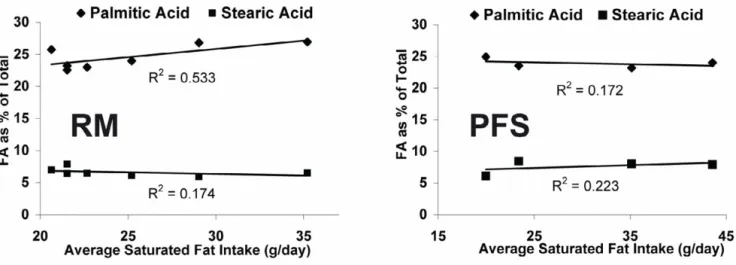
As a percentage of total plasma fatty acids, the consump-tion of a RM and PFS diet for 28 days was associated with differences in the plasma fatty acid profile (Table 3) A sta-tistically significant difference between the two groups was observed for docosapenaenoic acid (DPA; p = 0.051). A near significant difference between groups was observed for stearic acid (p = 0.071), eicosapentaenoic acid (EPA; p = 0.170) and docosahexaenoic acid (DHA; p = 0.095). The average SFA intake for each person during the 28 day study in the RM and PFS groups was not correlated with plasma palmitic and stearic acid, expressed as a percentage of total plasma fatty acids (Figure 2).
Effect of diet on plasma triglycerides and lipoproteins Consumption of PFS for 28 days was associated with a sig-nificant (p = 0.042) reduction in plasma triglycerides rel-ative to day 0 and a non-significant decline in plasma TG for RM consumers (p = 0.326) (Table 4). The changes in plasma total, LDL, and HDL cholesterol between day 0 and 28 were non-significant.
Discussion
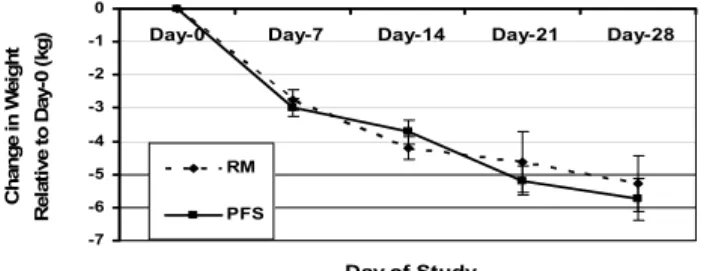
In this 28-day study of moderately obese persons, both the RM and PFS LCD effectively promoted significant weight loss (Table 1). Caloric intake of the two groups dif-fered by 68 Kcal/day. No significant difference in total weight loss was observed between the RM and PFS groups, -5.26 ± 0.84 and -5.74 ± 0.63 kg, respectively. Weight loss experienced by the RM and PFS groups in the current study was comparable to that observed on week four of other previous LCD studies [12,13,29,30].
The carbohydrate intake for both the RM and PFS groups was 17 ± 3.6 and 18 ± 2.5% of total calories, respectively, and significantly lower than the current USDA recom-mendation of 45–65% [5]. The degree of carbohydrate restriction in the current study was similar to some previ-ous studies [9,12] but greater than others [7,8,10,13,30] and greater than the target value of the Atkins induction phase [24].
Persons consuming the PFS diet had a significantly greater PUFA intake than those in the RM group (p = 0.036), although the difference in specific n-3 and n-6 PUFAs for the diets was not calculated. The SFA intake of the RM group was slightly elevated, relative to the PFS group. Per-sons in the RM group had a mean intake of SFA that was 32.42 ± 4.62 g/day and the SFA intake of the PFS group was 25.12 ± 2.01 g/day, this difference approached signif-icance (p = 0.137). In interviews with subjects prior to the start of the study, it was determined that cheese was a major element that subjects in both the RM and PFS groups strongly preferred to include in their diets. The investigators chose to permit controlled and documented cheese consumption in the PFS group in order to improve honest dietary reporting and compliance. In light of the high SFA content of cheese, it was not surprising that the
Body weight changes relative to starting weight during the consumption of a low-carbohydrate diets high in either red meat (RM) or poultry/fish/shellfish (PFS) for 28 days
Figure 1
Body weight changes relative to starting weight during the consumption of a low-carbohydrate diets high in either red meat (RM) or poultry/fish/shellfish (PFS) for 28 days. No sig-nificant differences between groups were observed at any given week, but there was a statistically significant effect by time P < 0.001.
-7 -6 -5 -4 -3 -2 -1 0
Day-0 Day-7 Day-14 Day-21 Day-28
Day of Study
C
hange i
n
W
e
ig
ht
Rel
at
ive t
o
Day-0 (
kg)
RM
PFS
Table 1: Absence or presence of urinary ketones (above 5 mg/dl) in urine samples for subjects consuming a low-carbohydrate diet for 28 day1
Treatment Ketones Day 0 Day 7 Day 14 Day 21 Day 28
RM Absent 5 1 1 1 1
Present 0 4 4 4 4
PFS Absent 7 2 2 2 2
Present 0 5 5 5 5
difference between the two groups for SFA intake only approached significance.
The day 28 plasma fatty acid profile of EPA, DHA, and DPA suggests that the RM and PFS groups were compliant with regards to consuming their assigned diets (Table 3). Two specific PUFAs that are indicative of PFS consump-tion are the n-3 marine oils EPA and DHA [21,31]. Plasma fatty acid levels of EPA and DHA in the PFS group were both greater than that observed in the RM group. The dif-ferences approached significance with p-values of 0.170 and 0.095 for EPA and DHA, respectively. Subjects con-suming the RM diet, which typically contained beef prod-ucts, would be expected to consume more of the
non-marine n-3 fatty acid DPA [32] and stearic acid [16,18]. The group-specific difference for DPA was significant (p = 0.051) and approached significance for stearic acid (p = 0.071). Figure 2 demonstrates that within the RM and PFS groups, when expressed as a percentage of the total, plasma palmitic or stearic acid was not tightly correlated with total SFA intake, suggesting that the control of the plasma levels of these two fatty acids is under predomi-nately metabolic, not dietary control.
The PFS diet resulted in the consumption of nearly twice the cholesterol (630 ± 95 mg/day) as members of the RM group (333 ± 39 mg/day). This high cholesterol intake was mostly attributable to shrimp and eggs consumed on
Table 3: Plasma fatty acid profile (percentage of total) following the consumption of a low-carbohydrate diet for 28 days1
Percent of Total Fatty Acids
RM PFS
Myristic (C14:0) 0.55 ± 0.03 0.74 ± 0.13
Palmitic (C16:0) 23.92 ± 0.38 24.95 ± 0.67
Palmitoleic (C16:1) 1.35 ± 0.15 1.35 ± 0.11
Stearic (C18:0) 7.63 ± 0.522 6.65 ± 0.26
Oleic (C:18:1; n9) 19.83 ± 1.19 20.60 ± 1.75
Linoleic (C18:2; n6) 32.32 ± 1.73 31.80 ± 2.09
Linolenic (C18:3; n6) 0.83 ± 0.50 0.40 ± 0.04
Behenic (C22:0) 0.42 ± 0.22 0.33 ± 0.11
Homogamma Linolenic (C20:3; n6) 0.81 ± 0.25 0.70 ± 0.05
Arachidonic (C20:4; n6) 10.30 ± 1.52 10.15 ± 0.72
Eicosapentaenoic (C20:5; n3) 0.34 ± 0.063 0.57 ± 0.11 Docosapentaenoic (C22:5; n3) 0.48 ± 0.084 0.31 ± 0.01 Docosahexaenoic (C22:6; n3) 1.29 ± 0.185 1.71 ± 0.13
Total n3 2.11 ± 0.31 2.49 ± 0.26
Total n6 44.27 ± 1.01 43.05 ± 1.89
1RM, Red meat (RM; n = 5); Poultry/fish/shellfish (PFS; n = 7) Carbohydrates (Carb); Cholesterol (Chol); Saturated fat (SFA); Polyunsaturated fat (PUFA); Monounsaturated fat. Data expressed as mean ± SEM;
2Statistically significant difference between treatments (p = 0.031)
3Approached statistically significant difference between treatments (p = 0.138) 4Statistically significant difference between treatments (p = 0.036)
Table 2: Average nutrient intake during the consumption of low-carbohydrate diets high in red meat or poultry/fish and shellfish for 28 days1
Diet Type Carb (g/day) Carb (% cal) Protein (g/day) Protein (% cal) Total Fat (g/day) Total Fat (% cal)
RM 62 ± 28 17 ± 3.6 106 ± 9 31 ± 1.7 82 ± 10 52 ± 2.7
PFS 50 ± 22 18 ± 2.5 101 ± 5 30 ± 1.0 77 ± 3.7 52 ± 2.4
Total Calories Chol (mg/day) SFA (g/day) PUFA (g/day) MUFA (g/day) Fiber (g/day)
RM 1410 ± 155 333 ± 392 32 ± 53 9.8 ± 2.04 32 ± 4 6.4 ± 1.0 PFS 1342 ± 30 630 ± 95 25 ± 2.0 16 ± 1.5 30 ± 1.8 6.5 ± 0.8
1RM, Red meat (RM; n = 5); Poultry/fish/shellfish (PFS; n = 7) Carbohydrates (Carb); Cholesterol (Chol); Saturated fat (SFA); Polyunsaturated fat (PUFA); Monounsaturated fat. Data expressed as mean ± SEM;
2Statistically significant difference between treatments (p = 0.031)
25 and 88% of all days, respectively. Subjects made these cholesterol-rich foods a staple of their self-purchased free-living diets because of taste preferences, familiarity, and product availability. Studies of human egg and shellfish consumption have suggested that cholesterol content has, at best, only a small impact on the plasma cholesterol pro-file [33-35]. Consumption of large amounts of choles-terol-rich eggs and shrimp by PFS subjects may have influenced the expected improvements in the plasma lipid profile that would be expected to accompany the observed weight loss [9,36]. The moderate degree of carbohydrate restriction observed in the current study may have been inadequate to produce the LCD induced changes in the plasma cholesterol profile associated with the previously described studies.
Subjects experienced a significant reduction in plasma triglycerides in the PFS group (p = 0.042) while plasma triglyceride reduction in the RM group was not significant (p = 0.326). Because the RM subjects began the study with
a plasma TG concentration that was generally lower than that of the PFS group they may have been less responsive to diet induced reductions in plasma triglycerides.
The total daily fiber intake recommendation of the Food and Nutrition Board is 38 and 25 g/day for men and women [37]. In the current study, fiber intake for RM and PFS subjects was 6.4 ± 1.1 and 6.5 ± 0.8 g fiber/day, respectively. It has been previously demonstrated that increased fiber intake as part of a LCD may improve potential reductions in LDL cholesterol, though it is not required for improvements in the plasma lipid profile [10].
Conclusion
This study determined that a 28 day LCD high in RM or PFS promotes a similar significant degree of weight loss. In spite of orthodox concerns about the impact of dietary cholesterol and saturated fat, no significant deleterious changes were observed to result from adherence to either
Table 4: Change in the plasma triglyceride and lipoprotein concentration following the consumption of a low-carbohydrate diet for 28 days1
Day Triglycerides (mmol/L) Total Cholesterol (mmol/L) LDL Cholesterol (mmol/L) HDL Cholesterol (mmol/L)
RM-0 1.04 ± 0.17 4.78 ± 0.35 2.84 ± 0.26 1.50 ± 0.13
RM-28 0.83 ± 0.11 4.47 ± 0.34 2.79 ± 0.22 1.31 ± 0.12
RM-Change -0.21 ± 0.19 -0.30 ± 0.15 -0.05 ± 0.14 -0.19 ± 0.05
PFS-0 1.27 ± 0.13 5.10 ± 0.31 3.18 ± 0.35 1.30 ± 0.14
PFS-28 0.87 ± 0.082 4.95 ± 0.31 3.33 ± 0.27 1.13 ± 0.10 PFS-Change -0.39 ± 0.10 -0.15 ± 0.23 0.15 ± 0.21 -0.17 ± 0.08
1RM, red meat; PFS, poultry/fish/shellfish; Mean ± SEM
2Statistically significant difference for triglycerides within PFS treatment between day 0 and 28 (p = 0.042)
Plasma levels of palmitic and stearic acid were not correlated with saturated fat intake as part of a 28 day low carbohydrate diet rich in red meat (RM) or poultry/fish/shellfish (PFS)
Figure 2
the RM or PFS diets, which were both high in total choles-terol and total fat. This study suggests that dire predictions about LCD effects are anachronistic.
Competing interests
The author(s) declare that they have no competing inter-ests.
Authors' contributions
BAC and NLC analyzed subject dietary records for nutri-tional intake data, performed statistical analysis of data, and prepared the initial manuscript. EEB and KAC recruited/organized subjects, collected physiological data, and prepared/handled blood samples. DCB supervised the plasma fatty acid analysis. TW designed and organized the study. BAC and TW prepared the final manuscript which was read and approved by all authors.
Acknowledgements
The authors wish to thank the Academic Affairs Office of Winona State University for financially supporting BAC, NLC, EEB, and KLC with under-graduate research grants used to support this research.
References
1. Must A, Spadano J, Coakley EH, Field AE, Colditz G, Dietz WH: The disease burden associated with overweight and obesity. JAMA 1999, 282:1523-9.
2. Hedley AA, Ogden CL, Johnson CL, Carroll MD, Curtin LR, Flegal KM: Prevalence of overweight and obesity among US chil-dren, adolescents, and adults, 1999–2002. JAMA 2004,
291:2847-50.
3. Serdula MK, Mokdad AH, Williamson DF, Galuska DA, Mendlein JM, Heath GW: Prevalence of attempting weight loss and strate-gies for controlling weight. JAMA 1999, 282:1353-8.
4. American Heart Association Nutrition Committee, Lichtenstein AH, Appel LJ, Brands M, Carnethon M, Daniels S, Franch HA, Franklin B, Kris-Etherton P, Harris WS, Howard B, Karanja N, Lefevre M, Rudel L, Sacks F, Van Horn L, Winston M, Wylie-Rosett J: Diet and life-style recommendations revision 2006: a scientific statement from the American Heart Association Nutrition Commit-tee. Circulation 2006, 114:82-96.
5. United States Department of Health and Human Services and Department of Agriculture Dietary Guidelines for Americans 6th edition. 2005 [http://www.healthierus.gov/dietaryguidelines]. 6. Nordmann AJ, Nordmann A, Briel M, Keller U, Yancy WS Jr, Brehm
BJ, Bucher HC: Effects of low-carbohydrate vs low-fat diets on weight loss and cardiovascular risk factors: a meta-analysis of randomized controlled trials. Arch Intern Med 2006, 166:285-93. 7. Sharman MJ, Kraemer WJ, Love DM, Avery NG, Gomez AL, Scheett TP, Volek JS: A ketogenic diet favorably affects serum biomar-kers for cardiovascular disease in normal-weight men. J Nutr 2002, 132:1879-85.
8. Volek JS, Sharman MJ, Gomez AL, Scheett TP, Kraemer WJ: An iso-energetic very low carbohydrate diet improves serum HDL cholesterol and triacylglycerol concentrations, the total cho-lesterol to HDL chocho-lesterol ratio and postprandial pipemic responses compared with a low fat diet in normal weight, normolipidemic women. J Nutr 2003, 133:2756-61.
9. Krauss RM, Blanche PJ, Rawlings RS, Fernstrom HS, Williams PT:
Separate effects of reduced carbohydrate intake and weight loss on atherogenic dyslipidemia. Am J Clin Nutr 2006,
83:1025-31.
10. Wood RJ, Fernandez ML, Sharman MJ, Silvestre R, Greene CM, Zern TL, Shrestha S, Judelson DA, Gomez AL, Kraemer WJ, Volek JS:
Effects of a carbohydrate-restricted diet with and without supplemental soluble fiber on plasma low-density lipopro-tein cholesterol and other clinical markers of cardiovascular risk. Metabolism 2007, 56:58-67.
11. Feinman RD, Volek JS: Low carbohydrate diets improve ather-ogenic dyslipidemia even in the absence of weight loss. Nutr Metab (Lond) 2006, 21;3:24.
12. Brehm BJ, Seeley RJ, Daniels SR, D'Alessio DA: A randomized trial comparing a very low carbohydrate diet and a calorie-restricted low fat diet on body weight and cardiovascular risk factors in healthy women. Clin Endocrinol Metab 2003,
88:1617-23.
13. Foster GD, Wyatt HR, Hill JO, McGuckin BG, Brill C, Mohammed BS, Szapary PO, Rader DJ, Edman JS, Klein S: A randomized trial of a low-carbohydrate diet for obesity. N Engl J Med 2003,
348:2082-90.
14. Kromhout D, Menotti A, Bloemberg B, Aravanis C, Blackburn H, Buzina R, Dontas AS, Fidanza F, Giaipaoli S, Jansen A, Karvonen M, Katan M, Nissinen A, Nedeljkovic S, Pekkanen J, Pekkarinen M, Punsar S, Rasanen L, Simic B, Toshima H: Dietary saturated and trans fatty acids and cholesterol and 25-year mortality from coro-nary heart disease: the Seven Countries Study. Prev Med 1995,
24:308-15.
15. Volek JS, Forsythe CE: The case for not restricting saturated fat on a low carbohydrate diet. Nutr Metab (Lond) 2005, 2:21. 16. Grundy SM: Influence of stearic acid on cholesterol
metabo-lism relative to other long-chain fatty acids. Am J Clin Nutr 1994, 60:986S-990S.
17. French MA, Sundram K, Clandinin MT: Choelsterolemic effect of palmitic acid in relation to other dietary fatty acids. Asia Pac J Clin Nutr 2002, 11(Suppl 7):S401-S407.
18. Denke MA: Role of beef and beef tallow, an enriched source of stearic acid, in a cholesterol-lowering diet. Am J Clin Nutr 1994:1044-1049.
19. Breslow JL: n-3 fatty acids and cardiovascular disease. Am J Clin Nutr 2006:1477-1482.
20. Hodson L, Skeaff CM, Chisholm WA: The effect of replacing die-tary saturated fat with polyunsaturated or monounsatu-rated fat on plasma lipids in free-living young adults. Eur J Clin Nutr 2001, 55:908-15.
21. Kris-Etherton PM, Taylor DS, Yu-Poth S, Huth P, Moriarty K, Fishell V, Hargrove RL, Zhao G, Etherton TD: Polyunsaturated fatty acids in the food chain in the United States. Am J Clin Nutr 2000,
71:179S-88S.
22. United States Department of Agriculture Nutrient Data Lab 2004 [http://www.nal.usda.gov/fnic/foodcomp/search/]
23. Sanders L, Page K, Bravatta D, Brainerd M: Diets and exercise pro-grams for weight loss. In Nutritional Health: Strategies for Disease Prevention Edited by: Temple NJ, Wilson TW, Jacobs DR. Totowa, NJ: Humana Press; 2006:239-260.
24. Atkins RC: The Atkins Essentials. N.Y.: Harper Collins Publishing Inc; 2004.
25. Folch J, Lees M, Sloane Stanley GH: A simple method for the iso-lation and purification of total lipids from animal tissues. J Biol Chem 1957, 226:497-509.
26. Christie WW: The preparation of alkyl esters from fatty acids and lipids. In Topics in Lipid ChemistryVolume 3. Edited by: Gunstone FD. London: Logos Press; 1972:171-197.
27. Sehat N, Kramer JKG, Mossoba MM, Yurawecz MP, Roach JAG, Eulitz K, Morehouse KM, Yu Y: Identification of Conjugated Linoleic Acid Isomers in Cheese by Gas Chromatography, Silver Ion High Performance Liquid Chromatography and Mass Spec-tral Reconstructed Ion Profiles. Comparison of Chromato-graphic Elution Sequences. Lipids 1998, 33:963-971.
28. United States Department of Agricultural Center for Nutri-tion Policy and PromoNutri-tion. Interactive Healthy Eating Index 2005 [http://www.usda.gov/cnpp/healthyeating.html]
29. Westman EC, Yancy WS, Edman JS, Tomlin KF, Perkins CE: Effect of 6-month adherence to a very low carbohydrate diet pro-gram. Am J Med 2002, 113:30-6.
30. Noakes M, Foster PR, Keogh JB, James AP, Mamo JC, Clifton PM:
Comparison of isocaloric very low carbohydrate/high satu-rated fat and high carbohydrate/low satusatu-rated fat diets on body composition and cardiovascular risk. Nutr Metab (Lond) 2006, 3:7.
31. Harris WS: n-3 fatty acids and serum lipoproteins: human studies. Am J Clin Nutr 1997:1645-1654.
Publish with BioMed Central and every scientist can read your work free of charge
"BioMed Central will be the most significant development for disseminating the results of biomedical researc h in our lifetime."
Sir Paul Nurse, Cancer Research UK
Your research papers will be:
available free of charge to the entire biomedical community
peer reviewed and published immediately upon acceptance
cited in PubMed and archived on PubMed Central
yours — you keep the copyright
Submit your manuscript here:
http://www.biomedcentral.com/info/publishing_adv.asp
BioMedcentral
33. Connor WE, Lin DS: The effect of shellfish in the diet upon the plasma lipid levels in humans. Metabolism 1982, 31:1046-51. 34. Childs MT, Dorsett CS, King IB, Ostrander JG, Yamanaka WK:
Effects of shellfish consumption on lipoproteins in normolip-idemic men. Am J Clin Nutr 1990, 51:1020-7.
35. McNamara DJ: Eggs and heart disease risk: perpetuating the misperception. Am J Clin Nutr 2002, 75:333-5.
36. Cordero-MacIntyre ZR, Lohman TG, Rosen J, Peters W, Espana RC, Dickinson B, Reid PM, Howell WH, Fernandez ML: Weight loss is correlated with an improved lipoprotein profile in obese postmenopausal women. J Am Coll Nutr 2000, 19:275-84. 37. Food and Nutrition Board (FNB) Dietary Reference Intakes
for Energy, Carbohydrate, Fibre, Fat, Fatty Acids, Choles-terol, Protein, and Amino Acids (Macronutrients) (2005)