O R I G I N A L R E S E A R C H
Open Access
New protection scheme for internal fault
of multi-microgrid
Fan Zhang and Longhua Mu
*Abstract
Multi-microgrids have many new characteristics, such as bi-directional power flow, flexible operation and variable fault current consisting of the different control strategy of inverter interfaced distributed generations (IIDGs), which all present challenges in multi-microgrid protection. In this paper, the current and voltage characteristics of different feeders are analyzed considering faults at different locations of the multi-microgrid. Based on the voltage and current distribution characteristics of the line parameters, a new protection scheme for the internal faults of multi-microgrids is proposed, which takes the change of phase difference and amplitude of measured bus admittances as the criterion. This proposed scheme has high sensitivity and reliability, is based on a simple principle, and can be easily adjusted. Simulation results using PSCAD/EMTDC verify the correctness and effectiveness of the protection scheme.
Keywords:Microgrid, Multi-microgrid, Measured admittance, Protection scheme
1 Introduction
With increased energy demand and pressure to reduce emissions, microgrids have gradually become a hot re-search topic in power systems [1]. A microgrid is a medium or low-voltage power system, which consists of distributed generations (DGs), energy storage devices, en-ergy conversion devices, loads, and corresponding super-vision and protection equipment [2, 3]. Multi-microgrids are a new concept of distributed generation networks and connect microgrids that are geographically adjacent to each other [4–6] Developing multi-microgrids can help to implement energy complement in different operating con-ditions among various microgrids, and decrease difficul-ties in system scheduling. Furthermore, in certain control strategy and energy optimization management, multi-microgrids can improve the self-healing ability of power networks, ensuring continuous power supply to important consumers and increased network reliability. Thus, deve-loping multi-microgrids can help promote better appli-cations based on the present advantages of microgrids.
One of the key enabling technologies of the multi-microgrid is the protection scheme. The protection scheme of a traditional distribution network, including instanta-neous trip current protection and overcurrent protection,
was designed based on distinct fault features such as the unidirectional power flow and the high level of the fault current. In this scheme, protection selectivity is achieved by time-delay cooperation. Unlike traditional distribution net-works where there is only unidirectional power flow, there will be bi-directional power flow between the power grid and the multi-microgrid, and among the sub-microgrids. In addition, the DGs’currents are sometimes restricted by a fault current limiter [7,8], whereas the fault level of multi-microgrids is usually very low [9, 10]. Given all these factors, the protection scheme of traditional distribution networks cannot be simply transplanted into the multi-microgrid systems. Therefore, one major issue faced by researchers is how to design a protection system for multi-microgrids based on the real working condition.
At present, research on the protection of multi-microgrids is still at its early stage, however, some achievements have been made in the field. A protection scheme for island ope-rated medium-voltage microgrids without the need for high-speed communication was proposed in [11]. The pro-posed scheme is based on the usage of an admittance related start value and is applicable to both short-circuit and earth-fault protections, as well as to both inverter-based and directly connected synchronous generator based DG units. To solve the issue of conventional distribution network pro-tections not being satisfactory to the requirements of micro-grids without the aid of communication technology, an
© The Author(s). 2019Open AccessThis article is distributed under the terms of the Creative Commons Attribution 4.0 International License (http://creativecommons.org/licenses/by/4.0/), which permits unrestricted use, distribution, and reproduction in any medium, provided you give appropriate credit to the original author(s) and the source, provide a link to the Creative Commons license, and indicate if changes were made.
* Correspondence:lhmu@tongji.edu.cn
inverse-time low-impedance protection scheme based on load impedance was presented in [12]. Although this pro-tection scheme can identify the faulted sections, it cannot locate the concrete branch feeders. A protection method utilizing the total admittance of the protected line segment was presented in [13]. Since the line length in active distri-bution networks is always short, the protection can only cover a very small part of the segment. An alternate protec-tion and control scheme for microgrids with converter inter-faced micro sources was proposed in [14], where a new inverse time relay characteristic was put forward by using the measured admittance of the protected line. The pro-posed protection and control scheme consider both grid connected and autonomous operation of the microgrid. However, the existence of harmonic and the transient behavior of the current introduce some problems on relay accuracy. Based on superimposed reactive energy and Hilbert transform, a protection scheme for microgrids was proposed in [15]. However, the fault resistance can present a considerable error on relay reading and accuracy. Meanwhile, the specific control strategy of DGs was not been considered.
In summary, the existing schemes cannot effectively solve multi-microgrids protection. There are two main problems: First, the control strategies of the DGs which have a large impact on the analysis of fault characteris-tics [16, 17], are ignored in most protection schemes. Second, the majority of the existing work focus on a sin-gle microgrid, with the interconnection and interaction among the adjacent microgrids not taken into consider-ation. For multi-microgrids, if each sub-microgrid is treated as a single DG, there is a bi-directional power exchange between itself and the outside zone. However, for a DG in a microgrid or active distribution network, the power exchange can only be from the DG to the out-side zone, which is unidirectional. Therefore, the fault characteristics differ among the multi-microgrids, the active distribution networks, and the microgrids.
This paper proposes a new protection scheme for internal faults of multi-microgrids, which considers the control strategies of the DGs as well as the interconnec-tion and interacinterconnec-tion among the adjacent microgrids. A measured admittance scheme is proposed that analyzes the current and voltage vector graph before and after the fault. Fault characteristics of multi-microgrids can then be obtained and used to identify the faulty feeders. Finally, simulation results using PSCAD/EMTDC verify the correctness and effectiveness of the proposed protec-tion scheme.
2 Microgrid structure and a new algorithm for fault location
Multi-microgrid is an emerging concept, and as shown in Fig. 1, each sub-microgrid is connected to
the multi-microgrid at the point of common coupling (PCC). PCC is also the connection hub between the sub-microgrid and the distribution network. According to the location of PCC, it can be divided into three types: the distribution network layer PCC (DNPCC), the multi-microgrid layer PCC (MPCC) and sub-multi-microgrid layer PCC (SPCC). As shown in Fig. 1, DNPCC consists of DNPCC0–1, MPCC consists of MPCC1–4 and the SPCC consists of SPCC1–5. A multi-microgrid usually has two typical structures: radial structure and looped structure. If MPCC3 or MPCC4 is open, it is a radial structure, whereas when MPPC3 and MPCC4 are closed, it is a looped structure. Most of the existing multi-microgrid studies focus on the medium or low-voltage radial structure [18,19].
As shown in Fig.1, multi-microgrids are connected to the distribution network through step-up transformers. In low-voltage side, there are several AC microgrids with different energy structures and load characteristics. The integration standard of a multi-microgrid follows the principles of m sub-microgrids interconnected together at below 35 kV voltage level with the goal to achieve maximal flow optimization efficiency and minimal power failure probability. The multi-microgrid that consists of m sub-microgrids is connected to the distribution net-work with n interfaces. The sub-microgrids in the multi-microgrid are usually connected together in series and parallel, and are then accessed by the distribution net-work. This leads to the interface numbers usually being lower than the number of the sub-microgrids, i.e. n < m. As shown in Fig. 1, Sub-microgrids 1, 2 and 3 are in series connection, and Sub-microgrids 4 and 5 are also in series connection. The two series are then connected to the distribution network, and thus, in this example n= 2 and m = 5.
When MPCC3 or MPCC4 is open, the multi-microgrid has similar structure to a traditional radial distribution system, though some differences exist. In the multi-microgrid, each sub-microgrid can be regarded as a protection zone, in which there exists bidirectional power exchange between the sub-microgrid and the outside zone. However, for the traditional radial distribution system, the power ex-change is unidirectional from the distribution system to the outside zone. The connection and disconnec-tion of sub-microgrids in the multi-microgrid, and the connection and disconnection of DGs or control-lable loads in each of the sub-microgrids will change topology of the multi-microgrid leading to variable operation modes. Therefore, the fault characteristics differ between the multi-microgrid and traditional radial distribution system.
multi-microgrid can be achieved. The multi-multi-microgrid has the following three operation modes.
(1) When there is no fault, it operates in grid-connected mode.
(2) If a fault occurs in the distribution network, the multi-microgrid changes into islanded mode. (3) For the internal fault of the multi-microgrid, the
faulty sub-microgrid will be disconnected and the healthy ones remain operational in grid-connected mode.
A simplified diagram of Fig.1 is shown as Fig.2when MPCC3–4 are open. For grid-connected operation, SPCC1 to SPCC5 are closed. This paper mainly dis-cusses the protection scheme for internal faults of the multi-microgrid with radial structure in grid-connected mode, where DGs are under PQ control strategy. The
feeders in the multi-microgrid are divided into the following two categories.
(1) The double-terminal feeder: the tie lines between the sub-microgrids (such as feeders AB, BC, CD, EF, FG), and the tie lines between two buses (such as the feeders HM, NQ, etc.);
(2) The single-terminal feeder: the feeders connecting to DGs (called DG feeders in this paper) including feeders L1, L3, and etc., and the feeders connecting to loads (called load feeders) including feeders L2, L4, and etc.
As seen in Fig. 2, when faults occur in the double-terminal feeder BC and single-double-terminal feeders L3 and L2, the change of measured bus admittances before and after the fault occurrence are analyzed, and are used to identify fault feeder selection criterion.
For analysis, a simplified line diagram is shown in Fig. 3. Set the forward direction of current from bus to feeder, and denote U_X, I_X,GXandU_1X, _I1X,G1Xas the voltages, currents and measured admittances of X ter-minal before and after the fault occurrence, respectively, the power flow change ofX terminal can be defined into four situations.
The phase and phase difference of pre- and post-fault measured admittances ofXterminal are:
Δφ1¼ arg Gð Þ ¼X arg _IX
−arg U_X
ð1Þ
Δφ2¼ arg Gð 1XÞ ¼ arg I_1X
−arg U_1X
ð2Þ
ΔφX¼Δφ2−Δφ1 ð3Þ where arg(.) is the symbol of phase angle. ΔφX is the phase difference of the pre- and post-fault measured
admittances ofX terminal. All the phase is converted to the range from−90° to 270°.
Situation (1): Both the pre- and post-fault current ofX terminal are in forward direction and do not change. The current and voltage vector graphs are shown in Fig.4.
It is seen from Fig.4that:
−90o≤Δφ1≤0o
−90o≤Δφ2≤0o
ð4Þ
Thus,
−90o≤ΔφX≤90o ð5Þ
Situation (2): Both the pre- and post-fault current ofX terminal are in reverse direction and do not change. The current and voltage vector graph is shown in Fig.5.
It is known from Fig.5that: Fig. 2Simplified structure of multi-microgrid system
Fig. 3Current direction of a simplified line
90o≤Δφ1≤180o
90o≤Δφ2≤180o
ð6Þ
Thus,
−90o≤ΔφX≤90o ð7Þ
Situation (3): The pre-fault current direction of X terminal is forward, but becomes reverse direction after the fault occurrence. The current and voltage vector graphs are shown in Fig.6.
It is known from Fig.6that:
−90o≤Δφ1≤0o
90o≤Δφ2≤180o
ð8Þ
Thus,
90o≤ΔφX≤270o ð9Þ
Situation (4): The per-fault current of Xterminal is in reverse direction, but becomes forward direction after the fault occurrence. The current and voltage vector graph is shown in Fig.7. It is known from Fig.7that:
90o≤Δφ1≤180o
−90o≤Δφ2≤0o
ð10Þ
Thus,
−270o≤ΔφX≤−90o ð11Þ
According to the phase conversion principle, the phase difference in (11) changes to:
90o≤ΔφX≤270o ð12Þ
Based on the above analysis, the phase difference change information of the pre- and post-fault measured admittances ofXterminal is shown in Table1.
3 Fault analysis for multi-microgrid with radial structure
3.1 Fault at double-terminal feeder
3.1.1 Fault analysis for the fault double-terminal feeder The analysis for fault occurring at the double-terminal feeder uses the F1 fault in line BC as an example. In normal operation, the power flow of feeder BC consists of the following two situations.
(a) The load demand of Sub-microgrids 4 and 5 is greater than the generation capacity of DGs, and thus the power flow is fromBterminal toC terminal.
(b) The load demand of Sub-microgrids 4 and 5 is less than the generation capacity of DGs, and thus the power flow is fromCterminal toBterminal.
Situation
(a): UB_ , IB_ and U_1B, I_1B are the pre- and post-fault voltages and currents of B terminal in line BC, respec-tively. For B terminal, it is in the upstream of the fault point and is connected with the distribution network, so the voltage will largely remain unchanged when the fault occurs but the current will significantly increase. The variation of pre- and post-fault current and voltage are:
_
U1B ≤ U_B ð13Þ
_
IB ≤ I_1B ð14Þ
The pre- and post-fault measured admittances of B terminal are:
GB¼I_B=U_B ð15Þ
G1B ¼I_1B=U_1B ð16Þ Fig. 5The pre- and post-fault current and voltage vector
graphs of X terminal of situation (2)
Fig. 6The pre- and post-fault current and voltage vector graphs of X terminal of situation (3)
Fig. 7The pre- and post-fault current and voltage vector graphs of X terminal of situation (4)
Table 1Phase difference change information of measured admittances ofXterminal before and after the fault
Direction Forward-Forward Situation (1)
Reverse-Reverse Situation (2)
Forward-Reverse Situation (3)
Reverse-Forward Situation (4) Measured
Admittance
Combining (13)–(16), it is known that the measured admittance amplitudes have the following relationship:
G1B
j j>>j jGB ð17Þ
Both the pre- and post-fault current directions of B terminal are in the forward direction. It is also known from Table 1 that the phase difference of measured admittances of B terminal is:
−90o≤ΔφB≤90o
After the fault occurrence, the DGs in the downstream of Cterminal cannot provide enough short circuit capacity, so the voltage ofCterminal will drop significantly. Addition-ally, the DGs in the sub-microgrids are inverter interfaced distributed generators (IIDG), which are usually under PQ control strategy with low voltage ride-through capability. When the voltage of the fault point drops significantly, the output current of the IIDG may reverse and decrease in amplitude [20]. Thus, the traditional current protection scheme is probably invalid in this case. In addition, if the DG penetration reaches a certain level, the protection co-operation will also be interfered. Meanwhile, the amplitude change of the measured pre- and post- fault admittances of Cterminal cannot be estimated directly with (15) and (16).
The pre-fault current ofCterminal is in reverse direc-tion, and when the fault occurs, it changes to forward direction. Thus, the phase difference of measured admit-tances ofCterminal is:
90o≤ΔφC≤270o
Situation (b): In this case, the change information of measured admittance amplitude of B terminal is the same as (17). Before the fault, the current ofBterminal is in reverse direction and when the fault occurs, it changes to forward direction. Thus, the phase difference of measured admittances ofBterminal is:
−90o≤ΔφB≤90o
The pre- and post-fault current of C terminal are both in forward direction. Thus, the phase difference of measured admittances of C terminal is:
−90o≤ΔφC≤90o
3.1.2 Fault analysis for the healthy double-terminal feeder For fault occurrences in F1, the analysis for healthy double-terminal feeders uses line AB as an example. Before the fault, the power flow of line AB consists of the following two situations.
(a) The load demand of Sub-microgrids 3, 4 and 5 is greater than the generation capacity of DGs,
and thus the power flow is fromAterminal toBterminal.
(b) The load demand of Sub-microgrid 3, 4 and 5 is less than the generation capacity of DGs, and thus the power flow is fromBterminal toAterminal.
Situation (a):GA,G1Aand GB1, G1B1are the pre- and post-fault measured admittances of A and B terminals, respectively. In this case, A and B terminals are in the upstream of the fault point, and are connect to the distribution network. Therefore, the voltage will remain unchanged when the fault occurs, but the current will increase significantly. Thus, there are:
G1A
j j>>j jGA
G1B1
j j>>jGB1j
Both the pre- and post-fault current ofAterminal are in forward direction, while for Bterminal, they are both in reverse direction. Thus, the respective phase diffe-rences of measured admittances ofAandBterminal are:
−90o≤ΔφA≤90o
−90o≤ΔφB≤90o
Situation (b): A and B terminals are in the upstream of the fault point, so there are:
G1A
j j>>j jGA
G1B1
j j>>jGB1j
The pre-fault current ofAterminal is in reverse direc-tion, whereas it is in forward direction for B terminal. When the fault occurs, the current of A terminal changes to forward direction and B terminal becomes reverse direction. Thus, the respective phase differences of measured admittance ofAandBterminal are:
90o≤ΔφA≤270o
90o≤ΔφB≤270o
The power flow analysis for other healthy double-terminal feeders is similar to feeder AB, and thus is not covered here.
3.1.3 Fault analysis for single-terminal feeder
In this case, the current and voltage remain unchanged, and thus the measured admittance amplitudes will not change after the fault occurrence.
For the DG feeders, the current directions are from the DGs to the upstream bus, and all are in the reverse direction. Thus, the phase difference of measured admittances is:
−90o≤ΔφDG≤90o
forward direction. So the phase difference of measured admittances is:
−90o≤ΔφLoad≤90o
3.2 Fault occurs in single-terminal feeder
The analysis for fault occurrence in a single-terminal feeder uses the F2-fault of feeder L3 and F3-fault of feeder L2 as examples.
3.2.1 Fault at F2
For faults occurring in F2, (Fig.2), DG2 is connected to feeder L3, and P terminal is the access point that L3 connects with the upstream bus. The pre-fault current direction of P terminal is from DG2 to the upstream bus, and is in reverse direction. After the fault occu-rrence, it changes to forward direction from the up-stream bus to the fault point. Thus, the phase difference of measured admittances is:
90o≤ΔφP≤270o
The power flow analysis for the other healthy feeders is the same as the feeder in Section 3.1 so not repeated here.
3.2.2 Fault at F3
For fault at F3 (Fig.2), load2 is connected to feeder L2, andKterminal is the access point that L2 connects with the upstream bus. The pre- and post-fault current direc-tions ofKterminal are all in forward direction from the upstream bus to the fault point. Thus, the phase diffe-rence of measured admittances is:
−90o≤ΔφK≤90o
Kterminal is in the upstream of the fault point, so the post-fault measured admittance amplitude ofKterminal will increase significantly. For the other feeders that con-nect with the loads, the current and voltage will remain unchanged, and thus the post-fault measured admittance amplitude will not change.
The power flow analysis for the other feeders is similar to the feeders in Section3.1, so not repeated here.
4 Protection scheme for internal fault of multi-microgrid
4.1 Criterion for fault location
By analyzing the change of the measured admittances before and after the fault occurrence, the following results are obtained.
(1) Fault occurs in double-terminal feeder
The phase differences of measured admittances of the two terminals are in the ranges of 90°–270° and− 90°−90°, respectively. For the healthy double-terminal feeders, the phase differences of the two terminals are both in the range of either 90°–270° or−90°−90°. For the single-terminal feeders, the phase difference range is in −90°−90°.
(2) Fault occurs in single-terminal feeder
If the fault occurs in the DG feeders, the phase difference of measured admittances is in the range of 90°–270°. For the double-terminal feeders, the phase dif-ference is in the range of either 90°–270° or−90°−90°. For the other single-terminal feeders, the phase difference range is−90°−90°.
If the fault occurs in the load feeders, the phase diffe-rence of double-terminal feeders is in the range of either 90°–270° or−90°–90°. For the single-terminal feeders, the phase difference range is−90°–90°.
From the above analysis, a solution can be easily obtained to identify the faulty feeder only by the change of the phase difference of measured admit-tances for faults in either the DG feeders or double-terminal feeders.
However, for faults in the load feeders, there is no obvious fault feature for the change of the phase dif-ference of measured admittances, as they are in the same range before and after the fault. Based on the above analysis, the load feeders only have connected loads and their power is provided only by the up-stream buses. When the fault occurs, there will be large increase in current but significant drop in vo-ltage. Thus, the measured admittance amplitude will increase significantly and can be selected as the fault criterion for the load feeders.
It can be seen in Table 2 that regardless of the fault location, the measured admittance amplitude of the fault feeder always increases. Thus, the measured admittance amplitude is selected as the starting criterion as:
Gi>2GR
whereGRandGiare the measured admittance amplitudes of feeders before and after fault occurrence, respectively.
Overall, the following fault criteria are used to detect the internal fault of multi-microgrids.
Criterion 1: DG Feeders. The phase differenceΔφ1of measured admittances is:
Criterion 2: Double-terminal feeder. The phase differences
Δφ2andΔφ3of measured admittances are:
−90o≤Δφ2≤90o
90o≤Δφ3≤270o
Criterion 3: Load feeders. The measured admittance amplitude of load feeders increase significantly after the fault, and exceeds a particular thresholdGset, which is 4–5 times bigger than that before fault occurrence.
4.2 The protection scheme of multi-microgrid
The flow chart of protection scheme is shown in Fig.8 and the basic process is described as follows:
(1) When the start criterion is satisfied, the phase difference of measured admittancesΔφ1of the DG feeders is calculated. When Criteria 1 is met, the DG feeder is judged as the fault line.
(2) If Criteria 1 is not satisfied, the phase differences of measured admittancesΔφ2andΔφ3of double-terminal feeders are calculated. When Criteria 2 is met, the feeder is judged as the fault line.
(3) If Criteria 2 is not met, the measured admittance amplitude of load feeders is calculated. When Criteria 3 is met, the load feeder is judged as the fault line.
(4) Protection activates and the fault feeder is removed.
The measured information only contains the values of voltage and current before and after fault occurrence. So the disposal and transmission burden of data is low and the communication requirement is reduced. Besides, the lines in multi-microgrids are usually very short, so real-time data transfer can be achieved relatively easily. Therefore, the protection speed can be satisfied. At present, many signal acquisition and protection units have communication interfaces and thus, it is convenient to integrate these devices into the protection system.
Meanwhile, the measured admittance amplitude of the feeders satisfying the starting criterion Gi is determined as the suspected faulty feeders. Then, the fault criterion of suspected faulty feeders is calculated. Only the feeder which satisfies the fault criterion is determined as the faulty line. The protection scheme only needs upload the information of the suspected feeders, and the traffic for decision-making is therefore reduced.
4.3 Applicability analysis for the looped structure multi-microgrid
When MPCC3 and MPCC4 are closed, the multi-microgrid is of looped structure. The double-terminal Fig. 8Flow chart of the protection scheme
Table 2Change information of measured admittance
Fault Position F1 F2 F3
Measured Admittance Δφ │Gi│ Δφ │Gi│ Δφ │Gi│
Double-terminal Feeder
Fault 90°–270° and−90°–90°
Increases Significantly
─ ─ ─ ─
Healthy 90°–270° or−90°–90°
Basically Unchanged
90°–270° or−90°–90°
Basically Unchanged
90°–270° or−90°–90°
Basically Unchanged
Single- terminal Feeder
DG Feeder Fault ─ ─ 90°–270° Increases
Significantly
─ ─
Healthy –90°–90° Basically Unchanged –
90°–90° Basically Unchanged –
90°–90° Basically Unchanged
Load Feeder Fault ─ ─ –90°–90° Basically Unchanged
–90°–90° Increases Significantly
Healthy –90°–90° Basically
Unchanged ─ ─ –
feeder BC will be taken for fault analysis as an example. Before fault occurrence, the power flows of B terminal and C terminal are both from either the upstream ter-minal of the fault point to the downstream terter-minal or from the downstream terminal to the upstream terminal. After fault occurrence, the power flow of B terminal is from upstream terminal to the fault point, whereas the power flow of C terminal is from downstream terminal to the fault point. According to the phase difference change information of measured admittances in Table1, the following conclusions can be drawn: the phase differ-ences of measured admittances of the B and C terminals are in the ranges of 90°–270° and−90°–90°, respectively. Thus, the fault analysis for the phase difference change information of looped structure multi-microgrid is the same as that of radial structure multi-microgrid.
In this situation, both B and C terminals are connected to the distribution network, so the voltages of the two terminals will have small changes when the fault occurs, but the currents will increase significantly. Thus, the measured admittance amplitudes of the two terminals will see large increases. While for the radial structure multi-microgrid, the DGs in the downstream of C terminal cannot provide enough short circuit capacity. As has been analyzed in the paper, the admittance amp-litude change of C terminal cannot be estimated directly. So the phase amplitude change information of looped structure multi-microgrid will differ slightly from that of
the radial structure multi-microgrid. The measured admittance amplitude information can be chosen as the starting criterion as the value for the faulty feeder always increases. Thus, although the range of fault starting de-tection has increased slightly, the faulty line can be iso-lated properly.
Overall, the proposed protection scheme can be applied to multi-microgrids with either radial structure or looped structure.
5 Simulation results
To validate the effectiveness and feasibility of the pro-posed method, a multi-microgrid with a high amount of DGs shown in Fig.9is established in PSCAD/EMTDC.
The multi-microgrid consists of three 10 kV sub-microgrids, and is connected to the main 35 kV distribu-tion network through a step-up transformer. The capacity and frequency of the system are 100 MVA and 50 Hz, respectively. The multi-microgrid has a high amount of DGs and loads, while for the purpose of analysis, the adja-cent DGs and loads are converted to one high-capacity DG and load, respectively. Thus, each sub-microgrid only consists of one DG in Fig. 9. The DGs in each sub-microgrid are the IIDGs under PQ control strategy with low voltage ride-through capability. The capacities of the DGs and loads in each sub-microgrid are shown in Table3. The positive-sequence resistance and reactance of the
feeders are 0.38Ω/km and 0.45Ω/km, respectively, and the zero-sequence resistance and reactance are 0.76Ω/km and 1.32Ω/km, respectively. Intelligent electronic devices (IEDs) are installed at the beginning of the single-terminal feeders. For double-terminal feeders, IEDs are installed at the two terminals of each line.
Three fault points (namely F1, F2 and F3) are selected to show faults in different sections of the multi-microgrid, i.e., the F1 fault at the double-terminal feeder EG, the F2 fault at the DG feeder L7 connecting with DG2, and the F3 fault in load feeder L6 connecting with load 5. Phase-phase-to-ground fault is considered and the faults occur at 0.3 s after the simulation started. The transition resist-ance of the fault point is 2Ω. The amplitude and phase difference change information of measured admittances before and after the fault are analyzed.
5.1 Fault at F1
The pre-fault measured admittances of the multi-microgrid are shown in Table 4. When the F1 fault oc-curs, the measured admittances of the multi-microgrid are shown in Table 5. |Gi| and Δφ1i, |G1i| are the pre-and post-fault phase pre-and amplitude of measured admit-tances, respectively. Δφ is the phase difference of the measured admittances.
In this case, it can be seen from Tables 4 and 5 that the pre- and post-fault phase differences of the mea-sured admittances ofEandGterminals are−48.64° and 150.99°, respectively, and they satisfy Criterion 2. For the
other double-terminal feeders, the phase differences of the measured admittances of the two terminals are both in the range of −90°–90°, and thus Criterion 2 is not satisfied. For the DG feeders, the phase difference of the measured admittances of each terminal is in the range of
−90°–90°, and Criterion 1 is not satisfied. As for the load feeders, the amplitudes of the measured admit-tances are almost unchanged, and Criterion 3 is not sat-isfied. Thus, the feeder EG is judged to be the faulty line.
5.2 Fault occurs at F2
When the fault occurs at F2, the measured admittances of the multi-microgrid are shown in Table 6. In this case, it can be seen from Table 6 that the pre- and post-fault phase difference of the measured admittances of N terminal is 167.32°, and thus Criterion 1 is satis-fied. For the double-terminal feeders, the phase differ-ences of the measured admittances of the two terminals are both in the range of−90°–90°, so Criterion 2 is not satisfied. For the other DG feeders, the phase difference of the measured admittances of each terminal is in the range−90°–90°, and Criterion 1 is not satisfied. As for the load feeders, the amplitudes of the measured admit-tances are almost unchanged, and thus Criterion 3 is not satisfied. Therefore, feeder L7 is judged to be the faulty line.
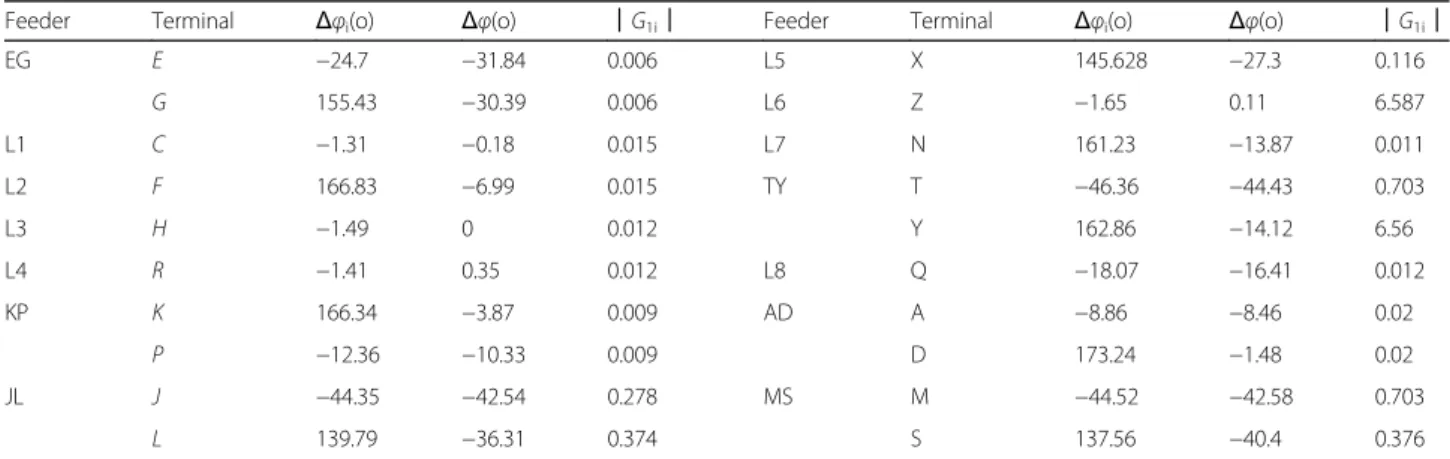
5.3 Fault occurs at F3
When the fault occurs at F3, the measured admittances of the multi-microgrid are shown in Table7.
In this case, it can be seen from Table 7that the pre-fault measured admittance amplitude of Z terminal is 0.009. It changes to 6.587 after the fault occurrence, an increase of approximate 730 times. Thus, Criterion 3 is satisfied. As for the other load feeders, the amplitudes of the measured admittances are almost unchanged, so Criterion 3 is not satisfied. The phase differences of the measured admittances of the double-terminal feeders are both in the range of−90°–90°, so Criterion 2 is not satisfied. For the DG feeders, the phase difference of the measured admittances of each terminal is in the range of
−90°–90°, and Criterion 1 is not satisfied. Thus, feeder L6 is judged as the faulty line.
From the above simulation results, the fault situa-tions are consistent with the theoretical analysis in Section 3. The fault locations can be determined by the protection criterions in Section 4. Thus, the faulty lines can be removed in time, and the protection function is achieved.
6 Conclusions
A new protection scheme for internal faults of multi-microgrid is proposed in this paper, which considers the Table 4Pre-fault measured admittance results before fault
occurs
Feeder Terminal |Gi| Δφi(o) Feeder Terminal |Gi| Δφi(o)
EG E 0.004 7.14 L5 X 0.003 172.92
G 0.004 186.89 L6 Z 0.009 −1.76
L1 C 0.015 −1.13 L7 N 0.006 175.1
L2 F 0.015 173.82 TY T 0.006 −1.93
L3 H 0.012 −1.49 Y 0.006 176.92
L4 R 0.012 −1.76 L8 Q 0.012 −1.66
KP K 0.006 170.21 AD A 0.019 −0.4
P 0.006 −2.03 D 0.019 174.68
JL J 0.023 −1.81 MS M 0.017 −1.94
L 0.023 176.1 S 0.017 177.9
Table 3Capacity of DGs and loads in the multi-microgrid
Number of Multi-Microgrid
Loads DGs
1 LD1: (1500 + 15 j)kVA LD2: (1200 + 30 j)kVA
DG1: 500 kW
2 LD3: (1200 + 30 j)kVA DG2: 400 kW
3 LD4: (1200 + 30 j)kVA LD5: (900 + 27 j)kVA
Table 7Measured admittance results when the F3 fault occurs
Feeder Terminal Δφi(o) Δφ(o) │G1i│ Feeder Terminal Δφi(o) Δφ(o) │G1i│
EG E −24.7 −31.84 0.006 L5 X 145.628 −27.3 0.116
G 155.43 −30.39 0.006 L6 Z −1.65 0.11 6.587
L1 C −1.31 −0.18 0.015 L7 N 161.23 −13.87 0.011
L2 F 166.83 −6.99 0.015 TY T −46.36 −44.43 0.703
L3 H −1.49 0 0.012 Y 162.86 −14.12 6.56
L4 R −1.41 0.35 0.012 L8 Q −18.07 −16.41 0.012
KP K 166.34 −3.87 0.009 AD A −8.86 −8.46 0.02
P −12.36 −10.33 0.009 D 173.24 −1.48 0.02
JL J −44.35 −42.54 0.278 MS M −44.52 −42.58 0.703
L 139.79 −36.31 0.374 S 137.56 −40.4 0.376
Table 6Measured admittance results when the F2 fault occurs
Feeder Terminal Δφi(o) Δφ(o) |G1i| Feeder Terminal Δφi(o) Δφ(o) |G1i|
EG E −27.42 −34.56 0.008 L5 X 166.32 −6.6 0.031
G 155.63 −30.76 0.008 L6 Z −1.77 −0.01 0.009
L1 C −1.12 0.01 0.015 L7 N −17.58 167.32 6.718
L2 F 154.84 −18.98 0.015 TY T −68.12 −66.19 0.031
L3 H −1.59 −0.1 0.012 Y 109.4 −67.52 0.029
L4 R −1.58 0.18 0.013 L8 Q −1.55 0.11 0.012
KP K 160.4 −9.81 6.28 AD A −17.18 −16.78 0.02
P −19.65 −17.62 6.729 D 163.28 −11.4 0.02
JL J −44.69 −42.88 0.958 MS M −55.63 −53.69 0.039
L 144.56 −31.54 6.284 S 131.26 −46.64 0.03
Table 5Measured admittance results when the F1 fault occurs
Feeder Terminal Δφi(o) Δφ(o) |G1i| Feeder Terminal Δφi(o) Δφ(o) |G1i|
EG E −41.50 −48.64 1.467 L5 X 158.67 −14.25 0.004
G −22.12 150.99 0.149 L6 Z −1.54 0.22 0.009
L1 C −1.12 0.01 0.015 L7 N 171.36 −3.74 0.008
L2 F 156.15 −17.67 0.015 TY T −15.32 −13.39 0.006
L3 H −1.54 −0.05 0.012 Y 172.58 −4.34 0.006
L4 R −1.58 0.18 0.012 L8 Q −1.76 −0.1 0.012
KP K 140.45 −29.76 0.007 AD A −34.7 −34.3 0.729
P −20.16 −18.13 0.007 D 138.88 −35.8 1.479
JL J −19.35 −17.54 0.025 MS M −10.58 −8.64 0.018
control characteristics of the DGs and the interconnec-tion and interacinterconnec-tion among adjacent microgrids. The current and voltage characteristics of different feeders are analyzed for faults at different positions of the multi-microgrid. The fault location is realized by comparing the phase differences and amplitudes of measured admittances of the feeders.
The change of the measured bus admittance is the result of the joint action of voltage and current. The change information of the pre- and post-fault measured admittance amplitudes is significant and can be defined as the protection criterion for the load feeders. Further-more, the phase difference of the measured admittances is defined as another protection criterion for the double-terminal and DG feeders where it is not a fixed value, but a phase interval. A large redundancy is also intro-duced in the derivation of the protection criterion and faults at different feeders of the multi-microgrid can be effectively distinguished. Therefore, the fault detection and location can be implemented.
However, for high-impedance faults (HIFs), the change characteristics of current and voltage are not significant and can lead to the failure of Criterion 3. Thus, HIFs at load feeders might not be detected, which is the main limitation of the proposed method.
A multi-microgrid consisted of three 10 kV sub-microgrids is established in PSCAD/EMTDC. To examine the effectiveness of the protection scheme, phase-phase-to-ground faults are simulated at four different locations. Theoretical analysis and system simu-lation results demonstrate the superiority and accuracy of the proposed scheme.
Acknowledgements Not applicable.
Authors’contributions
The paper was a collaborative effort among the authors. FZ performed the simulation, analyzed the data, and wrote the paper. LM provided critical comments and supervised the related research work. All authors read and approved the final manuscript.
Availability of data and materials Please contact author for data requests.
Competing interests
The authors declare that they have no competing interests.
Received: 14 September 2018 Accepted: 21 May 2019
References
1. Laaksonen, H. J. (2010). Protection principles for future microgrids. IEEE Transactions on Power Electronics, 25(12), 2910–2918.
2. Solanki, A., Nasiri, A., Bhavaraju, V., Familiant, Y. L., & Fu, Q. (2016). A new framework for microgrid management: Virtual droop control. IEEE Transactions on Smart Grid, 7(2), 554–566.
3. Li, H., Eseye, A. T., Zhang, J., & Zheng, D. (2017). Optimal energy management for industrial microgrids with high-penetration renewables.
Protection & Control of Modern Power Systems, 2(1), 1–12.
4. Xiong, X., Wang, J., Jing, T., et al. (2017). Power optimization control of microgrid cluster.Electric Power Automation Equipment, 37(9), 10–17. 5. Liu, N., Zhao, J., Wang, J., et al. (2018). A trading model of PV microgrid
cluster based on cooperative game theory. Transactions of China Electrotechnical Society, 33(8), 1903–1910.
6. Min, Z., Ying, C., Chen, S., & Huang, X. (2015). Characteristic analysis of multi-microgrids and a pilot project design. Power System Technology, 39(6), 1469–1476.
7. Rajaei, N., Ahmed, M. H., & Salama, M. M. A. (2014). Fault current management using inverter-based distributed generators in smart grids.
IEEE Transactions on Smart Grid, 5(5), 2183–2193.
8. Camacho, A., Castilla, M., & Miret, J. (2015). Active and reactive power strategies with peak current limitation for distributed generation inverters during unbalanced grid faults. IEEE Transactions on Industrial Electronics, 62(3), 1515–1525.
9. Zamani, M. A., Yazdani, A., & Sidhu, T. S. (2012). A control strategy for enhanced operation of inverter-based microgrids under transient disturbances and network faults. IEEE Transactions on Power Delivery, 27(4), 1737–1747.
10. Lopes, J. A. P., Moreira, C. L., & Madureira, A. G. (2006). Defining control strategies for microgrids islanded operation. IEEE Transactions on Power Systems, 21(2), 916–924.
11. Laaksonen, H. (2015). Protection scheme for island operated medium-voltage microgrid.International Review of Electrical Engineering, 10(4), 510–519.
12. Huang, W. T., Tai, N. L., & Yang, X. (2014). Inverse-time low-impedance protection scheme for microgrids.Proceedings of the CSEE, 34(1), 105–114. 13. Dewadasa, M., Ghosh, A., & Ledwich, G. (2010). Fold back current
control and admittance protection scheme for a distribution network containing distributed generators. IET Generation Transmission & Distribution, 4(8), 952–962.
14. Dewadasa, M., Majumder, R., Ghosh, A., & Ledwich, G. (2009). Control and protection of a microgrid with converter interfaced microsources. In2009 International Conference on Power Systems (ICPS‘09)(pp. 1–6).
15. Bukhari, S. B. A., Zaman, M. S. U., Haider, R., Oh, Y.-S., & Kim, C.-H. (2017). A protection scheme for microgrid with multiple distributed generations using superimposed reactive energy.International Journal of Electrical Power & Energy Systems, 92, 156–166.
16. Zhang, B., Hao, Z., & Bo, Z. (2016). New development in relay protection for smart grid.Protection & Control of Modern Power Systems, 1(1), 1–14. 17. Rocabert, J., Luna, A., & Blaabjerg, F. (2012). Control of power converters in
AC microgrids.IEEE Transactions on Power Electronics, 27(11), 4734–4749. 18. Kroposki, B., Lasseter, R., & Ise, T. (2008). Making microgrid work.IEEE Power
& Energy Magazine, 6(3), 40–53.
19. Soshinskaya, M., Crijns-Graus, W. H. J., & Guerrero, J. M. (2014). Microgrids: Experiences, barriers and success factors.Renewable & Sustainable Energy Reviews, 40, 659–672.