ORIGINAL INVESTIGATION
Cardiovascular disease risk factor
responses to a type 2 diabetes care model
including nutritional ketosis induced
by sustained carbohydrate restriction at 1 year:
an open label, non-randomized, controlled
study
Nasir H. Bhanpuri
1*, Sarah J. Hallberg
1,2, Paul T. Williams
3, Amy L. McKenzie
1, Kevin D. Ballard
4,
Wayne W. Campbell
5, James P. McCarter
1,6, Stephen D. Phinney
1and Jeff S. Volek
1,7Abstract
Background: Cardiovascular disease (CVD) is a leading cause of death among adults with type 2 diabetes mellitus (T2D). We recently reported that glycemic control in patients with T2D can be significantly improved through a con-tinuous care intervention (CCI) including nutritional ketosis. The purpose of this study was to examine CVD risk factors in this cohort.
Methods: We investigated CVD risk factors in patients with T2D who participated in a 1 year open label, non-rand-omized, controlled study. The CCI group (n = 262) received treatment from a health coach and medical provider. A usual care (UC) group (n = 87) was independently recruited to track customary T2D progression. Circulating biomark-ers of cholesterol metabolism and inflammation, blood pressure (BP), carotid intima media thickness (cIMT), multi-fac-torial risk scores and medication use were examined. A significance level of P < 0.0019 ensured two-tailed significance at the 5% level when Bonferroni adjusted for multiple comparisons.
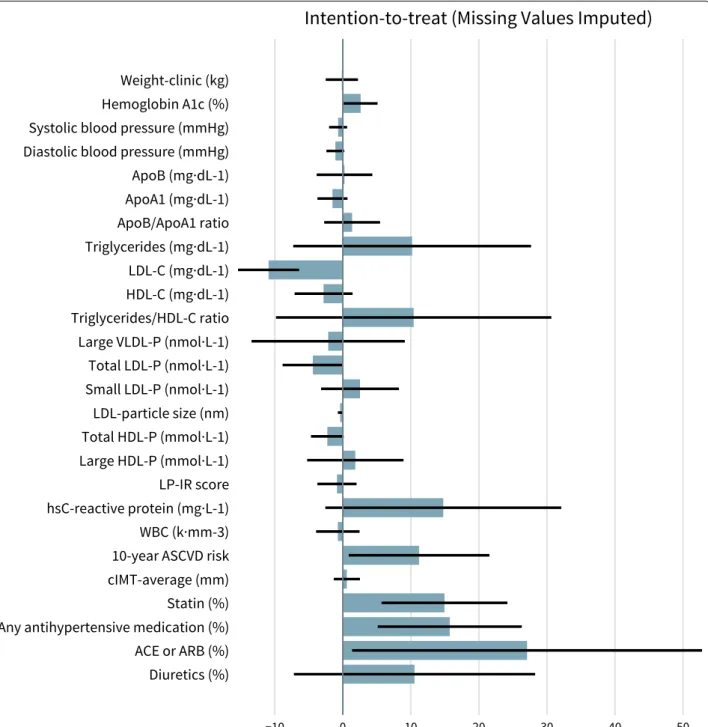
Results: The CCI group consisted of 262 participants (baseline mean (SD): age 54 (8) year, BMI 40.4 (8.8) kg m−2). Intention-to-treat analysis (% change) revealed the following at 1-year: total LDL-particles (LDL-P) (− 4.9%, P = 0.02), small LDL-P (− 20.8%, P = 1.2 × 10⁻¹²), LDL-P size (
+ 1.1%, P = 6.0 × 10⁻¹⁰), ApoB (
− 1.6%, P = 0.37), ApoA1 (+ 9.8%, P < 10−16), ApoB/ApoA1 ratio (
− 9.5%, P = 1.9 × 10⁻⁷), triglyceride/HDL-C ratio (
− 29.1%, P < 10−16), large VLDL-P (− 38.9%, P = 4.2 × 10⁻¹⁵), and LDL-C (
+ 9.9%, P = 4.9 × 10⁻⁵). Additional effects were reductions in blood pressure, high sensitivity C-reactive protein, and white blood cell count (all P < 1 × 10⁻⁷) while cIMT was unchanged. The 10-year atherosclerotic cardiovascular disease (ASCVD) risk score decreased − 11.9% (P = 4.9 × 10⁻⁵). Antihypertensive medication use was discontinued in 11.4% of CCI participants (P = 5.3 × 10⁻⁵). The UC group of 87 participants [base-line mean (SD): age 52 (10) year, BMI 36.7 (7.2) kg m−2] showed no significant changes. After adjusting for baseline differences when comparing CCI and UC groups, significant improvements for the CCI group included small LDL-P, ApoA1, triglyceride/HDL-C ratio, HDL-C, hsCRP, and LP-IR score in addition to other biomarkers that were previously reported. The CCI group showed a greater rise in LDL-C.
© The Author(s) 2018. This article is distributed under the terms of the Creative Commons Attribution 4.0 International License (http://creativecommons.org/licenses/by/4.0/), which permits unrestricted use, distribution, and reproduction in any medium, provided you give appropriate credit to the original author(s) and the source, provide a link to the Creative Commons license, and indicate if changes were made. The Creative Commons Public Domain Dedication waiver (http://creativecommons.org/ publicdomain/zero/1.0/) applies to the data made available in this article, unless otherwise stated.
Open Access
*Correspondence: nbhanpuri@virtahealth.com 1 Virta Health, San Francisco, CA, USA
Background
Despite advances in the prevention and treatment of cardiovascular disease (CVD), it remains the leading cause of death in adults across the world [1]. Specifically, among those with type 2 diabetes (T2D) in the US, CVD accounts for 44% of mortality [2]. T2D rates have dou-bled over the past 20 years [3] and CVD risk increases two to fourfold with a diagnosis of T2D [4], warranting the identification of novel interventions to combat T2D. Intensive lifestyle interventions with dietary carbohy-drate restriction [5–8], including the recently described continuous remote care model, which helps patients with T2D sustain nutritional ketosis [9, 10], have demon-strated improved glycemic control concurrent with med-ication reduction. However, the long-term sustainability and impact of these interventions on CVD risk and lipid profiles remains a subject of debate [11, 12].
Atherogenic dyslipidemia, a known risk factor for CVD [13], is highly prevalent in patients with T2D [14] and tightly linked to high-carbohydrate diets [15]. The condi-tion is characterized by increased triglycerides, decreased high-density lipoprotein cholesterol concentration (HDL-C) and increased small low-density lipoprotein particle number (small LDL-P). Evidence suggests that increased very low-density lipoprotein particle number (VLDL-P), and in particular large VLDL-P, may be one of the key underlying abnormalities in atherogenic dys-lipidemia [14, 16–18]. Elevated concentrations of small LDL are often associated with increased total LDL par-ticle number (LDL-P) and ApoB [19, 20]. Particularly in patients with insulin resistance and T2D, elevated LDL-P and ApoB may exist even with normal to low LDL-C val-ues [19, 21, 22]. Reliance on LDL-C for risk assessment in T2D patients may miss the impact of atherogenic dyslipi-demia and elevated LDL-P. Researchers have proposed that LDL-P or ApoB may be superior to LDL-C as a pre-dictor of CVD [22–25].
Previous studies of carbohydrate restriction of up to 1-year found a consistent decrease in triglycerides and increase in HDL-C, while LDL-C slightly increased or decreased [15, 26–28]. Although LDL-C is a risk factor for CVD, low LDL-C may belie elevations in small LDL, LDL-P or ApoB. Conversely, increased LDL-C with a low carbohydrate diet may primarily reflect the large
LDL subfraction and may not increase CVD risk if total LDL-P or ApoB concentrations are unchanged or decline.
Inflammation, as assessed by elevated high-sensitivity C-reactive protein (hsCRP) or white blood cell count (WBC) [29–32], is an independent CVD risk factor and is involved in all stages of atherogenesis [33]. Inflammation is often observed in T2D concurrent with atherogenic dyslipidemia [34] and represents an additional CVD risk even in individuals with low to normal LDL-C [35, 36]. Hypertension is an additive risk factor in this patient population. Tighter blood pressure control has been associated with reduction in the risk of deaths related to diabetes. This included decreased CVD, stroke and microvascular complications [37].
For this open label, non-randomized, controlled, before-and-after study, we investigated the effects of a continuous care intervention (CCI) on CVD risk factors. The CCI included individualized digital support with telemedicine, health coaching, education in nutritional ketosis, biometric feedback, and an online peer-support community. Given the multi-faceted pathophysiology of CVD, we assessed the 1-year responses in several bio-markers related to cholesterol and lipoprotein metabo-lism, blood pressure, and inflammation, as well as carotid intima media thickness (cIMT) and medication use. Some results were previously reported in relation to gly-cemic control [10] and are presented here as they pertain to the effectiveness of the intervention and CVD risk (i.e. body weight and hemoglobin A1c).
Methods
Intervention
As previously described [9, 10], we utilized a prospective, longitudinal study design with a cohort of patients with T2D from the greater Lafayette, Indiana, USA, region who self-selected to participate in the CCI (Clinicaltri-als.gov Identifier NCT02519309). Participants in the CCI were provided access to a web-based software application (app) for biomarker reporting and monitoring including body weight, blood glucose and blood betahydroxybu-tyrate (BHB; a marker of ketosis). The remote care team consisted of a health coach and physician or nurse prac-titioner who provided nutritional advice and medication management, respectively. Participants were guided by
Conclusions: A continuous care treatment including nutritional ketosis in patients with T2D improved most bio-markers of CVD risk after 1 year. The increase in LDL-cholesterol appeared limited to the large LDL subfraction. LDL particle size increased, total LDL-P and ApoB were unchanged, and inflammation and blood pressure decreased. Trial registration Clinicaltrials.gov: NCT02519309. Registered 10 August 2015
individualized nutrition recommendations to achieve and sustain nutritional ketosis. Notably, if participants reported headaches, constipation or lightheadedness, the remote care team recommended individualized adjust-ments to sodium and fluid intake [10]. CCI participants self-selected to receive education via either an onsite group setting (CCI-onsite) or via the app (CCI-web). There were no instructions given to the CCI group on counting or restricting calories. The CCI participants were instructed to restrict carbohydrate, eat protein in moderation, and consume fat to satiety from the start of the study. Due to the well-known systematic errors asso-ciated with dietary records in an obese population [38], we chose not to collect diet records. Social support was provided via an online peer community. Inclusion and exclusion criteria were previously described [10]. This study was approved by the Franciscan Health Lafayette Institutional Review Board, and participants provided written informed consent.
The frequency of glucose and BHB monitoring, along with glycemic control medication management, were previously described in detail [9, 10]. Briefly, glucose and BHB levels were initially obtained daily using a blood glucose and ketone meter (Precision Xtra, Abbott; Alameda, CA, USA) to personalize nutrition recommen-dations and also provide a marker of adherence. The fre-quency of measurement was modified by the care team for each participant based on individual care needs and preferences. For participants with a history of hyperten-sion, a home automatic sphygmomanometer was sup-plied. Participants reported their home readings in the app daily to weekly depending on recent control and instruction from the supervising physician. Antihyper-tensive prescriptions were adjusted based on home read-ings and reported symptoms. Health coaches responded to patient app reported readings of systolic blood pres-sure less than 110 mmHg with specific questions about symptoms of hypotension. Following resolution of hypertension, diuretics were the first antihypertensive medications to be discontinued, followed by beta block-ers, unless the participant had a history of coronary artery disease. Angiotensin-converting-enzyme inhibi-tors (ACEs) and angiotensin II receptor blockers (ARBs) were generally continued due to known renal protection with diabetes [39, 40]. Statin medications were adjusted when appropriate to maintain a goal of LDL-P under 1000 nmol L−1 or participant preference after full risk— benefit discussion.
To track T2D progression in the same geography and health system as the CCI, an independent cohort of patients with T2D who received usual care (UC) were recruited. These patients were referred to registered
dietitians providing dietary advice according to Ameri-can Diabetes Association guidelines [41].
Outcome measures
Anthropometrics and vital signs for the CCI group were obtained at baseline, 70 days, and 1 year. A stadiometer was used to assess height and used in the calculation of body mass index. A calibrated scale in the clinic meas-ured weight to the nearest 0.1 lb (Model 750, Detecto; Webb City, MO, USA) and values were converted to kg. Participants were provided a cellular-connected home scale for daily weight. Blood pressure was obtained man-ually by trained staff after participants rested in a seated position for 5 min. Adverse events were reported and reviewed by the Principal Investigator and the Institu-tional Review Board.
Fasting blood draws for the CCI group were collected at baseline, 70 days, and 1-year follow-up (ranging from 11 to 15 months). Blood analytes were determined via standard procedures at a Clinical Laboratory Improve-ment AmendImprove-ment (CLIA) accredited laboratory on the day of sample collection or from stored serum. Serum ali-quots were stored at − 80 °C and thawed for determina-tion of ApoB, ApoA1, total cholesterol, triglycerides, and direct HDL-C concentrations by FDA approved methods (Cobas c501, Roche Diagnostics; Indianapolis, IN, USA). LDL was calculated using the Friedewald equation [42]. Lipid subfractions were quantified using clinical NMR LipoProfile® (LabCorp, Burlington NC, USA; [43]). The LipoProfile3 algorithm used in the present investigation was used previously to relate lipid subfractions to CVD risk [35, 44, 45]. The NMR-derived lipoprotein insulin resistance score (LP-IR) is proposed to be associated with the homeostasis model assessment of insulin resistance (HOMA-IR) and glucose disposal rate (GDR) [46]. The multifactorial 10-year atherosclerotic cardiovascular dis-ease (ASCVD) risk score was also computed [47].
Anthropometrics, vital signs and fasting blood draws for the UC group were obtained at baseline and 1 year as described above using the same clinical facilities and lab-oratory and data collection methods. Home biometrics for the UC group were not tracked and 70-day outcomes were not measured.
captured in three imaging planes: anterior, lateral, and posterior. Digital images were analyzed using edge-detec-tion software (Carotid Analyzer for Research; Medical Imaging Application, Coralville, IA) to trace the lumen-intima and lumen-intima-medial boundaries of the artery. Anal-yses were performed by the same blinded investigator to obtain right and left mean arterial diameter and mean cIMT. The current study was powered to detect a ∆cIMT difference of 0.019 mm between the CCI and UC groups at alpha = 0.05 and power = 80%.
Statistics
JMP software (version 5.1, SAS Institute; Cary, SC, USA) was used for all statistical analyses except multi-ple imputation. Multimulti-ple imputation using multivariate normal distribution, conducted with Stata software (ver-sion 11, StataCorp; College Station, TX, USA), was used to estimate means and standard errors describing the variability between imputations. Seven hundred impu-tations from multivariate normal regression were run to estimate the missing values (4% missing at baseline and 22% missing at 1 year). Two-sample t tests were used to test for significance of the differences in baseline bio-marker values between groups. Two-sample t tests were also used to test for differences between 1-year changes between groups. Paired t tests and analysis of covari-ance (ANCOVA) when adjusted for baseline covariates (sex, age, baseline BMI, insulin use (user vs. non-user), and African–American race) were used to test for sig-nificance of within-group changes. A secondary analysis was conducted with the addition of smoking status as a sixth covariate. To reduce skewness before testing for significance, triglyceride, triglyceride/HDL-C ratio and hsCRP were first log-transformed, however aside from P values, the tables present results from the untransformed data. Percent change in a given biomarker was calcu-lated as the mean difference value divided by the mean baseline value. The standard error of percent change of a given biomarker was calculated as the standard error of the change divided by the mean baseline value. Signifi-cant changes in proportions (e.g. medication use) were tested using McNemar’s test with continuity correction in completers, and linear regression of the changes in the dichotomous states when missing outcome data were imputed.
Throughout the manuscript, standard deviations are presented within parentheses and standard errors are presented following “±” symbol. Nominal significance levels (P) are presented in the tables; however, a cance level of P < 0.0019 ensures simultaneous signifi-cance at P < 0.05 for a Bonferroni adjustment for the 26 variables examined. Unless otherwise noted, results pre-sented are intention-to-treat analyses (all starters) with
missing values estimated by imputation. Some results are designated as completer analyses (excluding participants who withdrew or lacked biomarkers at 1 year).
Results
Baseline characteristics of participants
The baseline characteristics of the 262 T2D participants who began the CCI are shown in Table 1. There were no significant differences in baseline characteristics between groups self-selecting web-based (CCI-web) and onsite education (CCI-onsite) (Additional file 1: Table S1) nor were there significant differences in biomarker changes at 1 year between the groups (Additional file 2: Table S2). Therefore, results for the two groups were combined for further analyses.
The baseline characteristics of participants with meas-urements at both baseline and 1 year were not signifi-cantly different from dropouts and participants with missing data after correcting for multiple comparisons (Additional file 1: Table S1). This suggests that multiple imputation may be appropriate for estimating missing values in order to estimate outcomes for all starters.
An independently recruited UC group of 87 T2D par-ticipants, which provided an observational compari-son group from the same geography and health system, showed no significant differences from the CCI group in baseline characteristics except mean body weight and BMI were higher in the CCI versus the UC group (Table 1, P < 0.001).
Changes in biomarkers of CVD risk at 1 year
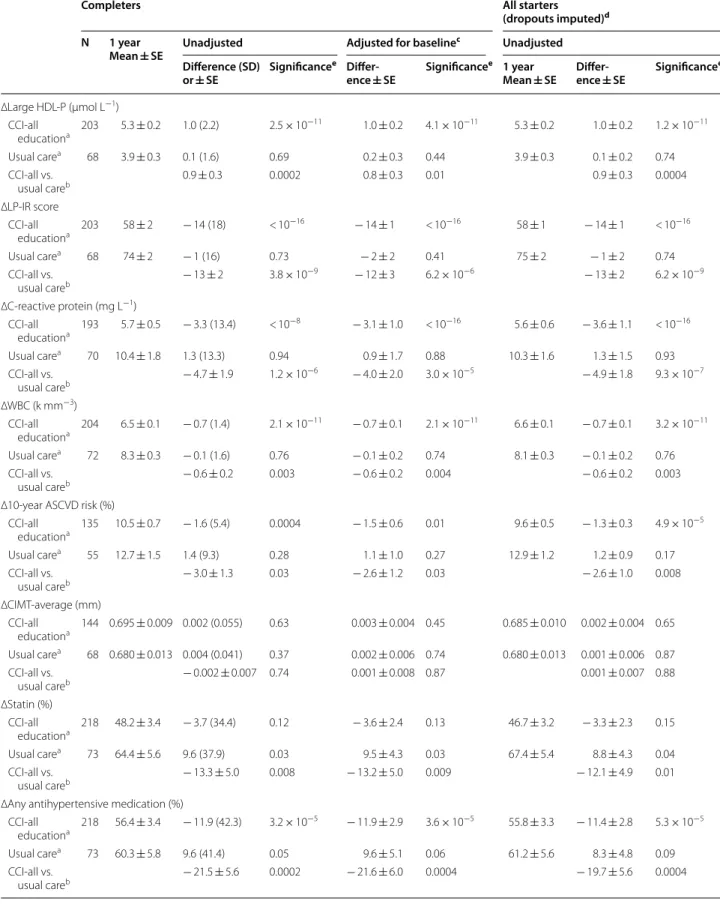
Two-hundred eighteen (83%) participants remained enrolled in the CCI group at 1 year. One-year changes in CVD biomarkers are detailed in Table 2 and percent changes from baseline are shown in Fig. 1. The within-CCI group changes in the following lipids and lipopro-teins were all statistically significant after adjusting for multiple comparisons (P < 0.0019), reported here as mean percent difference from baseline: ApoA1 (+ 9.8%), ApoB/ApoA1 ratio (− 9.5%), triglycerides (− 24.4%), LDL-C (+ 9.9%), HDL-C (+ 18.1%), triglyceride/HDL-C ratio (− 29.1%), large VLDL-P (− 38.9%), small LDL-P (−20.8%), LDL-particle size (+1.1%), total HDL-P (+ 4.9%), and large HDL-P (+ 23.5%). There were no significant changes after adjusting for multiple compari-sons in total LDL-P (− 4.9%, P = 0.02) or ApoB (− 1.6%, P = 0.37).
Table 1 Baseline characteristics for participants in the con-tinuous care intervention (CCI) and usual care (UC) groups
All Completers with data
N Mean (SD)
or ± SE N Mean (SD) or ± SE
Age (years)
CCI-all educationa 262 54 (8) 218 54 (8)
Usual carea 87 52 (10) 78 52 (10)
CCI-all vs. usual careb 1 ± 1 2 ± 1*
Female (%)
CCI-all educationa 262 66.8 ± 2.9 218 65.1 ± 3.2
Usual carea 87 58.6 ± 5.3 78 60.3 ± 5.5
CCI-all vs. usual careb 8.2 ± 6.0 4.9 ± 6.4
Smokers (%)
CCI-all educationa 211 3.8 ± 1.3 176 4.0 ± 1.5
Usual carea 87 14.9 ± 3.8 78 14.1 ± 3.9
CCI-all vs. usual careb − 11.2 ± 4.0† − 10.1 ± 4.2*
Weight-clinic (kg)
CCI-all educationa 257 116.5 (25.9) 184 115.4 (24.6)
Usual carea 83 105.6 (22.2) 69 106.8 (22.2)
CCI-all vs. usual careb 10.9 ± 2.9‡ 8.6 ± 3.2†
BMI (kg m−2)
CCI-all educationa 257 40.4 (8.8) 184 39.9 (7.9)
Usual carea 83 36.7 (7.3) 69 37.1 (7.6)
CCI-all vs. usual careb 3.7 ± 1.0‡ 2.7 ± 1.1†
Hemoglobin A1c (%)
CCI-all educationa 262 7.60 (1.50) 204 7.49 (1.40)
Usual carea 87 7.64 (1.76) 72 7.74 (1.82)
CCI-all vs. usual careb −0.04 ± 0.21 −0.25 ± 0.24
Systolic blood pressure (mmHg)
CCI-all educationa 260 132 (14) 187 133 (15)
Usual carea 79 130 (14) 67 129 (13)
CCI-all vs. usual careb 2 ± 2 4 ± 2*
Diastolic blood pressure (mmHg)
CCI-all educationa 260 82 (8) 187 82 (8)
Usual carea 79 82 (9) 67 81 (8)
CCI-all vs. usual careb 0 ± 1 0 ± 1
ApoB (mg dL−1)
CCI-all educationa 248 105 (29) 186 103 (28)
Usual carea 79 107 (28) 59 106 (30)
CCI-all vs. usual careb −2 ± 4 −2
ApoA1 (mg dL−1)
CCI-all educationa 248 146 (28) 185 146 (29)
Usual carea 79 149 (22) 59 148 (21)
CCI-all vs. usual careb −3 ± 3 −2 ± 3
ApoB/ApoA1 ratio
CCI-all educationa 248 0.74 (0.23) 185 0.73 (0.23)
Usual carea 79 0.73 (0.23) 59 0.73 (0.25)
CCI-all vs. usual careb 0.01 ± 0.03 0.00 ± 0.04
Triglycerides (mg dL−1)
CCI-all educationa 247 197 (143) 186 201 (153)
Usual carea 79 283 (401) 59 297 (458)
Table 1 continued
All Completers with data
N Mean (SD)
or ± SE N Mean (SD) or ± SE
CCI-all vs. usual careb −86 ± 46* −97 ± 61
LDL-C (mg dL−1)
CCI-all educationa 232 103 (33) 172 100 (33)
Usual carea 70 102 (36) 48 100 (38)
CCI-all vs. usual careb 1 ± 5 0 ± 6
HDL-C (mg dL−1)
CCI-all educationa 247 42 (13) 186 42 (14)
Usual carea 79 38 (11) 59 37 (11)
CCI-all vs. usual careb 5 ± 2† 5 ± 2†
Triglycerides/HDL-C ratio
CCI-all educationa 247 5.9 (7.1) 186 6.1 (7.9)
Usual carea 79 10.5 (23.2) 59 11.5 (26.5)
CCI-all vs. usual careb −4.6 ± 2.6 −5.4 ± 3.5
Large VLDL-P (nmol L−1)
CCI-all educationa 259 10 (8) 203 9 (8)
Usual carea 83 12 (12) 68 12 (13)
CCI-all vs. usual careb −2 ± 1 −2 ± 2
Total LDL-P (nmol L−1)
CCI-all educationa 259 1300 (465) 203 1296 (476)
Usual carea 83 1289 (511) 68 1243 (484)
CCI-all vs. usual careb 11 ± 63 52 ± 68
Small LDL-P (nmol L−1)
CCI-all educationa 259 774 (377) 203 778 (378)
Usual carea 83 719 (322) 68 699 (326)
CCI-all vs. usual careb 55 ± 42 789 ± 48
LDL-particle size (nm)
CCI-all educationa 259 20.30 (0.55) 201 20.3 (0.55)
Usual carea 83 20.33 (0.56) 68 20.32 (0.55)
CCI-all vs. usual careb −0.03 ± 0.07 −0.03 ± 0.08
Total HDL-P (μmol L−1)
CCI-all educationa 259 31.3 (6.4) 203 31.7 (6.4)
Usual carea 83 29.9 (5.8) 68 30.2 (6.0)
CCI-all vs. usual careb 1.4 ± 0.8 1.5 ± 0.9
Large HDL-P (μmol L−1)
CCI-all educationa 259 4.3 (2.5) 203 4.2 (2.5)
Usual carea 83 3.8 (2.1) 68 3.8 (2.1)
CCI-all vs. usual careb 0.4 ± 0.3 0.4 ± 0.3
LP-IR score
CCI-all educationa 259 72 (17) 203 72 (18)
Usual carea 83 75 (16) 68 74 (17)
CCI-all vs. usual careb −3 ± 2 −2 ± 2
C-reactive protein (mg L−1)
CCI-all educationa 249 8.5 (14.5) 193 9.0 (16.1)
Usual carea 85 8.9 (8.6) 70 9.1 (9.0)
CCI-all vs. usual careb −0.3 ± 1.3 −0.1 ± 1.6
WBC
CCI-all educationa 260 7.2 (1.9) 204 7.1 (1.8)
were observed in overall use of antihypertensive medi-cation (− 11.4%) and diuretics (− 9.7%) whereas changes in ACE or ARB (0.6%) and statin (− 3.3%) use were not significant. Significant reductions were observed in both multivariate metrics: 10-year ASCVD risk (− 11.9%) and LP-IR (− 19.6%). There was no significant change in cIMT (averaged right and left values). In addition, changes in cIMT were not significantly correlated with baseline LDL-P or LDL-C, or changes in LDL-P or LDL-C (all P ≥ 0.33).
One-year results from the UC group are provided in Table 2 and Fig. 2. Within the UC group, after adjust-ment for multiple comparisons there were no signifi-cant changes at 1 year. After adjusting for differences in
baseline characteristics (sex, age, baseline BMI, insulin use (user vs. non-user), and African–American race) and multiple comparisons, the changes observed at 1 year for the following biomarkers were significantly different between the CCI and UC groups (mean ∆CCI − mean ∆UC, where ∆ is 1 year minus baseline): small LDL-P (− 177 nmol L−1), ApoA1 (+ 16 mg dL−1), triglycer-ide/HDL-C ratio (− 3.1), LDL particle size (+ 0.31 nm), HDL-C (+ 8 mg dL−1), LDL-C (+ 22 mg dL−1), hsCRP (− 4.0 mg dL−1), and LP-IR (− 12). Adding smoking sta-tus to the list of covariates mentioned above did not lead to any changes in statistical significance.
There were no significant differences in change in biomarkers between the sexes within the CCI group or between CCI and UC groups among completers (all P > 0.0019). The results related to daily weight and ketone measurements were previously reported in detail [9, 10]. In brief, almost all CCI participants (96%) reported at least one BHB value ≥ 0.5 mmol L−1 by handheld measure. Laboratory-measured BHB at 1 year (0.31 ± 0.03 mmol L−1) was almost twice as large as the baseline average in the CCI group (0.17 ± 0.01 mmol L−1). For this population, additional details on changes in other biomarkers related to glycemic control, metabolic acido-sis, and liver, kidney, and thyroid health were previously reported in greater detail [9, 10]. In addition, details on safety and adverse events have previously been described [10]. A post hoc analysis of covariance on treatment ver-sus control group differences in 1-year risk factor change suggested that weight loss was associated with as much as approximately 40–70% of the change in the following biomarkers: small LDL-P, ApoA1, triglyceride/HDL-C ratio, triglycerides, and HDL-C and over 90% of the dif-ference in LP-IR score.
Range of outcomes
The distribution and range of intervention response for the CCI and UC groups were compared for LDL-P, small LDL-P, large VLDL-P, ApoB, ApoA1, ApoB/ApoA1 ratio, and TG/HDL-C ratio (Additional file 3: Figure S1). Ranges of change observed in the CCI group were within the ranges observed in the UC group for increases in LDL-P, small LDL-P, ApoB and ApoB/ApoA1 ratio. There were two CCI participants (2/203, 1.0%) whose change in large VLDL-P exceeded the maximum observed in the UC group (15.2 nmol L−1). There was one CCI partici-pant (1/185, 0.5%) whose change in ApoA1 was less than the minimum observed in the UC group (− 58 mg dL−1) and one CCI participant (1/186, 0.5%) whose change in triglyceride/HDL-C ratio was higher than the maximum observed in the UC group (64.9).
Table 1 continued
All Completers with data
N Mean (SD)
or ± SE N Mean (SD) or ± SE CCI-all vs. usual careb −0.9 ± 0.3† −1.2 ± 0.3§
10-year ASCVD risk (%)
CCI-all educationa 198 11.1 (9.1) 135 12.1 (9.3)
Usual carea 72 11.8 (10.8) 55 11.4 (10.8)
CCI-all vs. usual careb −0.6 ± 1.4 0.8 ± 1.6
CIMT-average (mm)
CCI-all educationa 236 0.681 (0.108) 144 0.692 (0.113)
Usual carea 84 0.681 (0.116) 68 0.680 (0.111)
CCI-all vs. usual careb −0.001 ± 0.014 0.013 ± 0.016
Statin (%)
CCI-all educationa 262 50.0 ± 3.1 218 51.8 ± 3.4
Usual carea 87 58.6 ± 5.3 73 54.8 ± 5.8
CCI-all vs. usual careb −8.6 ± 6.1 −3.0 ± 6.7
Any antihypertensive medication (%)
CCI-all educationa 262 67.2 ± 2.9 218 68.4 ± 3.2
Usual carea 87 52.9 ± 5.4 73 50.7 ± 5.9
CCI-all vs. usual careb 14.3 ± 6.1* 17.7 ± 6.7†
ACE or ARB (%)
CCI-all educationa 262 29.4 ± 2.8 218 28.0 ± 3.0
Usual carea 87 18.4 ± 4.2 73 16.4 ± 4.3
CCI-all vs. usual careb 11.0 ± 5.0* 11.5 ± 5.3*
Diuretics (%)
CCI-all educationa 262 40.8 ± 3.0 218 41.3 ± 3.3
Usual carea 87 29.9 ± 4.9 73 24.7 ± 5.0
CCI-all vs. usual careb 11.0 ± 5.8 16.6 ± 6.1†
Significant baseline difference between means or percentages are designated by the following symbols: * 0.05 > P ≥ 0.01, †0.01 > P ≥ 0.001, ‡0.001 > P ≥
0.0001, §P < 0.0001
a Mean and standard deviations for continuous variables, percents and
standard errors for categorical variables
b Difference between means or percentages ± 1 standard error of the
Table 2 1-year biomarker changes for participants in the continuous care intervention group compared to usual care group
Completers All starters
(dropouts imputed)d
N 1 year
Mean ± SE Unadjusted Adjusted for baseline
c Unadjusted
Difference (SD)
or ± SE Significance
e
Differ-ence ± SE Significance e 1 year
Mean ± SE Differ-ence ± SE Significance e
∆Weight-clinic (kg) CCI-all
educationa 184 101.2 ± 1.6 − 14.2 (10.3) < 10
−16 − 13.8 ± 0.6 < 10−16 102.7 ± 1.5 − 13.8 ± 0.7 < 10−16
Usual carea 69 106.8 ± 2.7 0.04 (5.9) 0.95 − 1.1 ± 1.1 0.29 107.3 ± 2.6 − 0.2 ± 0.8 0.85
CCI-all vs.
usual careb − 14.3 ± 1.0 < 10
−16 − 12.7 ± 1.3 < 10−16 − 13.7 ± 1.1 < 10−16
∆Hemoglobin A1c (%) CCI-all
educationa 204 6.20 ± 0.07 − 1.29 (1.32) < 10
−16 − 1.32 ± 0.09 < 10−16 6.29 ± 0.07 − 1.30 ± 0.09 < 10−16
Usual carea 72 7.94 ± 0.22 0.20 (1.35) 0.21 0.22 ± 0.16 0.17 7.84 ± 0.19 0.20 ± 0.15 0.18
CCI-all vs.
usual careb − 1.49 ± 0.18 4.4 × 10
−16 − 1.54 ± 0.19 4.4 × 10⁻¹⁶ − 1.50 ± 0.17 < 10−16
∆Systolic blood pressure (mmHg) CCI-all
educationa 187 126 ± 1 − 7 (16) 1.3 × 10
−8 − 7 ± 1 1.6 × 10⁻⁷ 126 ± 1 − 6 ± 1 1.3 × 10⁻⁸
Usual carea 67 129 ± 2 0 (18) 0.91 0 ± 2 0.83 129 ± 2 − 1 ± 2 0.67
CCI-all vs.
usual careb − 7 ± 2 0.005 − 6 ± 3 0.02 − 5 ± 2 0.02
∆Diastolic blood pressure (mmHg) CCI-all
educationa 187 78 ± 1 − 4 (9) 1.4 × 10
−7 − 4 ± 1 6.2 × 10⁻⁷ 79 ± 1 − 4 ± 1 7.2 × 10⁻⁸
Usual carea 67 81 ± 1 0 (10) 0.92 0 ± 1 0.75 81 ± 1 − 1 ± 1 0.45
CCI-all vs.
usual careb − 3 ± 1 0.01 − 3 ± 1 0.03 − 3 ± 1 0.06
∆ApoB (mg dL−1)
CCI-all
educationa 186 103 ± 2 − 1 (24) 0.69 − 0 ± 2 0.82 104 ± 2 − 2 ± 2 0.37
Usual carea 59 107 ± 5 2 (37) 0.75 1 ± 4 0.9 106 ± 4 0 ± 4 0.95
CCI-all vs.
usual careb − 2 ± 5 0.66 − 1 ± 5 0.83 − 2 ± 5 0.67
∆ApoA1 (mg dL−1)
CCI-all
educationa 185 160 ± 3 14 (24) 8.9 × 10
−16 14 ± 2 4.4 × 10⁻¹⁶ 160 ± 2 14 ± 2 < 10−16
Usual carea 59 145 ± 3 − 3 (19) 0.18 − 2 ± 3 0.55 147 ± 3 − 2 ± 3 0.37
CCI-all vs.
usual careb 18 ± 3 4.7 × 10
−9 16 ± 4 2.2 × 10⁻⁵ 17 ± 3 1.4 × 10⁻⁷
∆ApoB/ApoA1 CCI-all
educationa 185 0.67 ± 0.02 − 0.06 (0.17) 1.8 × 10
−6 − 0.06 ± 0.02 0.003 0.67 ± 0.02 − 0.07 ± 0.01 1.9 × 10⁻⁷
Usual carea 59 0.76 ± 0.04 0.03 (0.29) 0.42 0.02 ± 0.03 0.5 0.74 ± 0.03 0.02 ± 0.03 0.58
CCI-all vs.
usual careb − 0.09 ± 0.04 0.02 − 0.08 ± 0.03 0.02 − 0.09 ± 0.03 0.01
∆Triglycerides (mg dL−1)
CCI-all
educationa 186 151 ± 11 − 49 (168) 5.6 × 10
−5 − 50 ± 16 0.001 148 ± 12 − 48 ± 13 < 10−16
Usual carea 59 327 ± 65 30 (301) 0.44 31 ± 29 0.27 305 ± 48 28 ± 32 0.43
CCI-all vs.
usual careb − 80 ± 41 0.05 − 81 ± 33 0.02 − 76 ± 35 9.9 × 10
Table 2 continued
Completers All starters
(dropouts imputed)d
N 1 year
Mean ± SE Unadjusted Adjusted for baseline
c Unadjusted
Difference (SD)
or ± SE Significance
e
Differ-ence ± SE Significance e 1 year
Mean ± SE Differ-ence ± SE Significance e
∆LDL-C (mg dL−1)
CCI-all
educationa 172 111 ± 3 11 (32) 7.7 × 10
−6 11 ± 3 2.6 × 10⁻⁵ 113 ± 3 10 ± 2 4.9 × 10⁻⁵
Usual carea 48 90 ± 4 − 11 (38) 0.05 − 11 ± 5 0.03 90 ± 5 − 11 ± 5 0.02
CCI-all vs.
usual careb 22 ± 6 0.0003 22 ± 6 0.0002 21 ± 5 9.9 × 10
−5
∆HDL-C (mg dL−1)
CCI-all
educationa 186 50 ± 1 8 (12) < 10
−16 7 ± 1 < 10−16 50 ± 1 8 ± 1 < 10−16
Usual carea 59 35 ± 2 − 2 (9) 0.15 − 1 ± 2 0.69 37 ± 2 − 1 ± 1 0.41
CCI-all vs.
usual careb 9 ± 1 1.7 × 10
−10 8 ± 2 9.9 × 10⁻⁶ 9 ± 2 1.2 × 10⁻⁸
Triglycerides/HDL-C ratio CCI-all
educationa 186 4.3 ± 0.6 − 1.8 (9.4) < 10
−16 − 1.9 ± 0.9 < 10−16 4.1 ± 0.6 − 1.6 ± 0.7 < 10−16
Usual carea 59 12.5 ± 2.7 0.9 (16.1) 0.1 1.2 ± 1.6 0.16 11.2 ± 2.1 1.0 ± 1.7 0.24
CCI-all vs.
usual careb − 2.8 ± 2.2 3.1 × 10
−10 − 3.1 ± 1.8 5.5 × 10⁻⁷ − 2.6 ± 1.8 4.5 × 10⁻⁹
∆Large VLDL-P (nmol L−1)
CCI-all
educationA 203 6 ± 1 − 4 (7) 5.6 × 10
−15 − 4 ± 1 1.6 × 10⁻¹⁴ 6 ± 1 − 4 ± 1 4.2 × 10⁻¹⁵
Usual carea 68 12 ± 2 0 (8) 0.71 0 ± 1 0.60 12 ± 1 0 ± 1 0.77
CCI-all vs.
usual careb − 3 ± 1 0.001 − 3 ± 1 0.002 3 ± 1 0.0007
∆Total LDL-P (nmol L−1)
CCI-all
educationa 203 1234 ± 30 − 62 (375) 0.02 − 57 ± 29 0.05 1235 ± 29 − 64 ± 26 0.02
Usual carea 68 1196 ± 60 − 47 (491) 0.43 − 67 ± 53 0.21 1231 ± 57 − 57 ± 56 0.31
CCI-all vs.
usual careb − 15 ± 65 0.82 10 ± 62 0.87 − 7 ± 62 0.91
∆Small LDL-P (nmol L−1)
CCI-all
educationa 203 614 ± 22 − 164 (332) 2.2 × 10
−12 − 161 ± 24 4.1 × 10⁻¹¹ 613 ± 21 − 161 ± 23 1.2 × 10⁻¹²
Usual carea 68 724 ± 44 25 (370) 0.57 16 ± 45 0.71 740 ± 41 18 ± 42 0.67
CCI-all vs.
usual careb − 189 ± 51 0.0002 − 177 ± 52 0.0007 − 179 ± 48 0.0002
∆LDL-particle size (nm) CCI-all
educationa 201 20.53 ± 0.04 0.23 (0.54) 1.7 × 10
−9 0.23 ± 0.04 8.9 × 10⁻⁹ 20.53 ± 0.04 0.23 ± 0.04 6.0 × 10⁻¹⁰
Usual carea 68 20.25 ± 0.07 − 0.08 (0.53) 0.24 − 0.08 ± 0.07 0.25 20.25 ± 0.07 − 0.07 ± 0.06 0.25
CCI-all vs.
usual careb 0.30 ± 0.07 4.4 × 10
−5 0.31 ± 0.08 0.0002 0.30 ± 0.07 3.8 × 10⁻¹⁵
∆Total HDL-P (µmol L−1)
CCI-all
educationa 203 33.2 ± 0.5 1.5 (4.9) 1.2 × 10
−5 1.5 ± 0.4 2.1 × 10⁻⁵ 32.8 ± 0.4 1.5 ± 0.3 5.6 × 10⁻⁶
Usual carea 68 29.4 ± 0.8 − 0.8 (4.7) 0.15 − 0.8 ± 0.6 0.23 29.2 ± 0.7 − 0.7 ± 0.6 0.23
CCI-all vs.
Table 2 continued
Completers All starters
(dropouts imputed)d
N 1 year
Mean ± SE Unadjusted Adjusted for baseline
c Unadjusted
Difference (SD)
or ± SE Significance
e
Differ-ence ± SE Significance e 1 year
Mean ± SE Differ-ence ± SE Significance e
∆Large HDL-P (µmol L−1)
CCI-all
educationa 203 5.3 ± 0.2 1.0 (2.2) 2.5 × 10
−11 1.0 ± 0.2 4.1 × 10⁻¹¹ 5.3 ± 0.2 1.0 ± 0.2 1.2 × 10⁻¹¹
Usual carea 68 3.9 ± 0.3 0.1 (1.6) 0.69 0.2 ± 0.3 0.44 3.9 ± 0.3 0.1 ± 0.2 0.74
CCI-all vs.
usual careb 0.9 ± 0.3 0.0002 0.8 ± 0.3 0.01 0.9 ± 0.3 0.0004
∆LP-IR score CCI-all
educationa 203 58 ± 2 − 14 (18) < 10
−16 − 14 ± 1 < 10−16 58 ± 1 − 14 ± 1 < 10−16
Usual carea 68 74 ± 2 − 1 (16) 0.73 − 2 ± 2 0.41 75 ± 2 − 1 ± 2 0.74
CCI-all vs.
usual careb − 13 ± 2 3.8 × 10
−9 − 12 ± 3 6.2 × 10⁻⁶ − 13 ± 2 6.2 × 10⁻⁹
∆C-reactive protein (mg L−1)
CCI-all
educationa 193 5.7 ± 0.5 − 3.3 (13.4) < 10
−8 − 3.1 ± 1.0 < 10−16 5.6 ± 0.6 − 3.6 ± 1.1 < 10−16
Usual carea 70 10.4 ± 1.8 1.3 (13.3) 0.94 0.9 ± 1.7 0.88 10.3 ± 1.6 1.3 ± 1.5 0.93
CCI-all vs.
usual careb − 4.7 ± 1.9 1.2 × 10
−6 − 4.0 ± 2.0 3.0 × 10⁻⁵ − 4.9 ± 1.8 9.3 × 10⁻⁷
∆WBC (k mm−3)
CCI-all
educationa 204 6.5 ± 0.1 − 0.7 (1.4) 2.1 × 10
−11 − 0.7 ± 0.1 2.1 × 10⁻¹¹ 6.6 ± 0.1 − 0.7 ± 0.1 3.2 × 10⁻¹¹
Usual carea 72 8.3 ± 0.3 − 0.1 (1.6) 0.76 − 0.1 ± 0.2 0.74 8.1 ± 0.3 − 0.1 ± 0.2 0.76
CCI-all vs.
usual careb − 0.6 ± 0.2 0.003 − 0.6 ± 0.2 0.004 − 0.6 ± 0.2 0.003
∆10-year ASCVD risk (%) CCI-all
educationa 135 10.5 ± 0.7 − 1.6 (5.4) 0.0004 − 1.5 ± 0.6 0.01 9.6 ± 0.5 − 1.3 ± 0.3 4.9 × 10
−5
Usual carea 55 12.7 ± 1.5 1.4 (9.3) 0.28 1.1 ± 1.0 0.27 12.9 ± 1.2 1.2 ± 0.9 0.17
CCI-all vs.
usual careb − 3.0 ± 1.3 0.03 − 2.6 ± 1.2 0.03 − 2.6 ± 1.0 0.008
∆CIMT-average (mm) CCI-all
educationa 144 0.695 ± 0.009 0.002 (0.055) 0.63 0.003 ± 0.004 0.45 0.685 ± 0.010 0.002 ± 0.004 0.65
Usual carea 68 0.680 ± 0.013 0.004 (0.041) 0.37 0.002 ± 0.006 0.74 0.680 ± 0.013 0.001 ± 0.006 0.87
CCI-all vs.
usual careb − 0.002 ± 0.007 0.74 0.001 ± 0.008 0.87 0.001 ± 0.007 0.88
∆Statin (%) CCI-all
educationa 218 48.2 ± 3.4 − 3.7 (34.4) 0.12 − 3.6 ± 2.4 0.13 46.7 ± 3.2 − 3.3 ± 2.3 0.15
Usual carea 73 64.4 ± 5.6 9.6 (37.9) 0.03 9.5 ± 4.3 0.03 67.4 ± 5.4 8.8 ± 4.3 0.04
CCI-all vs.
usual careb − 13.3 ± 5.0 0.008 − 13.2 ± 5.0 0.009 − 12.1 ± 4.9 0.01
∆Any antihypertensive medication (%) CCI-all
educationa 218 56.4 ± 3.4 − 11.9 (42.3) 3.2 × 10
−5 − 11.9 ± 2.9 3.6 × 10⁻⁵ 55.8 ± 3.3 − 11.4 ± 2.8 5.3 × 10⁻⁵
Usual carea 73 60.3 ± 5.8 9.6 (41.4) 0.05 9.6 ± 5.1 0.06 61.2 ± 5.6 8.3 ± 4.8 0.09
CCI-all vs.
Discussion
This study demonstrates that a CCI utilizing remote phy-sician and health coach support with nutritional ketosis beneficially altered most CVD risk factors in patients with T2D at 1 year. Changes included: decreased small LDL-P, triglycerides, blood pressure and antihypertensive medication, hsCRP, and WBC count; increased HDL-C and LDL particle size; no change in LDL-P, ApoB, and cIMT and an increase in LDL-C. Combined with the pre-viously reported improvements in glycemic control and reduction in obesity [10], which reduce CVD risk [50], these results demonstrate multiple additional benefits of the CCI with the exception of increased LDL-C.
Studies of dietary carbohydrate restriction, with a pre-sumed increase in saturated fat intake, have shown mod-est changes in LDL-C levels [15, 26–28, 51]. The mean 10 mg dL−1 change observed in the CCI group in this study is numerically higher than the upper range of val-ues reported by meta-analysis of lipid changes over 1 year related to carbohydrate restriction (− 7 to + 7 mg dL−1) [52]. Higher LDL-C is related to increased CVD risk [53, 54], but also is inversely correlated with mortality in two large prospective studies and a systemic review [55–57]. Additionally, there is no evidence that increasing or decreasing LDL-C with diet interventions has any impact on mortality. LDL-C increased in the current study but
both ApoB and LDL-P, measures found to be better pre-dictors of CVD risk, did not change significantly [20– 23, 25, 58]. In addition, the reduction in small LDL-P, increase in LDL size, and decrease in large VLDL-P that occurred in the present investigation are also associated with reduced CVD risk [59–61].
A decrease in triglycerides and increase in HDL-C has also been previously reported in studies of carbohydrate restriction [15, 26–28, 50]. In patients with elevated base-line triglycerides (≥ 200 mg dL−1), a decrease in
triglyc-erides (− 21%) and increase in HDL-C (+ 18%), which is
similar to the changes observed in the intervention group in this study, has been associated with decreased CVD events [62]. Taken together, the decrease in triglycerides and increase in LDL-C may be partly due to decreased cholesterol ester transfer protein (CETP) exchange. Further studies on underlying mechanisms will help elucidate the causal relationships between the various concurrent changes in lipoproteins.
While mean response of CCI participants demon-strated an improvement in most lipid biomarkers and CVD risk factors other than LDL-C, we investigated whether a minority of participants might have unfavora-ble responses to the intervention. Our results suggest that a small number of participants (≤ 1%) demonstrated
changes at 1 year outside the range of what was observed
Table 2 continued
Completers All starters
(dropouts imputed)d
N 1 year
Mean ± SE Unadjusted Adjusted for baseline
c Unadjusted
Difference (SD)
or ± SE Significance
e
Differ-ence ± SE Significance e 1 year
Mean ± SE Differ-ence ± SE Significance e
∆ACE or ARB (%) CCI-all
educationa 218 28.9 ± 3.1 0.9 (27.1) 0.62 1.5 ± 1.9 0.42 30.0 ± 2.9 0.6 ± 1.9 0.76
Usual carea 73 21.9 ± 4.9 5.5 (28.3) 0.1 3.7 ± 3.3 0.27 23.4 ± 4.7 5.0 ± 3.3 0.13
CCI-all vs.
usual careb − 4.6 ± 3.8 0.23 − 2.1 ± 3.9 0.59 − 4.4 ± 3.8 0.24
∆Diuretics (%) CCI-all
educationa 218 31.7 ± 3.2 − 9.6 (41.3) 0.0006 − 9.5 ± 2.7 0.0004 31.3 ± 3.1 − 9.7 ± 2.7 0.0004
Usual carea 73 30.1 ± 5.4 5.5 (32.9) 0.16 5.2 ± 4.8 0.28 33.0 ± 5.3 3.2 ± 4.1 0.44
CCI-all vs.
usual careb − 15.1 ± 4.8 0.001 − 14.7 ± 5.6 0.009 − 12.8 ± 4.9 0.009
a Means (standard deviations) or ± one standard error are presented. Sample sizes, means, and significance levels refer to subjects with baseline and 1-year
measurements for completers, and to 349 subjects (262 intervention and 87 usual care) for all starters. Significance levels for completers refer to one-sample t test with or without adjustment. Untransformed triglyceride and C-reactive protein values are presented, however, their statistical significances were based on their log-transformed values
b Mean differences ± one standard error are presented. Significance levels refer to two-sample t test or analysis of covariance for the differences c Adjusted for sex, age, baseline BMI, baseline insulin use (user vs. non-user), and African–American race
d Imputed values based on 700 iterations from multivariate normal regression
in a usual care population (Additional file 3: Figure S1). Thus, these results counter the concern that a significant portion of participants may have an extremely adverse reaction to the CCI (due to presumed increase in satu-rated fat intake) as compared to UC.
Inflammation is directly involved in all aspects of the pathogenesis of CVD [33]. High-sensitivity CRP and WBC count are widely accepted markers of inflammation
and risk factors for CVD [29–32]. In addition to reducing cholesterol, reduction in inflammation may be a second-ary mechanism of statins in lowering CVD risk [63–65]. The present study demonstrated a 39% reduction of hsCRP and 9% reduction in WBC count in the CCI, indi-cating a significant reduction in inflammation at 1 year. This response may be due in part to suppression of the NLRP3 inflammasome by BHB [66].
The reduction of blood pressure with concurrent reduction in antihypertensive medication was also sig-nificant. Blood pressure goals were recently reduced [67] and strong evidence exists that elevated blood pressure is a primary cardiovascular risk factor [68]. An analysis
of a large T2D population suggested that antihyperten-sive medication may have limited effectiveness in reduc-ing the prevalence of hypertension in these patients [69], whereas a study of weight loss interventions showed that a decrease in blood pressure predicted regression of
carotid vessel wall volume [70]. Thus, additional lifestyle interventions that can augment blood pressure reduction such as the CCI described here may reduce CVD events. Additionally, the antihypertensives that were primarily decreased in the current study were shown to increase the risk for diabetes [71]. Their removal may represent further metabolic benefit.
Carotid intima media thickness (cIMT) is a non-inva-sive measure of subclinical atherosclerosis that is sig-nificantly associated with CVD morbidity and mortality [48, 49, 72, 73]. However, a recent meta-analysis in 3902 patients with T2D found that cIMT progression over an average of 3.6 years did not correlate with CVD events [72]. We found no significant change in cIMT from base-line to 1 year in either the CCI or UC groups. Progression or regression of cIMT may take multiple years to mani-fest and may require a larger cohort to achieve statistical significance [73]. In summary, the cIMT results from this study provide no evidence of vascular harm or benefit from 1 year of nutritional ketosis in patients with T2D.
Strengths and limitations of the study
Prior studies have demonstrated favorable improvements in atherogenic dyslipidemia with minimal or no change in LDL-C and LDL-P following managed ketogenic diets in small short-term randomized trials. This study’s strengths include its larger cohort with high retention, prospective design and 1-year duration. The study was the first to assess ApoB and ApoA1 in a T2D population adhering to a ketogenic diet. This study also has real-world application due to the outpatient setting without the use of meal replacements or food provisions.
Limitations of this study include the lack of randomi-zation between the CCI and UC groups. In addition, the intervention provided to CCI participants was of greater intensity than UC. This was a single site study and the racial composition of study participants was pre-dominantly Caucasian. The study was not of sufficient size and duration to determine significant differences in CVD morbidity or mortality. Since the interven-tion led to concurrent weight loss and improvements in cardiovascular health, it is difficult to conclude how much of the improvement can be attributed to weight loss versus other simultaneous physiological changes. In an attempt to assess the role of weight loss, a post hoc analysis of covariance on treatment versus control group differences in 1-year risk factor change suggested that weight loss was related to a large proportion of the change in: small LDL-P, ApoA1, triglyceride/HDL-C ratio, triglycerides, and HDL-C and LP-IR score. How-ever, the results from a recent study comparing a low-fat diet group with a low-carbohydrate group, with similar weight loss at 12 months between groups, suggest that
the role of weight loss may be more modest (the low-fat group showed only 15% of the HDL-C gain and 35% of the triglyceride decrease, relative to the low-carbohy-drate group) [74]. Additional future studies that tightly control weight loss (and other possible mechanisms for reduction in CVD risk, e.g. diet, smoking, genetic factors, stress, etc.) would lead to better estimates of how much weight loss independently contributes to the improve-ments observed in the intervention group relative to other factors. Furthermore, future trials could include a longer multi-site, randomized controlled trial to allow for hard end point evaluation. Greater racial and ethnic diversity, a broader age range, and greater disease sever-ity could also be evaluated.
Conclusions
A T2D intervention combining technology-enabled con-tinuous remote care with individualized plans encourag-ing nutritional ketosis has demonstrated diabetes status improvement while improving many CVD risk factors including atherogenic dyslipidemia, inflammation and blood pressure while decreasing use of antihyperten-sive mediations. Ongoing research will determine the continued safety, sustainability, and effectiveness of the intervention.
Abbreviations
ACE: angiotensin-converting-enzyme inhibitors; ApoA1: apolipoprotein A1; ApoB: apolipoprotein B; ARB: angiotensin II receptor blockers; ASCVD risk score: 10-year atherosclerotic cardiovascular disease risk score; BHB: beta-hydroxybutyrate; BP: blood pressure; CCI: continuous care intervention; CCI-onsite: subset of CCI participants who selected to receive onsite educa-tion; CCI-web: subset of CCI participants who selected to receive web-based education; cIMT: carotid intima media thickness; CVD: cardiovascular disease; GDR: glucose disposal rate; HOMA-IR: homeostatic model assessment of insu-lin resistance; hsCRP: high sensitive C-reactive protein; LP-IR: lipoprotein insuinsu-lin resistance score; T2D: type 2 diabetes; UC: usual care; VLDL-P: very low-density lipoprotein particle number; WBC: white blood cell.
Authors’ contributions
SJH, ALM, WWC, JPM, SDP and JSV conceptualized and designed the study. PTW performed the formal analysis. SJH and ALM contributed to the Additional files
Additional file 1: Table S1. Detailed baseline characteristics for par-ticipants in the continuous care intervention (CCI) and usual care (UC) groups.
Additional file 2: Table S2. Details on 1-year biomarker changes for participants in the continuous care intervention group compared to usual care group.
investigation. NHB and SJH wrote the original draft. NHB and PTW created the data tables and visualizations. All authors contributed to revising and editing of the manuscript. All authors read and approved the final manuscript.
Author details
1 Virta Health, San Francisco, CA, USA. 2 Medically Supervised Weight Loss, Indiana University Health Arnett, Lafayette, IN, USA. 3 Independent Consultant, Lafayette, CA, USA. 4 Department of Kinesiology and Health, Miami University, Oxford, OH, USA. 5 Department of Nutrition Science, Purdue University, West Lafayette, IN, USA. 6 Department of Genetics, Washington University School of Medicine, St. Louis, MO, USA. 7 Department of Human Sciences, The Ohio State University, Columbus, OH, USA.
Acknowledgements
The authors are extremely grateful to the research participants for offering their time and energy to participate in advancing scientific discovery. Thanks to Indiana University Health (IUH) staff, especially Tamara Hazbun, Monica Keyes, Danielle Wharff, Patti McKee, Joni Anderson, Zachary Roberts, Christina Selsor, and Douglas Jackson, and Virta Health staff Rachel Bolden, Sydney Rivera, and Deklin Veenhuizen for contributions to various aspects of the study including patient care, study coordination and data processing. Thanks to the health coaches who provided guidance to CCI participants: Brittanie Volk, Brent Creighton, Theresa Link, Bobbie Glon, and Marcy Abner. Thanks to Roxie McKee of IUH, Dave Gibson and Jennifer Powers of Washington University, and Teryn Sapper and staff from the Volek Laboratory at The Ohio State University for assistance in sample analysis, storage and/or transporta-tion logistics. Thanks to Angela Fountain, Irinia Shalaurova, and Jim Otvos of LabCorp for guidance on interpreting LipoProfile results. Thank you to Ronald Krauss for guidance on lipid analysis and Ethan Weiss for critical reading of the manuscript.
Competing interests
NHB, SJH, ALM, JPM, and SDP are employees of Virta Health Corp. and have been offered stock options. SDP and JSV are founders of Virta Health Corp. PTW and KDB are paid consultants of Virta Health Corp. WWC has no compet-ing interests.
Availability of data and materials
The datasets used and/or analysed during the current study are available from the corresponding author on reasonable request.
Consent for publication
Not applicable.
Ethics approval and consent to participate
This study was approved by the Franciscan Health Lafayette Institutional Review Board, and participants provided written informed consent.
Funding
The study was funded by Virta Health Corp.
Publisher’s Note
Springer Nature remains neutral with regard to jurisdictional claims in pub-lished maps and institutional affiliations.
Received: 9 February 2018 Accepted: 2 April 2018
References
1. Benjamin EJ, Blaha MJ, Chiuve SE, Cushman M, Das SR, Deo R, et al. Heart disease and stroke statistics-2017 update: a report from the American Heart Association. Circulation. 2017;135:e146–603.
2. Gregg EW, Gu Q, Cheng YJ, Narayan KMV, Cowie CC. Mortality trends in men and women with diabetes, 1971 to 2000. Ann Intern Med. 2007;147:149–55.
3. Centers for Disease Control and Prevention (CDC). National diabetes sta-tistics report, 2017. Atlanta: Centers for Disease Control and Prevention; 2017. p. 1–20.
4. Martín-Timón I, Sevillano-Collantes C, Segura-Galindo A, Del Cañizo-Gómez FJ. Type 2 diabetes and cardiovascular disease: have all risk factors the same strength? World J Diabetes. 2014;5:444–70.
5. Saslow LR. An online intervention comparing a very low-carbohydrate ketogenic diet and lifestyle recommendations versus a plate method diet in overweight individuals with type 2 diabetes: a randomized controlled trial. J Med Internet Res. 2017;19:e36.
6. Boden G, Sargrad K, Homko C, Mozzoli M, Stein TP. Effect of a low-carbo-hydrate diet on appetite, blood glucose levels, and insulin resistance in obese patients with type 2 diabetes. Ann Intern Med. 2005;142:403–11. 7. Yancy WS, Foy M, Chalecki AM, Vernon MC, Westman EC. A
low-carbohy-drate, ketogenic diet to treat type 2 diabetes. Nutr Metab. 2005;2:34. 8. Westman EC, Yancy WS, Mavropoulos JC, Marquart M, McDuffie JR. The
effect of a low-carbohydrate, ketogenic diet versus a low-glycemic index diet on glycemic control in type 2 diabetes mellitus. Nutr Metab. 2008;5:36.
9. McKenzie A, Hallberg S, Creighton BC, Volk BM, Link T, Abner M, et al. A novel intervention including individualized nutritional recommendations reduces hemoglobin A1c level, medication use, and weight in type 2 diabetes. JMIR Diabetes. 2017;2:e5.
10. Hallberg SJ, McKenzie AL, Williams PT, Bhanpuri NH, Peters AL, Campbell WW, et al. Effectiveness and safety of a novel care model for the man-agement of type 2 diabetes at 1 year: an open-label, non-randomized, controlled study. Diabetes Ther. 2018;9:568–612.
11. Wood TR, Hansen R, Sigurðsson AF, Jóhannsson GF. The cardiovascular risk reduction benefits of a low-carbohydrate diet outweigh the potential increase in LDL-cholesterol. Br J Nutr. 2016;115:1126–8.
12. Mansoor N, Vinknes KJ, Veierød MB, Retterstøl K. Effects of low-carbohydrate diets v. low-fat diets on body weight and cardiovascular risk factors: a meta-analysis of randomised controlled trials. Br J Nutr. 2016;115:466–79.
13. Fruchart J-C, Sacks F, Hermans MP, Assmann G, Brown WV, Ceska R, et al. The Residual Risk Reduction Initiative: a call to action to reduce residual vascular risk in patients with dyslipidemia. Am J Cardiol. 2008;102:1K–34K. 14. Arca M, Pigna G, Favoccia C. Mechanisms of diabetic dyslipidemia:
relevance for atherogenesis. Curr Vasc Pharmacol. 2012;10:684–6. 15. Volek JS, Fernandez ML, Feinman RD, Phinney SD. Dietary carbohydrate
restriction induces a unique metabolic state positively affecting athero-genic dyslipidemia, fatty acid partitioning, and metabolic syndrome. Prog Lipid Res. 2008;47:307–18.
16. Taskinen M-R, Borén J. New insights into the pathophysiology of dyslipi-demia in type 2 diabetes. Atherosclerosis. 2015;239:483–95.
17. Ginsberg BH. Factors affecting blood glucose monitoring: sources of errors in measurement. J Diabetes Sci Technol. 2009;3:903–13. 18. Adiels M, Olofsson S-O, Taskinen M-R, Borén J. Overproduction of very
low-density lipoproteins is the hallmark of the dyslipidemia in the meta-bolic syndrome. Arterioscler Thromb Vasc Biol. 2008;28:1225–36. 19. Cromwell WC, Otvos JD. Heterogeneity of low-density lipoprotein
par-ticle number in patients with type 2 diabetes mellitus and low-density lipoprotein cholesterol < 100 mg/dl. Am J Cardiol. 2006;98:1599–602. 20. Sniderman AD, St-Pierre AC, Cantin B, Dagenais GR, Després J-P, Lamarche
B. Concordance/discordance between plasma apolipoprotein B levels and the cholesterol indexes of atherosclerotic risk. Am J Cardiol. 2003;91:1173–7.
21. Otvos JD, Mora S, Shalaurova I, Greenland P, Mackey RH, Goff DC. Clinical implications of discordance between low-density lipoprotein cholesterol and particle number. J Clin Lipidol. 2011;5:105–13.
22. Cromwell WC, Otvos JD, Keyes MJ, Pencina MJ, Sullivan L, Vasan RS, et al. LDL particle number and risk of future cardiovascular disease in the framingham offspring study—implications for LDL management. J Clin Lipidol. 2007;1:583–92.
23. Sniderman AD, Toth PP, Thanassoulis G, Furberg CD. An evidence-based analysis of the National Lipid Association recommendations concerning non-HDL-C and apoB. J Clin Lipidol. 2016;10:1248–58.