E X A M I N A T I O N
O F
August 1999
DWI
CONVICTION RATE PROCEDURES
Technical Report Documentation Page
1. Report No.
DOT HS 808 970
2. Government Accession No. 3. Recipient's Catalog No.
5. Report Date
August 1999
4. Title and Subtitle
Examination of DWI Conviction Rate Procedures
6. Performing Organization Code
7. Author(s)
Jones, R.K.; Wiliszowski, C.H.; and Lacey, J.H.
8. Performing Organization Report No. 2097 Task Order 02
10. Work Unit No. (TRAIS) 9. Performing Organization Name and Address
Mid-America Research Institute 611 Main Street
Winchester, MA 01890
11. Contract or Grant No.
DTNH22-97-D-35018
13. Type of Report and Period Covered
Final Report
July 1997 - January 1999
12. Sponsoring Agency Name and Address’
National Highway Traffic Safety Administration Office of Research and Traffic Records
400 7th Street, S.W.
Washington, DC 20590 14. Sponsoring Agency Code
15. Supplementary Notes
Amy Berning was the COTR for this project.
16. Abstract
This report summarizes how DWI conviction rates are calculated. Arrest and conviction data were obtained from ten sites along with information and opinions from local officials on how DWI conviction rates should be calculated. It was found that often DWI conviction rates were not calculated, or at least the information would not be released publicly. When rates or calculation methods were released, calculation methods differed among the sites, and the type of conviction rate quoted was largely a function of the type of agency doing the quoting and the data available to that agency. The DWI conviction process can be affected by plea bargains, speedy trial laws, offenders who fail to appear, and pre-trial diversion practices. Although it would seem that a state-wide, complex system would be necessary to provide all the data required to provide a system-wide conviction rate, the smallest site included in the study proved that, with cooperation from all the organizations involved, an effective system can be set up in any jurisdiction. The objective of the project was to examine various
conviction rate formulas, but was not concerned with the success or lack thereof of convicting persons charged with DWI offenses in the participating jurisdictions. Individuals in those sites who agreed to participate in the project should be commended for providing data for the study, general system information, and views on the subject.
17. Key Words
Conviction rates, DWI, DUI, DWAI, DWI convictions, conviction rate formulas, calculated conviction rates, DWI arrests, FTA, failure to appear
18. Distribution Statement
This report is available from the National Technical Information Service, Springfield, Virginia 22161 (703) 605-6000.
19. Security Classif. (of this report)
Unclassified
20. Security Classif. (of this page)
Unclassified
21. No. of Pages 22. Price
TABLE OF CONTENTS
FIGURES TABLES
EXECUTIVE SUMMARY INTRODUCTION
SCOPE AND APPROACH
ORGANIZATION OF THE REPORT SITE DESCRIPTIONS AND ANALYSES CALIFORNIA- RIVERSIDE COUNTY
Description
DWI Enforcement System
Prosecution Patterns and Beliefs Quoted Conviction Rates
Calculated Conviction Rates COLORADO - PITKIN COUNTY
Description
DWI Enforcement System
Prosecution Patterns and Beliefs Quoted Conviction Rates
Calculated Conviction Rates
GEORGIA - ROCKDALE COUNTY
Description
DWI Enforcement System
Prosecution Patterns and Beliefs Quoted Conviction Rates
Calculated Conviction Rates NEBRASKA- OMAHA
Description
Prosecution Patterns and Beliefs Quoted Conviction Rates
City Prosecutor's Office
Nebraska Governor's Highway Safety Office
Calculated Conviction Rates
NEW JERSEY - MONMOUTH COUNTY
Description
DWI Enforcement System
Prosecution Patterns and Beliefs Quoted Conviction Rates
Calculated Conviction Rates
NEW JERSEY - OCEAN COUNTY
Description
DWI Enforcement System
Prosecution Patterns and Beliefs Quoted Conviction Rates
Calculated Conviction Rates
OHIO - CIRCLEVILLE AND PICKAWAY COUNTY
Description
DWI Enforcement System
Prosecution Patterns and Beliefs
Quoted Conviction Rates
Circleville Municipal Court
Calculated Conviction Rates TEXAS - TRAVIS COUNTY
Description
DWI Enforcement System
Prosecution Patterns and Beliefs Quoted Conviction Rates
Texas Department Of Transportation
Texas Commission on Alcohol and Drug Abuse
Calculated Conviction Rates
VERMONT - RUTLAND COUNTY
Description
DWI Enforcement System
Prosecution Patterns and Beliefs Quoted Conviction Rates
Vermont Center for Justice Research.
Calculated Conviction Rates
VERMONT - WASHINGTON COUNTY
Description
DWI Enforcement System
Prosecution Patterns and Beliefs Quoted Conviction Rates
Calculated Conviction Rates
COMPARISON OF CONVICTION RATES QUOTED CONVICTION RATES
CALCULATED CONVICTION RATES DISCUSSION OF CONVICTION RATES CONCLUSIONS AND RECOMMENDATIONS CONCLUSIONS
RECOMMENDATIONS REFERENCES
FIGURES
Figure 2-1: Pitkin County, Colorado DUI Systems Flowchart Figure 2-2: Rockdale County DUI Systems Flowchart
Figure 2-3: DWI Arrests In Omaha, 1992-1997
Figure 2-4: Omaha DWI Systems Flowchart
Figure 2-5: NJ Municipal Court DWI Systems Flowchart
Figure 2-6: Circleville OMVI Systems Flowchart
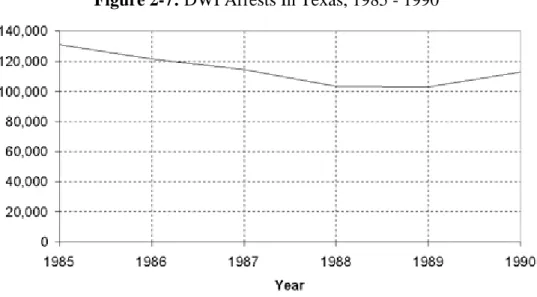
Figure 2-7: DWI Arrests In Texas, 1985-1990
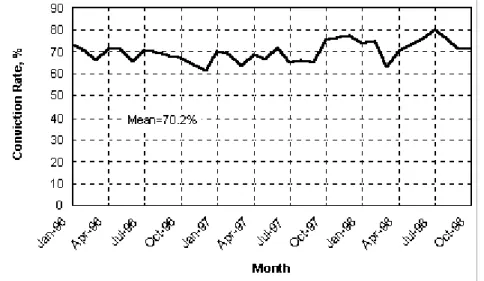
Figure 2-8: DWI Convictions as a Percentage DWI Dispositions in Texas, RC - 1996 - 1998
Figure 2-9: Vermont DWI Systems Flowchart - Charges Disposed
TABLES
Table 2-1: Project Sites
Table 2-2: Sex and Race Distribution of DWI Arrestees In Riverside County, California, 1995
Table 2-3: Dispositions of DUI Related Arrests by Pitkin County Sheriff's Office During the First Six Months of 1995 by Reporting Date
Table 2-4: DWI Conviction Rates in the State Court of Rockdale County, Georgia, 1994 - 1996
Table 2-5: Circleville/Pickaway County Project Data
Table 2-6: Quoted Conviction Rates, RC, FY 1996, for Travis County, Texas
Table 2-7: State of Vermont - Criminal DWI* Charges and Convictions, 1990 -1994
EXECUTIVE SUMMARY
This is the final report of a study of methods used to calculate conviction rates for DWI offenses. Conviction rate is important as one measure of the performance of the adjudication subsystem of the Traffic Law System in a given jurisdiction. Conviction rates can also be used to measure the
performance of the components of the adjudicative subsystem.
The objective of the project was to examine various conviction rate formulas, but was not concerned with the success or lack thereof of convicting persons charged with DWI offenses in the participating jurisdictions. We commend individuals in those sites who agreed to participate in the project and who provided data for our study, general system information, and views on the subject.
Specific objectives of the project were to:
• examine methods of calculating conviction rates by using data from ten sites;
• determine the implications (pro and con) of each of these methods; and
• develop methods for estimating conviction rates within, and across, jurisdictions to provide objective, accurate, and consistent information.
To do this, we developed:
• a description of the kinds of conviction rates constraints reported by the project sites along with their methods of calculating system-wide DWI conviction rates where applicable; and
• methods for determining or estimating system-wide conviction rates, along with the justification for the use of the methods.
We found through our discussions with practitioners in the field that the common public perception of a DWI conviction rate is the percentage of persons who are arrested for DWI who are actually convicted of that offense. However, we also found that in practice the DWI conviction rates which are reported are seldom that simple number, but rather the conviction rate of some subset of DWI arrests, or that
convictions for other offenses are included in the calculations. Given that finding, it is evident that there are any number of types of calculations which are represented as DWI conviction rates. In other words, what is reported as the DWI conviction rate in one jurisdiction may be an entirely different calculation than what is reported by another jurisdiction as its DWI conviction rate. For that matter, agencies within a jurisdiction may have similar differences.
Thus, when comparisons are made between jurisdictions on this important issue, it may well be like comparing apples to oranges. A jurisdiction which is receiving plaudits that reports only the results of cases which come to court, while many other cases are falling by the wayside, may well have a true conviction rate much lower than a jurisdiction which accurately reports a conviction rate that on the surface appears to be lower.
The major conclusions of the study are:
• There is great diversity among and within jurisdictions in what is reported as their DWI conviction rate.
• Many jurisdictions have difficulty relating DWI convictions to arrests made within a specific time frame.
• In many jurisdictions, failure to appear (FTA) in court, is a frequent problem with DWI offenders.
• Many agencies and jurisdictions choose to neither calculate nor publicize their DWI conviction rates.
• There is a quite natural tendency for agencies within jurisdictions to calculate and report that form of conviction rate which places them in the most favorable light.
We recommend that:
• When requesting DWI conviction rates, specify both the numerator and denominator, and request the raw numbers and the time period that the data are from, in addition to the calculated result.
• NHTSA should consider the true conviction rate to be the number of DWI convictions resulting from and divided by the number of DWI arrests in a given time frame. FTAs clearly would not be counted as convictions because these cases have not been adjudicated. Plea bargains might be counted as convictions if a jurisdiction has more than one level of DWI offense and it is common practice to reduce the charge to the lower level. If a jurisdiction includes plea bargains, it should be explained clearly that the conviction rate includes these alcohol-related, plea bargained offenses.
• NHTSA should consider encouraging jurisdictions and agencies to keep detailed records on the disposition of DWI arrests so that meaningful and consistent DWI conviction rates may be developed, published and compared. Statewide case tracking systems using information from a uniform traffic citation should be encouraged as a means for maintaining such records.
We believe the lack of credible field calculations of DWI conviction rates and the inconsistent methods of calculations should remain under careful scrutiny. Furthermore, we believe that agencies such as NHTSA should publicly define how DWI conviction rates should be calculated. Only then can progress be made in identifying and correcting system deficiencies.
INTRODUCTION
This is the final report of a study of methods used in several jurisdictions to calculate conviction rates for DWI offenses(1). It is designed to help answer such seemingly simple questions as, “given the number of drivers arrested for DWI, how many are convicted of a DWI offense?” What may appear to be an easy, straightforward question may be, in fact, impossible to answer across jurisdictions and populations.
In this study Conviction rate is important as one measure of the performance of the adjudication subsystem of the Traffic Law System in a given jurisdiction. The adjudication subsystem has the
responsibility of determining whether a person apprehended by a law enforcement officer for violating a traffic law actually violated that law. It follows that, in a given jurisdiction, the larger the number of arrested drivers who are convicted (either by pleading or by conviction in a trial court), the higher the performance of the adjudication subsystem as a whole. (This rule, of course, is subject to the constraint that fundamental fairness is provided in all adjudicative proceedings.)
Conviction rates can also be used to measure the performance of the components of the adjudicative subsystem. For example, a prosecutorial agency may divide the number of DWI convictions by the number of cases charged, while a court administrator might divide the number of DWI convictions by the number of DWI case dispositions. Other factors, such as failures to appear, pre-trial diversion programs, etc. can influence the overall rate depending on whether they are included in the calculation.
But here we are concerned with the performance of the system as a whole.
In addition to the inconsistency of the factors discussed above, adjudication and case-tracking time periods could vary and must be taken into account. There are potential problems with record keeping of multiple enforcement agencies policing the same jurisdiction and with a determination of the level of offense, for example, misdemeanor or felony, which can sometimes change when records are checked or if a death occurs after a DWI-related crash. Also, several courts sometimes handle DWI cases within a jurisdiction.
OBJECTIVES
The general objective of this project was to study various methods used across the United States to calculate conviction rates for DWI offenses. The National Highway Traffic Safety Administration (NHTSA) receives many requests for information regarding conviction rates of DWI offenders. However, there is no standard method of calculating a conviction rate.
Specific objectives of the project were:
• to examine different ways of calculating conviction rates by using data from ten sites;
• to determine the implications (pro and con) of each of these methods; and
• to develop methods for estimating conviction rates within, and across, jurisdictions to provide objective, accurate, and consistent information.
• a description of the kinds of conviction rates constraints reported by the project sites along with their methods of calculating system-wide DWI conviction rates; and
• methods for determining or estimating system-wide conviction rates, along with the justification for the use of the methods.
SCOPE AND APPROACH
This project involved several tasks. First, lists of prospective sites along with names of contacts and telephone numbers were compiled. The respective NHTSA regional offices were notified of the project and several responded with possible jurisdictions within their area that might be interested in
participating as project sites. Sites were not selected based on the efficiency of their judicial and adjudication systems, nor on any belief that a conviction rate was “high” or “low,” but only had to be able to supply us with the necessary data and, whenever possible, methods used to calculate DWI conviction rates. However, we did try for diversity among the sites regarding such factors as geographic location and population size.
Telephone interviews were conducted with appropriate site contacts to obtain information about
conviction rate formulas, sources of data, and interest in project participation. Once general information was received from a site, and the prospect of cooperation and interest seemed high, a site visit was made by project staff to arrange to receive appropriate data. In some areas, it was not necessary to visit the site to obtain all of the necessary information and records. Ultimately, ten sites were selected for study. A very generalized data collection plan was written early in the project year. However, specific details had to be worked out as data arrived from the project sites. As expected, the data varied greatly from site to site as to:
• availability (e.g. was there a tracking system which could provide data),
• condition (e.g. accurate and up-to-date),
• sources (e.g. was the same data reported differently from different agencies, also state versus local), and
• medium (e.g. what types of computer systems and software were in use and whether some data was only available in paper form).
Analyses of the data was a continuous process. As data arrived from sites, records were checked and in some cases, sampling procedures had to be used to extract a certain number of files. The numbers were sometimes entered into the conviction rate formulas, and formulas from similar sites, and the results were compared to those obtained by using the current conviction rate formula at that site.
ORGANIZATION OF THE REPORT
This report contains five chapters and an appendix. In Chapter 2, we present a site-by-site description and analysis which includes both calculated conviction rates and conviction rates quoted by staff who process DWI cases. This is followed by a comparison of conviction rates across sites (Chapter 3). Chapter 4 presents our conclusions and recommendations, and Chapter 5 lists the references.
SITE DESCRIPTIONS AND ANALYSES
As indicated in the prior chapter, this project was concerned with methods for calculating the conviction rate of a jurisdiction’s overall adjudication system. The exact way of determining such a rate is simply to count the number of those found guilty (either as a result of a plea or a trial) as a percentage of a
specified group of those arrested for DWI. The “specified group of those arrested” is most meaningfully defined as those arrested in a given period, say one year. Thus, the formula for the overall conviction rate, R, is:
R = 100 H (Number of DWI convictions of those arrested in a given period / Number of those arrested in the given period)
To compute R, one must start with the denominator. If the jurisdiction is a municipality served by just one law enforcement agency, then counts of DWI arrests by officers of that agency must be available for the period of interest. If all arrestees are adjudicated in just one court, then the dispositions of all these arrests must be available. Note that, because it takes time to process a case, not all of the dispositions occur in the same year of the arrests, but may be stretched out over a period of two or more years. Thus, one can never know the conviction rate for the current year or even the conviction rate for the prior year.
The situation becomes more complicated for jurisdictions with multiple police agencies and multiple courts. In general, a multiple-agency case tracking system (preferably, managed at the state level) is needed for such jurisdictions. In a word, the formula for the overall conviction rate is simple, but getting the data is not.
Jurisdictions without the requisite systems in place to compute an exact conviction rate (in our experience, most jurisdictions) have to resort to estimates. Two possible ways of estimating the conviction rate are:
REST1 = Number of convictions in a given period / Average annual number of arrests over a given period
preceding the period for which the convictions were calculated
REST2 = Number of convictions in a given time period / Number of arrests in the same time period
Clearly, the first of these two estimates would be preferred in most instances. For example, if a
jurisdiction’s court(s) had 3,000 convictions in 1998 and its police agencies arrested an average of 2,000 drivers per year over the past three years, then its estimated conviction rate REST1 would be 67%. The
second estimate should only be used as a last resort where there is little year-to-year variation in arrests and convictions, because the convictions would be for a different time period than the arrests, and therefore would be a rough estimate. In one jurisdiction, we were able to calculate both the exact rate and the first estimated rate (REST1) above.
Finally, six jurisdictions only had data for computing the conviction rate for the court subsystem of the overall system, that is, a rate based on total dispositions. Note that this rate measures the performance of only a part of the court subsystem, since it does not account for defendants who fail to appear or, in some jurisdictions, whose cases are dismissed. We present this rate as matter of interest, since it was
often quoted as a jurisdiction’s conviction rate. The formula for the court subsystem (designated RC) is
simply:
RC = Number of guilty dispositions in a given period / Number of dispositions in a given period
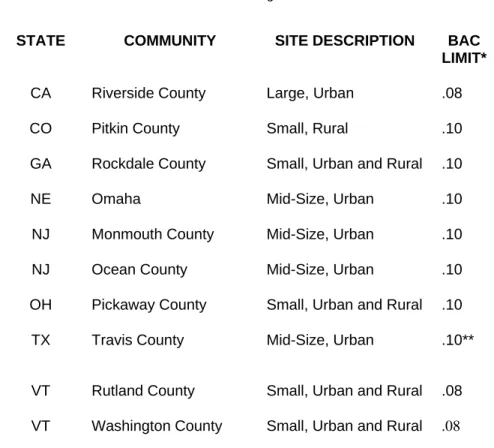
This chapter presents the results of our attempts to calculate these rates in each of the following 10 jurisdictions (Table 2-1). Also presented in this chapter are detailed case studies of the jurisdictions’ adjudication systems and circumstances pertinent to determining the conviction rates.
Table 2-1: Project Sites
STATE COMMUNITY SITE DESCRIPTION BAC
LIMIT*
CA Riverside County Large, Urban .08
CO Pitkin County Small, Rural .10
GA Rockdale County Small, Urban and Rural .10
NE Omaha Mid-Size, Urban .10
NJ Monmouth County Mid-Size, Urban .10
NJ Ocean County Mid-Size, Urban .10
OH Pickaway County Small, Urban and Rural .10
TX Travis County Mid-Size, Urban .10**
VT Rutland County Small, Urban and Rural .08 VT Washington County Small, Urban and Rural .08
* BAC is the acronym for blood and breath alcohol concentration levels expressed as grams per deciliter.
CALIFORNIA - RIVERSIDE COUNTY
Description
Riverside County, California borders the counties of Los Angeles, San Diego, Orange and San Bernardino and is the fourth largest county in the State of California. Between 1980 and 1990, the population rose 76%, according to the U.S. Census Bureau, making it the fastest growing county in California. The population rose another 21% from 1990 to 1998 (and almost 3% from 1997 to 1998). The population of Riverside County in 1998 was 1,478,800 with 86% living in urban areas and 14% in rural areas. Per capita income was reported by the Census Bureau at $14,510. The city of Riverside is the county seat and also the largest urban area within Riverside County.
DWI Enforcement System
DWI enforcement is handled by the California Highway Patrol (CHP), the Sheriff’s department and the Riverside Police Department. Reportedly, the bulk of DWI arrests are handled by CHP. The Sheriff’s department handles most issues surrounding warrants. The BAC per se level in California is .08.
Prosecution Patterns and Beliefs
DWI is a criminal offense in California handled by municipal and superior courts. Municipal traffic courts handle non-injury, first, second and third offense DWI cases which are considered misdemeanors. In these cases, the person accused signs a ticket at the scene or receives an order to appear at
arraignment. Apparently, a significant percentage of persons charged with traffic offenses fail to appear at the court arraignment, although it is unclear how many of these are DWI related charges. Superior court handles all injury-related DWI cases and those involving four or more offenses. In these cases, the persons charged are to be arrested and held pending arraignment. However, due to overcrowded
detention facilities, these individuals are often released. After their first court appearance for arraignment where the charges against the individual are read along with their status (for example, bailed out or cited out), these individuals are scheduled for a preliminary hearing before proceeding to court.
Quoted Conviction Rates
According to the Riverside District Attorney’s Office, DWI conviction rates are not calculated with any regularity, rather they rely on the state reports. However, they were one of the first agencies to question statistical methods used to calculate DWI conviction rates, and the apparent lack of uniformity among calculations. They suspected problems might stem from various reporting strategies by law enforcement agencies and how arrests are entered into databases used by state agencies as part of the statistical equations. While staff in the Riverside District Attorney’s Office were questioning how DWI conviction rates were calculated in the State of California, they contacted NHTSA to question if there was an accepted method of calculation. This inquiry was, in part, the impetus for this project.
Calculated Conviction Rates
We used the state-level data provided by the California DMV. DWI arrests during the calendar year 1995 were tracked through December 1997, permitting an accurate estimation of R. Out of the 9,190 arrests, 5,870 ultimately were convicted resulting in a conviction rate of:
R= 5,870 / 9,190 = 0.639 = 63.9%
The data also permitted the calculation of a few characteristics of the DWIs. Table 2-2 shows the sex and race distribution of the arrestees, indicating that 88% were males. About 90% were either white or Hispanic, with the Hispanic group being slightly the larger of the two. About 6% were African
American, and Asian and American Indian were only about one-half percent each.
The mean age of the arrestees was 34.3 years, and the mean age of those convicted of DWI was
essentially the same, 34.6 years. The arrestee group had a slightly higher percentage of younger drivers (age < 21 years) than did the offender group (6.8% versus 5.7%).
Table 2-2: Sex and Race
Distribution of DWI Arrestees In Riverside County, California, 1995
Characteristic N % Sex Male 8,091 88.0 Female 1,099 12.0 Race White 4,000 43.5 African American 577 6.3 Hispanic 4,289 46.7 American Indian 55 0.6 Asian 50 0.5 Other 219 2.4
COLORADO - PITKIN COUNTY
Description
Pitkin County, Colorado is located in the Rocky Mountains near the center of the state. The largest urban area in the county is the town of Aspen which is also the county seat. The U.S. Bureau of the Census reported a 1998 population of 13,423. According to the 1990 U.S. Census Data, roughly 60% of county residents at that time resided in rural areas. Per capita income in 1993 was reported as $39,481, but had fallen to $26,755 in 1998.
DWI Enforcement System
The Pitkin County Sheriff’s Office (PCSO) has provided an informal coordinating function for DUI enforcement activities for Pitkin County law enforcement agencies for the past several years. This has largely grown out of a grant application and administration function as the cooperating agencies have periodically made application to the Colorado Department of Transportation for funding for enhanced DUI enforcement. Enforcement of DUI laws are considered an important element of patrol activities by the police agencies in the county and regular, publicized saturation patrol DUI enforcement efforts are mounted. The Sheriff’s Deputy who serves as the countywide DUI enforcement coordinator also keeps detailed information on arrests and dispositions, which are used for local purposes as well as for documentation to be included in grant applications for anti-DUI activities. Note that the Sheriff’s Department keeps DUI arrest and disposition records for the local enforcement agencies (Aspen Police Department, Snowmass Village Police Department, Basalt Police Department, Carbondale Police Department as well as their own alcohol-related arrests) but not the Colorado State Police operating within Pitkin County. The discussion of DUI conviction rates here is confined to PCSO DUI cases. But similar data are maintained for these other agencies.
Prosecution Patterns and Beliefs
DUI cases are adjudicated in the 9th Judicial District which serves Pitkin and two other counties. DUIs (with the exception of offenses such as vehicular homicide while DUI) are misdemeanors in Colorado. The Pitkin County Court hears PCSO DUI cases at the Pitkin County Court House in Aspen. Cases are prosecuted by prosecutors from the 9th Judicial District Attorney’s Office. In Colorado, the DUI offense is a per se offense at the .10 BAC level. Though clearly impaired drivers may be convicted of DUI at levels lower than .10, as a practical matter, most are not. However, there is a lesser included offense of Driving While Ability Impaired (DWAI) with a presumptive level of .05 and above. Unless extreme impairment is evident, if a DUI arrestee is tested and has a BAC between .05 and .10, the charge is immediately amended to be DWAI and they are tried for that offense. For the purposes of conviction rate calculations, local authorities consider a DWAI conviction to be a conviction as charged for this category of case. However, a DWAI conviction for a DUI charge is counted as a conviction for a lesser included offense. In practice, many non-crash involved first DUI offenders with BACs below .18 are allowed to plead guilty to DWAI rather than go to trial. By statute, DUI or DWAI may not be reduced to a non-alcohol related offense unless the District Attorney states in open court that he/she does not have a prima facie case. Such instances are extremely rare in Pitkin County as are instances of dismissal.
Another rare occurrence is to offer deferred judgment and sentence where the case is dismissed if terms of a probation are served successfully.
Figure 2-1: Pitkin County, Colorado DUI Systems Flowchart
Quoted Conviction Rates
As indicated earlier, the Pitkin County Sheriff's Office, with the assistance of the District Attorney's Office, compiles and reports detailed conviction rates for DUI cases. These reports indicate the current status of all cases charged in a specific time frame. The example presented here is for arrests made by PCSO during the first six months of 1995. We present below Table 2-3 with three columns. It represents information from two reports prepared by the PCSO, the first in August 1995 and the second in August 1997.
Table 2-3: Dispositions of DUI Related Arrests by Pitkin County Sheriff's Office During the First Six Months of 1995 by Reporting Date
Disposition as of August 1995 as of August 1997
Convicted of Original Charge 26% 33%
Driving Under the Influence - Alcohol , Plea Bargained to Driving While Ability Impaired - Alcohol
53% 61%
Driving Under the Influence - Drugs, Plea Bargained to Driving While Ability Impaired - Drugs
0% 0%
Driving Under the Influence - Drugs, Plea Bargained to Possession 0% 0% Reduced to Non-Alcohol Offense 0% 0% Dismissed 0% 0% Acquitted at trial 0% 0% Deferred 0% 0% Pending 6% 0% Failure to Appear 6% 6% Unknown 9% 0% TOTAL 100% 100%
One can see by examination of the table above that cases are tracked using date of arrest as the defining element of eligible cases and that the reporting is dynamic in nature in that the reported dispositions were updated for the two illustrative reporting dates of August 1995 and August 1997.
Calculated Conviction Rates
We were provided the raw data used by the PCSO in calculating their DWI conviction rate for the 34 drivers arrested during the first six months of 1995. These individuals were tracked manually by PCSO staff to determine the outcomes of their cases as of August 1997. The conviction rate for those charged or plea-bargained of either DUI or DWAI was:
R = 32/34 = 94.1%
This is exactly the same as indicated in the preceding table under the column for disposition as of
August 1997 (33% convicted of original charge plus 61% convicted of DWAI = 94%), and is the correct measure of the performance of the County’s adjudication subsystem in processing the 34 arrests. The remaining two arrests (5.9%) resulted in a failure to appear (FTA) in court as of the reporting date (August 1997). All of those who did appear were convicted of an alcohol-related offense, either DUI or DWAI. Conceivably, at some later date, the two FTAs could appear and, possibly, be convicted,
GEORGIA - ROCKDALE COUNTY
Description
Rockdale, the county with the smallest area in Georgia, is southeast of Atlanta. The county encompasses small urban, suburban and rural areas. The county seat is in Conyers, Georgia. According to the Bureau of the Census, the population of Rockdale County has been increasing steadily from 36,600 in 1980 to a 1995 population of 64,500. Per capita personal income for the County in 1993 was $19,267.
DWI Enforcement System
In Georgia, the DWI offense is a per se offense at the .10 BAC level. DWI laws are enforced by three agencies, the Rockdale County Sheriff’s Department, the Conyers Police Department, and the Georgia State Patrol. DWI arrests by the Georgia State Patrol (GSP) and the Sheriff’s Department are
adjudicated in the State Court of Rockdale County. The Rockdale County court is, as the name implies, classified as a “state court,” and has one judge who hears about 500 DWI cases a year. (See study by Jones, R.K.; and Lacey, J.H., 1998.) DWI arrests by the Conyers Police Department are adjudicated by the Conyers Municipal Court which also operates the City’s Traffic Violations Bureau. The Municipal Court has less than half the volume of DWI cases as the State Court.
DWI tickets are brought to the prosecuting clerk’s office. DUI defendants do not get a chance to come to court until prosecutors file the case. This allows prosecutors time to prepare the case before the speedy trial clock starts. The laws regarding speedy trials require a case to be tried within the remainder of the current court session or by the end of the next court session. Each court session is three months long, so a case going to trial will be completed within a maximum of 180 days. A Criminal Case Management System has been in place since 1987. This system tracks each case through the criminal justice system including jail. The State Court judge keeps statistics on every case, getting information on “pleaders” just before the pronouncement of a guilty verdict and then using that information to structure sentences.
Prosecution Patterns and Beliefs
Police officers in Rockdale County believe the courts there impose tougher sentences than do other counties in Georgia. As with most other jurisdictions, few DUI cases go to trial; one officer reported that out of 800 DUI arrests, he only testified at four jury trials. A prosecutor reported that only four out of 62 DUI cases on the docket on a particular day would be tried. Officers, nevertheless, must be prepared to take all cases to trial. Preparation will result in more guilty pleas without any trial. A prosecutor reported that written, documented information is extremely important.
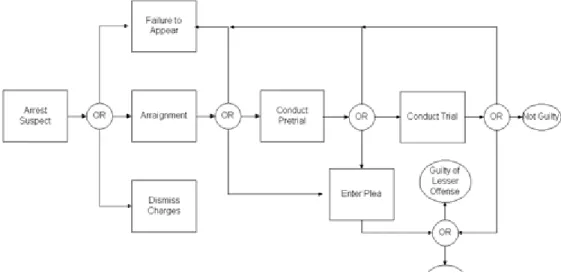
Pre-sentence investigations are not routinely performed, although the judge does question suspects at arraignment and at trial just before sentencing. The following diagram depicts the flow and possible outcomes of DUI cases handled in Rockdale County.
Figure 2-2: Rockdale County DUI Systems Flowchart
Quoted Conviction Rates
Conviction rates were not being calculated at the time of this report by the courts nor the law enforcement agencies operating within the county.
Calculated Conviction Rates
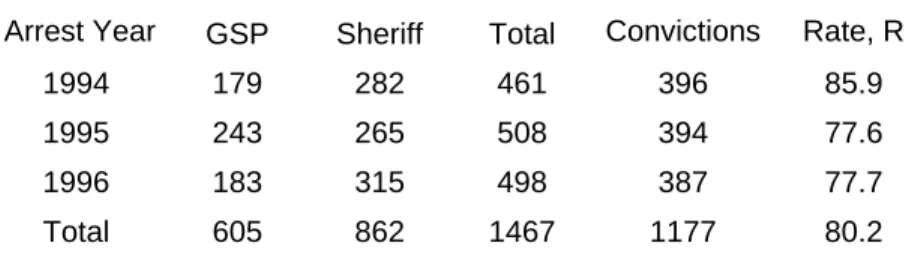
We were able to locate data for determining the dispositions in the State Court of Rockdale County of all the DWI arrests made by the Sheriff’s Department and the GSP in 1994, 1995, and 1996. The arrest date were obtained from the two enforcement agencies, and the dispositions were obtained from the Judge’s own database as maintained by court staff. The results are shown in Table 2-4 below.
The last column contains the conviction rate, R. The highest rate occurred in1994 (86%), with 1995 and 1996 having the same rate at 78%. The average rate for all three years was approximately 80%. The rates are approximate, since a few arrests from the Conyers Police Department went to the State Court rather than the Municipal Court, and a few arrests from the other two agencies went to the Municipal Court rather than the State Court.
Note that the numbers of convictions shown did not necessarily occur in the arrest year. For example, six persons out of those who were arrested in 1994 and eventually convicted, were not convicted until 1996. However, nearly all of those arrested in a given calendar year were convicted by the end of the following calendar year.
Table 2-4: DWI Conviction Rates in the State Court of Rockdale County, Georgia, 1994 - 1996 Arrests
Arrest Year GSP Sheriff Total Convictions Rate, R
1994 179 282 461 396 85.9
1995 243 265 508 394 77.6
1996 183 315 498 387 77.7
NEBRASKA - OMAHA
Description
Omaha is located in Douglas County, Nebraska and covers most of the county. Douglas County is located mid-center on the eastern border of Nebraska, directly west of Council Bluffs, Iowa. Major industries include insurance companies, telephone services, oil refining and agricultural related industries. According to U.S. Census Bureau data, the total resident population of Douglas County in 1995 was roughly 434,000 persons. The 1990 census data reported approximately 396,000 persons lived inside the Douglas County, Nebraska urbanized area (Omaha) and approximately 20,500 individuals lived outside the urbanized area and in rural areas. The Douglas County per capita 1993 income was reported as $23,322.
DWI Enforcement System
Various discussions were held during the course of this project with the City Prosecutor and staff about the county court system. The number of court filings (all cases) has increased dramatically during the past twenty years from 10,118 in 1977 to 61,000 in 1997. (Note: Until mid-1985, there were the following courts in Omaha: Municipal Court, County Court and District Court. On July 1, 1985, the Municipal and County Courts were merged and so currently there is County Court and District Court.) Individuals in the city prosecutor’s office had estimated 85% of the county population live within the city of Omaha, while the census data above indicates a figure closer to 95%. Due to this population placement within Douglas County, the Omaha police department (OPD), as opposed to multiple enforcement agencies, arrests the majority of DWI suspects. For this project, we concentrated on suspects arrested by OPD and adjudicated in County Court.
The number of arrests for DWI has ranged from about 3,300 to 4,000 per year during the six year period 1992-1997 (Figure 2-3). In Nebraska, the DWI offense is a per se offense at the .10 BAC level. When an officer makes an arrest, the resulting ticket number and information is sent to the Douglas County Retention Center where the data is entered into the criminal justice information system. The data center merges the information on the ticket with various automated items and the cover sheets are printed and sorted by date. The attorneys in the city prosecutor’s office then decide what charges to set. Reportedly they decline to prosecute only about one in every 200 cases. These few cases are captured in the system and classified as dismissed charges although the reasons for dismissal are not noted. The system codes are not finely defined.
Figure 2-3: DWI Arrests In Omaha, 1992 - 1997
Prosecution Patterns and Beliefs
Charges of DWI are considered by the City Prosecutor’s office to be the most important cases handled by the County Court and are actively prosecuted as has been the practice for many years. The City Prosecutor is proud of the fact that they actively pursue DWI offenders. The following diagram depicts the flow and possible outcomes of DWI cases.
The majority of DWI defendants plead guilty. There was a time when the city prosecutor’s office might have 50 trials set and have six trials “in a bad month.” Prosecutors estimated winning 90% of their trials for a long period of time and the number of trials declined to a fraction of the previous levels (the current rough estimate is 12 trials per year). But the number of requests for trials has not declined, in part, because a third offense is a class one misdemeanor which brings a mandatory jury trial. In those cases, a jury trial must be waived by the defendant; otherwise, a trial is automatic. So, the number of potential jury trials is still fairly high, but the number of actual trials is relatively low. There are 30-40 requests per month for third offense DWI cases.
There is another dynamic change that took place during the course of this project. The state legislature passed a law which makes a fourth offense DWI a felony. This means the office of the county attorney (not the city prosecutor) will be handling felony DWI offenders. The County has handled some pending cases in the past, but the majority of cases have been handled by the city prosecutor’s office. However, this change began in 1998 and does not affect this project or the 1997 data provided.
Batches of DWI files come in daily and the cases are divided by the prosecutors and set for court dates. Under the current system, the attorneys look at criminal history, which includes both a traffic printout and criminal history. This will show if the defendants had a DWI charge dismissed previously. The attorneys will also look for such things as “dummy names.” If the city prosecutor’s office finds a defendant with three or more prior DWI convictions, the case will now be sent to the county attorney to handle as a felony.
Quoted Conviction Rates
City Prosecutor’s Office. Conviction rates are calculated internally by the city prosecutor but are not used for the purpose of publication. When asked to quote a rate, such as was reported in the Omaha
Morning World Herald article in 1997, “City’s DWI Conviction Rate was 98% in >96,” the following calculation is used:
Conviction Rate = RC = Number of guilty dispositions / Number of all dispositions
There is a real concern about releasing a conviction rate to the media and to the public because of perceived misinterpretations of what the rate represents. This is magnified if FTAs are factored into the calculation because in areas with a large number of outstanding warrants (incidentally, not the case in Omaha), the rate dramatically decreases. The public and the offenders will most likely get the message that it is possible to avoid retribution if they can avoid the system.
In addition, theoretically, some prosecutors could be worried enough about conviction rates to get rid of cases on the front end during the charging process which they might lose to improve or maintain a high conviction rate.
Reportedly, there are probably several dozen cases a year calculated as lost cases which actually were prosecuted successfully for a more serious crime. For example, willful reckless and, occasionally, reckless are amended charges. Both of these are class 3 misdemeanors which carry considerably higher penalties. Sometimes offenders accept the more serious amended charges rather than the stigma of a DWI with a possible enhanceable future offense. The defendant pleas to the more serious charge and that’s the only fallback position the prosecutor’s office gives the offender. The city prosecutor’s office
counts that as a lost case for a DWI conviction but it shows up on the county database as a conviction for the amended charge.
Another problem is the “dismissal docket” where a batch of old cases is sent to the City Prosecutor’s office and staff are asked to get rid of the cases when the persons charged do not appear in court and a lengthy period of time has passed. They find this process incredulous, stating, “Let’s reward these people for not bothering to show up for trial. They’re not discharged for speedy trial. These are people with legitimate warrants.” The prosecutors appear and argue and sometimes win, allowing the cases to remain, but sometimes the cases are dismissed despite their arguments. The City Prosecutor considers FTAs as pending cases, although sometimes pending for a long period of time. “You can’t count a pending case as a disposition.” Pending cases are still viable.
After thinking about this project, reviewing a draft report and reflecting on the way local conviction rates had been calculated in the past, the Omaha City Prosecutor concluded they had been keeping track of cases that had been lost, whether declined, or dismissed or not guilty. They really have a
“non-conviction rate of 2%.” FTAs were not counted in the equation. He now would likely recommend selecting a number of cases (e.g., beginning November 1st, the next 100 cases will form the pool), write down the arrest numbers so these cases may be electronically retrieved, return after a one year period (or some specified period of time), find out the dispositions for those cases, decide on how (or if) to report FTAs, and calculate the conviction rate. This eliminates using arrests and convictions for different cases from different periods of time in the same formula.
Again, the City Prosecutor offered words of caution. In Omaha, he is proud that police and prosecutors work together to prosecute cases where the defendant is at or below the legal limit, when officers know the person was impaired and a danger to the public. “If you start becoming a slave to your conviction rate, the temptation is, if we’re not winning very many .10 cases, don’t fool with them so our conviction rate doesn’t suffer.” He warns, “...conviction rates can eventually trickle down to not only dictating filing decisions, but even arrest decisions.” “We really should be encouraging our prosecutors to trust our law enforcement officers.”
Nebraska Governor’s Highway Safety Office. The State of Nebraska calculates DWI conviction rates by county from year to year. However, they caution that this is a “raw calculation” and should only be used to provide a general indication of conviction rate trends. The rates are calculated starting with
convictions recorded in a calendar year on driver records files, divided by arrests in a calendar year, that is:
Conviction Rate = REST2 = Number of Convictions / Number of arrests
The Governor’s Highway Safety Office points out that, in some cases, the convictions in the numerator are for a different calendar year than the arrests in the denominator. In addition, the driver records are for drivers licensed in Nebraska, and so do not indicate out of state drivers. In Omaha, these numbers could be significant because the city is located on the border of Iowa. And, conversely, residents of Douglas County arrested in another county, or perhaps out of state, appear in the convictions group but not in the arrests made in Douglas County. There are other factors, such as FTAs are not accounted for, and the cases are combined to cover all enforcement agencies and courts within Douglas County (although, as stated above, the vast majority of DWI arrests are made by the Omaha Police Department and adjudicated in County Court by the city prosecutor’s office).
Calculated Conviction Rates
The data we used to calculate conviction rates consist of 4,089 records of DWI charges extracted from the city prosecutor’s files for 1997. The variables include the arrest number, charge(s), incident date, statute, defendant date of birth, driver license number, BAC level, disposition and the date of the
disposition. The possible findings (dispositions) include: guilty, probation, suspended sentence, juvenile (transferred to juvenile court), dismissed (not prosecuted and those found not guilty) and other (mis-assigned). The database does not distinguish between cases lost, dismissed at time of trial and later refiled, or rarities such as if the defendant died, all of which appear as dismissed dispositions. The finding will show up as not guilty if a trial was held and the defendant was found not guilty. There was concern about the possibility of being unfairly tagged with numerous dismissals for other reasons which would inaccurately be labeled as cases that the prosecutors did not win.
As stated above, some of the system codes are not finely defined. For example, if a person is arrested for drunk driving and convicted of willful reckless driving, initial charges are recorded in one column, and in another column, there is the amended or disposition charge which would be different than the drunk driving charge. The problems are that there is an inability to differentiate between
1.) what was done initially at filing (see next paragraph) because of, for example, a low BAC or, 2.) what was amended at trial or found guilty by the court for a lessor included charge.
An additional problem is that the database always lists the first charge as the primary charge, which may not have been the case at the time of arrest. If there are three different charges, the prosecutor can
change the order of the charges when setting the case which affects how the record shows up in the database. These data files show if a case is dismissed or an offender is convicted along the line, but do not show reduced charges. The city prosecutor’s office was uncertain how reduced charges were recorded.
We first calculated an estimate of the overall system conviction rate, R. To do this, we used data
covering just the first six months of DWI arrests (January-June 1997). This allowed a at least a full year after arrest for case disposition, ensuring disposition of just about all cases for which the defendant appeared in court.
There were a total of 1,993 such cases, 1,774 (88.0%) of which resulted in a finding of guilty (by plea or by trial). The remaining 12% of the dispositions were composed of a not guilty finding (3.7%) and no finding (8.3%). The not guilty findings include cases for which the DWI charge was dismissed. The “no finding” cases apparently consist of those where the persons failed to appear in court at some point along the judicial process so that no disposition of these cases occurred. These cases are considered a good estimate of the failure to appear rate for Omaha.
The data allowed one to compute dispositions as a function of defendant age. There was no significant difference (p = 0.50) in case disposition between young drivers (age < 21 years) and older drivers (age $21 years).
The estimated conviction rate REST1 was computed for the year 1997 using arrest data from 1995 and
1996 (see Figure 2-2), and conviction data from 1997. This rate was 3,514 / 3,800 = 92.5%, about 4.5 percentage points higher than R.
We also calculated the conviction rate based on total dispositions in a year. The year was 1997, and RC
turned out to be 3,514 / 3,665 = 0.959, indicating that about 96% of all DWI case dispositions were guilty findings.
Finally, as a matter of general interest, we calculated the mean time from arrest to disposition for Omaha DWI defendants. For defendants arrested in the first six months of 1997, an average of 2.93 months were required to dispose of a DWI case. Cases resulting in a finding of not guilty took slightly longer on the average than did cases resulting in a finding of guilty (3.16 months and 2.92 months, respectively), reflecting the higher likelihood of a trial for the not guilty group. This difference between means, though small, is statistically significant (p < 0.0001).
To summarize, our calculated conviction rates were: R = 0.880 = 88.0%
REST1 = 0.925 = 92.5%
NEW JERSEY - MONMOUTH COUNTY
Description
Monmouth County, New Jersey is located south of Newark. The U.S. Census Bureau reports a
population of 603,434 up 1.1% from 1997. Roughly 90% of the population resides in urban areas. Per capita income in the County is listed at $20,565.
DWI Enforcement System
New Jersey State Police and various Municipal Police Departments handle most DWI arrests. In New Jersey, the DWI offense is a per se offense at the .10 BAC level. All law enforcement agencies use uniform traffic tickets (UTT) when making a DWI arrest. These traffic citations are all compiled by the statewide Automated Traffic/Complaint System. Police dispatchers have access to this system which, in turn, provides officers in the field with valuable information.
Prosecution Patterns and Beliefs
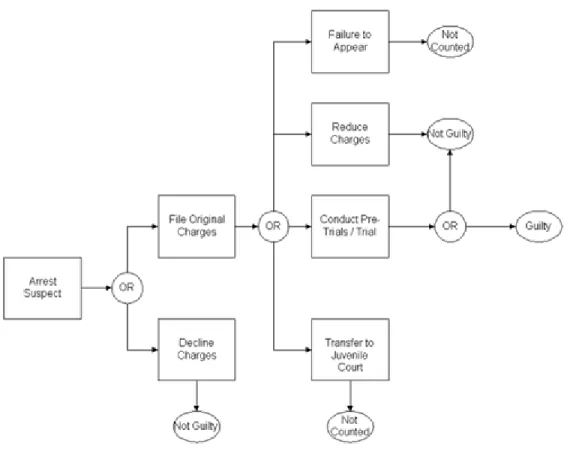
In New Jersey, a DWI offense is not considered a crime, but is labeled a “quasi-crime” by statute and is handled as a traffic matter by the municipal courts. There are 538 municipal courts in the state of New Jersey. A very small percentage (estimated at 1%) of DWI cases are handled in Superior Court and only when another serious crime, some indictable offense, has been committed in conjunction with the DWI offense, which is considered a non-indictable offense. These cases must be sent to the prosecutor’s office and adjudicated in Superior Court. The New Jersey DWI Systems Flowchart (Figure 2-5) appears on page 25.
All law enforcement agencies use UTTs when making a DWI arrest. These traffic citations are all compiled by a statewide Automated Traffic/Complaint System (ATS/ACS). This system has reduced case backlog and reduced time to disposition, which was a major concern before the ATS/ACS was implemented. All municipal courts have access to this system and depend on the system for
administrative and statistical information. Conviction rates are not routinely calculated, but if there were reason to do so, the rate would most likely be calculated using numbers generated from the ATS/ACS. Although a civil matter, DWI offenders can still receive jail time. There are no administrative per se or administrative license removal (ALR) laws in New Jersey. Judicial court proceedings are required to be quick which counters the need for ALR. In fact, it is a goal of the New Jersey Administrative Office of the Courts to have DWI cases adjudicated within 60 days. The DMV is notified only of convictions. It is the practice of the New Jersey Court Municipal Services Division to not factor in those cases where the person has failed to appear in court into the conviction rate equation. Those cases are not considered closed and therefore have not reached any final disposition.
Quoted Conviction Rates
A prosecutor’s office in this county confirmed what we learned from the New Jersey Municipal Court Services Division that DWI conviction rates are not calculated locally in Monmouth County on a regular basis. If a need should arise to perform that calculation, the appropriate state agencies would be notified to provide either a rate, or the numbers necessary to allow a calculation to be performed.
It is the practice of the New Jersey Court Municipal Services Division to not factor in those cases where the person has failed to appear in court into the conviction rate equation. Those cases are not considered closed and therefore have not reached any final disposition. However, the agency states if asked how they would calculate a conviction rate, they would first determine the total number of cases that were disposed (guilty, not guilty, dismissed) and then divide that number into the total number of guilty judgments.
Calculated Conviction Rates
We received statewide data for New Jersey for the year 1995 in the form of 31,636 DWI adjudication records from the State of New Jersey Municipal Court Services. There were 2,930 records for
Monmouth County. Each record represents a DWI charge for which there was a finding. Possible findings and their percentages for Monmouth County were:
1. Guilty 63.0% 2. Not Guilty 25.1% 3. Dismissed 10.4% 4. Merged 1.5%
The designation “merged” is given to charges stemming from incidents with multiple charges. These charges were merged with some other charge. Failure to appear was accounted for in the database only if the defendant eventually did appear. Records for defendants who had not appeared when the database was queried would not have been included in the output.
NEW JERSEY - OCEAN COUNTY
Description
Ocean County is located on the New Jersey coastline opposite Burlington County which contains Camden. The U.S. Census Bureau reports a population of 489,819 up 1.5% from 1997. Roughly 80% of the population resides in urban areas. Per capita income in the County was listed in 1993 at $22,849.
DWI Enforcement System
New Jersey State Police and various Municipal Police Departments handle most DWI arrests. In New Jersey, the DWI offense is a per se offense at the .10 BAC level. All law enforcement agencies use uniform traffic tickets (UTT) when making a DWI arrest. These traffic citations are all compiled by the statewide Automated Traffic/Complaint System (ATS/ACS). Police dispatchers have access to this system which, in turn, provides officers in the field with valuable information.
Prosecution Patterns and Beliefs
In New Jersey, a DWI offense is not considered a crime, but is labeled a “quasi-crime” by statute and is handled as a traffic matter by the municipal courts. There are 538 municipal courts in the state of New Jersey.
Figure 2-5: NJ Municipal Court DWI Systems Flowchart
A very small percentage (estimated at 1%) of DWI cases are handled in Superior Court. This happens when another serious crime, some indictable offense, has been committed in conjunction with the DWI offense, which is considered a non-indictable offense. These cases must be sent to the prosecutor’s
office and adjudicated in Superior Court. The flowchart in Figure 2-5 depicts the flow of DWI cases in Ocean County.
As previously stated, all law enforcement agencies use UTTs when making a DWI arrest. These traffic citations are all compiled by a statewide system, the ATS/ACS. This system has reduced case backlog and reduced time to disposition, which was a major concern before the ATS/ACS was implemented. All municipal courts have access to this system and depend on the system for administrative and statistical information.
As soon as the complaint summons is issued, an initial arraignment is set for the next available court date, which is typically within just a few days. The purpose of the arraignment is to make certain the accused individual has a copy of the complaint, understands the charges, is advised of the sanctions he or she would face if found guilty of the charges, and to determine if an Attorney’s services are available and/or needed, or if the person wishes to request a public defender. The individual charged of a DWI offense may plead guilty at the initial arraignment. However, most people who enter a guilty plea do not do so at this point in the judicial process. Most guilty pleas are entered after the case is scheduled for trial disposition and after the defense attorneys have received whatever discovery materials they are entitled to (police report, breath test results, investigation reports, etc.). A high percentage of persons who are arrested for DWI do plead guilty based on New Jersey statutes that state a person can be proved guilty under:
• per se which states that if the breath test has resulted in a BAC equal to or higher than .10, then that person legally is under the influence, which is all the State has to prove to convict; or
• the statute dealing with BAC test refusal which states, if the breath test has been refused, there is an automatic license suspension and an inference that the person is guilty due to the refusal; or
• other attendant circumstances that the person was impaired, that the use of alcohol deleteriously affected the person’s ability to operate a motor vehicle.
Although a civil matter, DWI offenders can still receive jail time. The DMV is notified only of convictions. There are no administrative per se or administrative license removal (ALR) laws in New Jersey. Judicial court proceedings are required to be swift which counters the need for ALR. In fact, it is a goal of the New Jersey Administrative Office of the Courts to have DWI cases adjudicated within 60 days. Although this is not always feasible, the Presiding Judges strive to encourage the Municipal Courts and Judges to handle cases within 60 days from date of filing to order of disposition.
Since 1994, when the New Jersey legislature approved funding for the specialized positions, Presiding Judges have provided expertise to Municipal Courts and Municipal Court Judges in administrative and procedural matters. The reasons for nominating Presiding Judges were to reduce case backlog and to expedite the hearing of serious traffic matters such as DWI by having Presiding Judges advise and train other Municipal Court Judges in efficient methods. Presiding Judges are appointed by the Chief Justice of the New Jersey Supreme Court with the advice and consent of the Assignment Judges. Once a Presiding Judge is appointed by the Chief Justice at the request of the Assignment Judge of a certain county, that person remains the Regional Presiding Judge until such time as there is a change in status based on another request made by the Assignment Judge to the Chief Justice. Presiding Judges meet regularly at the State Administrative Office of the Court where occasional supplemental training is provided to help them perform their functions, such as administrative training, backlog reduction, and substantive materials to help Judges better understand processes or trends. Training for Municipal
Prosecutors is provided through the County Prosecutor’s office as designated by the State Attorney General’s Office.
The first time an individual fails to appear (FTA) in court, a failure to appear notice is forwarded to that defendant. If the person does not appear on the return date, after receiving the notice, usually a bench warrant is issued. The Municipal Court Judge has the discretion to issue a bench warrant immediately, even for a missed first appearance, if the Judge believes the magnitude of the charged offense is serious enough, such as drunk driving especially when a serious crash or fatality has occurred.
Quoted Conviction Rates
A Presiding Judge in New Jersey confirmed what we learned from the New Jersey Municipal Court Services Division and from a prosecutor’s office in Monmouth Count and that is, DWI conviction rates are not calculated locally in this county. If a need should arise to perform that calculation, the
appropriate state agencies would be notified to provide either a rate, or the numbers necessary to allow a calculation to be performed. The Presiding Judge reported that the major concern has been with case disposition rates and rates pertaining to length of time to disposition. This information is provided by the ATS which is heavily relied upon to make sure cases are handled expeditiously. By Order of the New Jersey Chief Justice there is a mandate to move cases to disposition in 60 days which, as stated previously, is a goal of the New Jersey Administrative Office of the Courts.
It is the practice of the New Jersey Court Municipal Services Division to not factor in those cases where the person has failed to appear in court into the conviction rate equation. Those cases are not considered closed and therefore have not reached any final disposition. However, the agency states if asked how they would calculate a conviction rate, they would first determine the total number of cases that were disposed (guilty, not guilty, dismissed) and then divide that number into the total number of guilty judgments.
Calculated Conviction Rates
Again, we used data from the State of New Jersey Municipal Court Services for 1995. (See page 24 for discussion). There were 2,351 records for Ocean County. As with Monmouth County, each record represents a DWI charge for which there was a finding. Findings as a percentage of all charges were: 1. Guilty 68.7%
2. Not Guilty 29.1% 3. Dismissed 1.3% 4. Merged 0.9%
From the above, the conviction rate for the court system, RC = 68.7%. Available data did not allow us to
OHIO - CIRCLEVILLE AND PICKAWAY COUNTY
Description
Circleville is located in Pickaway County, Ohio, a rural area which lies directly south of Columbus (Franklin County). According to U.S. Census Bureau data, the population of Pickaway County was 52,500 in 1996 and has been growing steadily (1980 population of 43,700). In 1990, the Census Bureau reported a population of 48,300 with 11,700 residing in urban areas and 36,600 living in rural areas. Per capita income in 1993 for Pickaway County was $15,050. According to our site contacts, Circleville currently has a population of approximately 14,000 and population of the County is approximately 55,000.
Circleville is a town with major industries such as E.I. DuPont, PPG Industries, Thomson Consumer Electronics, and Owens Illinois. Two major thoroughfares, Interstate 71, and U.S. Route 23, bisect the County. Interstate 71 is the major thoroughfare between Cincinnati and Cleveland.
DWI Enforcement System
The Pickaway County Sheriff’s Department has retained computerized arrest records since 1992 which allows them to access predetermined forms from their database program. The Circleville Municipal Court tracks cases which are adjudicated in that court and provided us with data for this project. The Ohio Bureau of Motor Vehicles receives a copy of the original ticket and a copy from the court once disposition is made. Reportedly there is a court statistics reporting plan with a goal of obtaining uniform data from all the courts. But, as pointed out by the Municipal Court judge, courts do not report data in the same way and use of such data would be erroneous.
DWI cases, referred to as OMVIs (operating a motor vehicle under the influence) in Ohio, may be cited under state code or local ordinance and handled in the Municipal Court System, which is a state wide court system. Municipal Courts have jurisdiction by statute, which means the jurisdiction of each court depends on how that court was initiated by the state legislature. This particular Municipal Court covers the entire county. Of the 168 Municipal Courts in Ohio, about 25 of them are countywide.
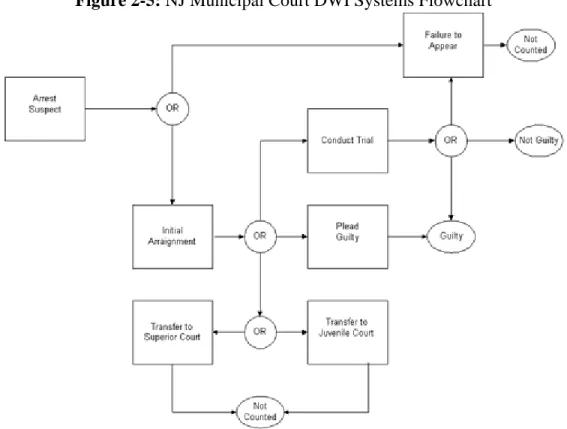
There have not been any major law changes recently relating to OMVI offenses in Ohio. After arrest all people taken into custody appear in Municipal Court initially, and cases are sorted by the seriousness of the offense. Felony cases go to Common Pleas Court through grand jury indictment. The misdemeanor cases, which means all cases which have a potential penalty of less than one year in jail, remain in Municipal Court. (If the defendant is under 18 years of age, the case would be initiated in or transferred to Juvenile Court.)
The next step would be to accept a guilty plea or proceed to trial. Occasionally there are amendments to the charges, which would happen sometime after arrest and, of course, before disposition. Occasionally there are problems with individuals arrested who fail to appear at arraignment or trial. In these cases, warrants are issued for arrest and that information goes into the state’s law-enforcement automated data system. It varies by jurisdiction as to when or if those warrants are served. Certain sheriff departments have active warrants squads designated to make arrests specifically when the warrants are forwarded to their agency for processing. In the departments which do not have specific warrant execution details,
arrest typically does not occur unless there is subsequent contact between a law-enforcement agency and the individual who has absconded.
Prosecution Patterns and Beliefs
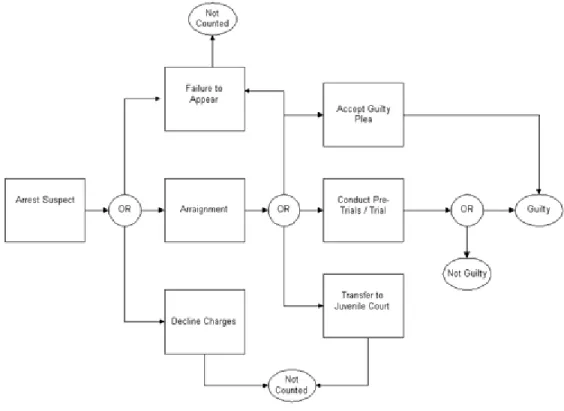
By state statute, from time of arrest through adjudication, unless the defendant waives time, the case is to be tried and disposed of within 90 days. Figure 2-6 depicts the flow and possible outcomes of OMVI cases handled in Municipal Court. Although depicted in the diagram, plea bargaining resulting in charge reduction is not a common practice. The majority of persons arrested on OMVI charges plead guilty. The majority of cases which do proceed to trial are also found guilty. The approach of the Municipal Court in Pickaway County is to try to reduce OMVI recidivism by interposing strategic sentencing plans.
Figure 2-6: Circleville OMVI Systems Flowchart
Quoted Conviction Rates
Circleville Municipal Court. Conviction rates have been described as high in Pickaway County by the Sheriff’s Department, the state’s Governor’s Highway Safety Representative’s (GHSR) office and the Court. The presiding judge is known to be progressive and innovative when sentencing convicted offenders. Our contact at the Sheriff’s Department believes this has contributed to the high conviction rates. He also has said the judge has been very particular about the presentation of OMVI cases which makes it clear what is expected of the officers. There appears to be a good working relationship between the enforcement and adjudication organizations as well as the GHSR and regional NHTSA personnel. Strategic sentencing involves use of an evaluation test, targeted probation goals, intense supervision and polygraph-enforced compliance as well as distinct license plates for DUI offenders. According to our site contact, the number of DUIs and alcohol-related fatalities have been reduced significantly.
An actual OMVI conviction percentage rate is not routinely calculated in Circleville. Per conversations with site contacts, if asked, the computation for the year of concern would most likely be as follows: RC = Number of guilty findings / Number of all findings
Calculated Conviction Rates
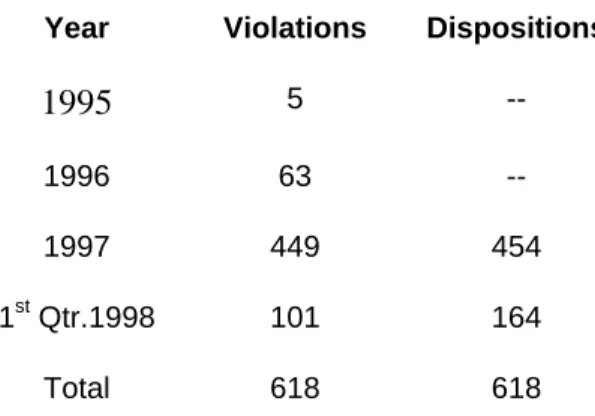
The data we used to calculate conviction rates consist of 618 OMVI adjudication records obtained from the Circleville Municipal Court database. These records comprise OMVI cases disposed of in 1997 and early 1998. The violation dates range from 1995 through early 1998 as follows.
Table 2-5: Circleville/Parking County Project
Year Violations Dispositions
1995 5
--1996 63
--1997 449 454
1st Qtr.1998 101 164
Total 618 618
Note that these records indicate individual charges, and account for more than one charge per incident. The variables include ticket number, driver license number, date of birth, gender, zip code of residence, violation date, charge, DWI test type, DWI test results, plea, charge reduced (Y/N), plea finding and date of disposition. Pleas are coded into three categories: guilty, not guilty and no contest. Some sentencing codes are merged when there is more than one charge and there has been a guilty plea or finding. When individuals fail to appear, those cases are usually coded “F” for bond forfeiture.
In the calculations, we used only those records containing data on the primary DWI offense. Thus, the results pertain to the outcomes of a single alleged DWI incident. The data file described above could only be used to calculate convictions as a percentage of total findings, which turned out to be: RC = 406 / 445 = 0.912 = 91.2%,
where the denominator is the total number of DWI findings in 1997 and the first quarter of 1998, and the numerator is the number either pleading guilty or found guilty at trial during the same period. Only four of the 406 guilty defendants (0.9% of the 445 charged) were found guilty at trial; the remaining 402 plead guilty at some point in the adjudication process.
Those pleading not guilty (24% of those charged) fared much better during adjudication. Their