OECD Economic Surveys
UNITED KINGDOM
FEBRUARY 2015
OVERVIEW
This document and any map included herein are without prejudice to the status of or sovereignty over any territory, to the delimitation of international frontiers and boundaries and to the name of any territory, city or area.
The statistical data for Israel are supplied by and under the responsibility of the relevant Israeli authorities. The use of such data by the OECD is without prejudice to the status of the Golan Heights, East Jerusalem and Israeli settlements in the West Bank under the terms of international law.
Executive summary
● Main findings ● Key recommendations
Main findings
After a period of subdued growth in the aftermath of the global downturn, growth in the United Kingdom has picked up since early 2013 to 2.6% in 2014, the strongest performance among G7 countries that year. Against the background of subdued growth in the euro area, the recovery has benefitted from the cumulative impact of wide-ranging domestic policies. These included highly-accommodative monetary policy and measures to support lending and revive the housing market. For fiscal policy, while there have been some additional consolidation measures, the automatic stabilisers have continued to operate in full. Employment has recovered to its pre-crisis trend and is now at record levels. However, weak labour productivity since 2007 has been holding back real wages and well-being. The sustainability of economic expansion and further progress in living standards rest on boosting productivity growth, which is a key challenge for the coming years.
Securing a balanced recovery through macroeconomic policies.Monetary policy has remained highly expansionary for some time. Inflationary pressures have so far been low owing to ample spare capacity and, more recently, falling commodity prices and a rebound of the exchange rate. Credit constraints have been partly addressed by the Help to Buy and Funding for Lending programmes, which seem to have been effective at reviving lending to households and strengthened housing demand. However, housing supply has not risen to meet demand. In addition, house prices have increased rapidly and may create risks to financial stability in the case of a downward adjustment. The Funding for Lending programme was closed to mortgage lending in late 2013. Conversely, net lending to firms has continued to fall while the large share of loss-making companies could suggest that new loans could have been skewed to inefficient firms to the detriment of young and innovative ones, which could restrain productivity. The budget deficit has been significantly reduced since the peak of 2009, but at a slower pace recently notably as growth has been insufficiently tax-rich. Public debt as a share of GDP is projected to rise further.
Improving the provision of infrastructure.The quality of perceived infrastructure is close to the OECD average, leaving scope to improve productivity and the well-being of citizens. Historic underspending in infrastructure is being tackled by the authorities within tight budget constraints, but greater private infrastructure spending is still needed. Difficulties in attracting private investors can be partly attributed to insufficient long-term infrastructure planning and long decision-making processes that generate investment uncertainties, which the National Infrastructure Plan is starting to address. Although the regulatory framework is robust, the use of some infrastructure is sub-optimal owing to congestion and insufficient incentives for private operating companies. The financing framework for private infrastructure investment is also facing market failures, such as fragmented institutional investors. However, the authorities have been making progress in encouraging green infrastructure investment.
Ensuring sustainable bank lending.The UK banking sector was deeply affected by the crisis and important regulatory reforms have been implemented to address financial stability risks. Given short-term risks emerging in the housing market, regulatory authorities have taken significant precautionary measures to sustain underwriting standards and prevent significant increases in the number of highly indebted households. The Bank of England has also requested from the government additional powers to cap loan-to-value and debt-to-income ratios. Banks remain very large, however, and if they are not well capitalised they could pose a risk to the economy. In addition, banks have been cutting back net lending, making it more difficult for small and medium-sized enterprises to get financing. Part of this financing has been replaced by alternative credit providers, which are creating new regulatory challenges. To support sustainable bank lending, the authorities have taken steps to boost competition in the credit market.
Key recommendations
Securing a balanced recovery through macroeconomic policies
● As underlying inflationary pressures emerge, gradually start increasing the policy rate and, thereafter, begin reducing the size of the Bank of England’s balance sheet.
● Continue to pursue the medium-term fiscal consolidation path while letting automatic stabilisers operate, and ensure consolidation efforts are fair.
● Seek further efficiency gains in health and education, and broaden the tax base, such as equalising income taxes and social security contributions between the self-employed and employees.
Improving the provision of infrastructure
● Continue to build on the progress made with the National Infrastructure Plan to further enhance long-term infrastructure strategy and planning.
● Develop further the use of public-private partnerships (PPP) and public guarantees for privately financed infrastructure projects, recording the associated assets and liabilities in the government fiscal accounts. Enhance the provision to investors and the public of comparable data about public guarantees and the financial and operational performance of PPP projects.
● Improve the use of roads by introducing user-paid tolls, and of railways by ensuring the arms-length responsibility for awarding rail franchises.
● Strengthen the Green Investment Bank and other targeted financial aids to further support the implementation of not yet commercially viable low-carbon technologies that have the prospect of becoming so in the foreseeable future.
● Evaluate the interaction between the Electricity Market Reform and existing policies to promote renewable energies.
Ensuring sustainable bank lending
● Consider higher leverage ratios for global systemic banks to complement risk-weighted capital ratios.
● Encourage the development of new credit providers and gradually extend regulatory instruments beyond the banking sector.
● Continue to uphold underwriting standards in mortgage lending. Further relax regulatory constraints to boost housing supply, in particular by thoroughly reviewing the boundaries of protected areas of the Green Belt.
● Collect and share credit information on businesses through credit reference agencies or directly through the regulator.
Assessment and recommendations
● Making the recovery sustainable ● Normalising macroeconomic policies ● Rekindling productivity growth
Making the recovery sustainable
Key challenges to unleash productivity
Following a deep recession and a subdued recovery, economic growth in the United Kingdom (UK) has bounced back strongly since 2013. Real gross domestic product (GDP) is back above the pre-crisis peak and growth has been broadening (Figure 1). Macroeconomic policies have played a key role. Monetary policy has been very accommodative, measures have been put in place to support the recovery in the housing market, and fiscal policy has contributed to some pick-up in growth. Structural reforms have strengthened work incentives and supported a business-friendly environment, thus sustaining one of the most flexible economies in the OECD.
Well-being outcomes remain robust, although income and financial wealth, as well as education and skills, are somewhat weaker than the G7 average (Figure 2, Panel A). Income inequality is high (Figure 2, Panel B). However, relative income poverty is comparatively low and has been falling (Figure 2, Panel C). The average income of the richest 10% of the population is nearly ten times that of the poorest, but the gap shrunk between 2009 and 2011 to slightly below the OECD average. Moreover, the share of wealth held by the top 10% is among the lowest in the G7 (IMF, 2013; Davies et al., 2012).
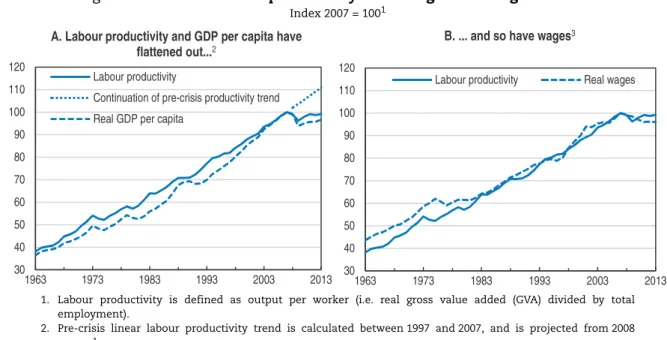
However, labour productivity has been exceptionally weak since the onset of the crisis, and as a result real wages and GDP per capita have been flat (Figure 3). Investment has rebounded and has recovered close to the pre-crisis peak. Exports have been subdued
Figure 1. Growth is strong
1. The figures in parentheses show 2010 weights in GDP.
Source:OECD (2015),OECD Economic Outlook: Statistics and Projections(database), February and ONS (2014), “Quarterly National Accounts, Q3 2014”, Office for National Statistics, December.
1 2 http://dx.doi.org/10.1787/888933188951 92 94 96 98 100 102 104 106 108 110 112 2008 2009 2010 2011 2012 2013 2014 A. GDP is catching up Real GDP, index Q1 2008 = 100
United Kingdom Canada
France Germany United States 75 80 85 90 95 100 105 110 115 2008 2009 2010 2011 2012 2013 2014 B. Growth is broadening
Real GDP and its demand components, index Q1 2008 = 1001
GDP
Consumption (83%) Investment (16%) Export (30%)
despite exchange rate depreciation of about 20% in real effective terms between 2007 and 2008, notably because of sluggish demand in the euro area. Weak export performance and productivity could be driven by infrastructure weaknesses and difficult access to bank finance, especially for small and medium-sized enterprises (SMEs), holding back the emergence of new firms and high-skilled jobs.
Figure 2. Social indicators are good overall
1. Each well-being dimension is measured by one to four indicators from the OECD Better Life Index set. Normalised indicators are averaged with equal weights. Indicators are normalised to range between 10 (best) and 0 (worst) according to the following formula: (indicator value – minimum value)/(maximum value – minimum value)x10. The aggregate for G7 countries (excluding the United Kingdom) (i.e. Canada, France, Germany, Italy, Japan and United States) is calculated as an unweighted average.
2. The Gini coefficient is calculated for household disposable income after taxes and transfers, adjusted for differences in household size and it has a range from zero (when everybody has identical incomes) to one (when all income goes to only one person). Increasing values of the Gini coefficient thus indicate higher inequality in the distribution of income. The relative poverty rate is based on 50% of the median disposable income (adjusted for family size and after taxes and transfers) of the entire population. 2009 and average of 2006-09 for Japan. 2010 and average of 2006-10 for Belgium. 2012 and average of 2006-12 for Australia and Netherlands. The OECD aggregate is calculated as an unweighted average. The aggregate for G7 countries (excluding the United Kingdom) (i.e. Canada, France, Germany, Italy, Japan and United States) is calculated as an unweighted average.
Source:OECD (2014),OECD Better Life Indexand OECD (2014), “Income Distribution Database”,OECD Social and Welfare Statistics, December. 1 2 http://dx.doi.org/10.1787/888933188968 0 1 2 3 4 5 6 7 8 9 10
Income and wealth
Jobs and earnings
Housing
Work and life balance
Health status Education and skills Social connections
Civic engagement and governance Environmental quality Personal security Subjective well-being United Kingdom G7 (excluding UK) 0.00 0.05 0.10 0.15 0.20 0.25 0.30 0.35 0.40 NO R DN K BE L FI N SW E NL D AU T CH E DE U IR L FR A KO R OE C D CA N IT A NZ L AU S G7 GR C JP N PR T ES P GB R US A
B. Income inequality is relatively high
Gini coefficient2
2011
Average of 2006-2011
A. Average well-being outcomes are strong
Better Life Index, 20141
0 2 4 6 8 10 12 14 16 18 DN K FI N NO R NL D FR A DE U AU T GB R BE L SW E IR L NZ L CH E OE C D CA N PR T G7 ITA AUS ESP KOR GR C JP N US A
C. Relative poverty is low
Per cent2
2011
ThisSurveyanalyses ways to address these challenges and finds that:
● Improving productivity requires further structural reforms and is key to higher sustainable GDP and wage growth.
● Accelerated decision-making and activation of new financing channels would raise infrastructure investment needed to support productivity and living standards.
● Significant progress has been achieved to make the banking sector more resilient and further reforms should strengthen financial stability and ensure sustainable lending to support capital stock accumulation.
A strong recovery
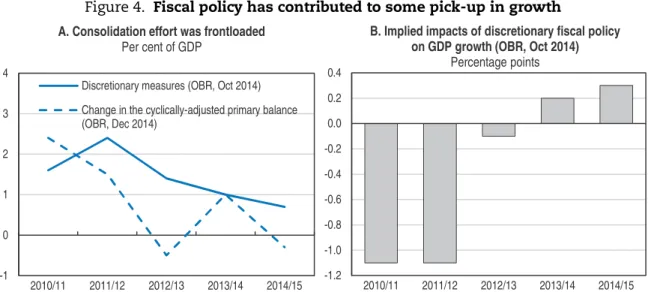
Growth in the UK has picked up since the first quarter of 2013 to 2.6% in 2014, the strongest performance among G7 countries that year. Quantitative easing and measures to improve credit availability have magnified the transmission of the policy rate that was cut to 0.5% in March 2009. In parallel, automatic fiscal stabilisers have continued to operate and fiscal tightening has been less of a headwind since 2012, which is estimated to have supported growth since 2013 (Figure 4).
Private consumption growth has been supported by a remarkable pace of job creation, low borrowing costs and stronger confidence. The latter has played an instrumental role in reducing household saving ratio (Figure 5, Panel A). Since late 2013, growth momentum has been strengthened by a pick-up in gross fixed investment growth, driven by firming demand, a low cost of capital and a turnaround in business confidence, which has encouraged firms to run down their financial surplus (Figure 5, Panel B; Lewis et al., 2014). Exports have contributed little to the recovery. The UK has been continuously losing market share, broadly in line with the G7, since late 1990s (Figure 6, Panel A). However,
Figure 3. Subdued labour productivity is holding back living standards
Index 2007 = 1001
1. Labour productivity is defined as output per worker (i.e. real gross value added (GVA) divided by total employment).
2. Pre-crisis linear labour productivity trend is calculated between 1997 and 2007, and is projected from 2008 onwards.
3. Real wages refer to nominal wages divided by dependent employment and deflated by GDP deflator.
Source:OECD (2015),OECD Economic Outlook: Statistics and Projections(database), January and ONS (2014), “Labour Productivity, Q3 2014”, Office for National Statistics, December.
1 2 http://dx.doi.org/10.1787/888933188973 30 40 50 60 70 80 90 100 110 120 1963 1973 1983 1993 2003 2013 A. Labour productivity and GDP per capita have
flattened out...2
Labour productivity
Continuation of pre-crisis productivity trend Real GDP per capita
30 40 50 60 70 80 90 100 110 120 1963 1973 1983 1993 2003 2013 B. ... and so have wages3
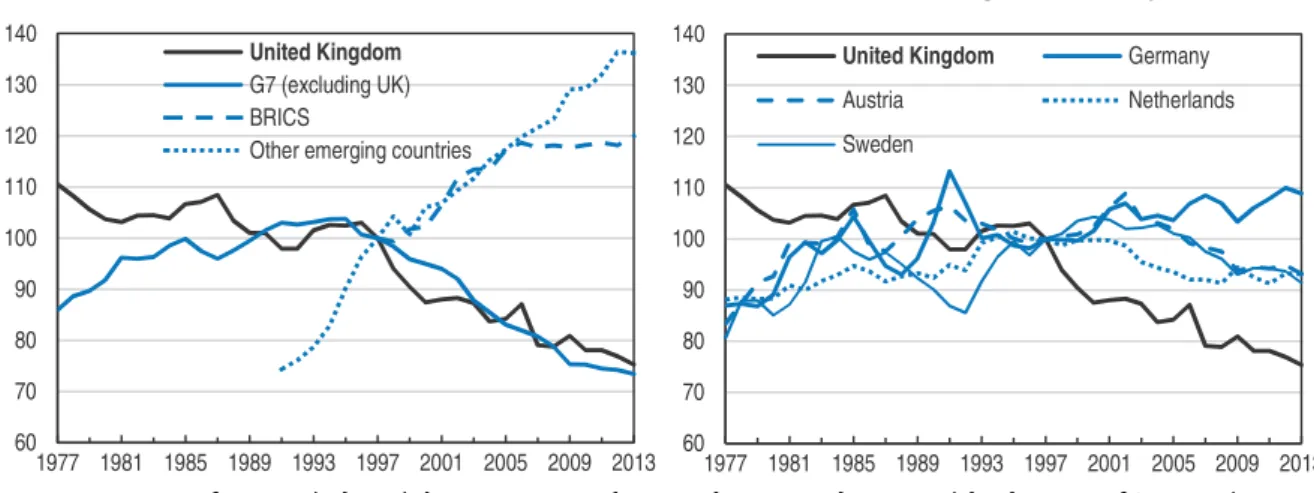
export performance of some affluent OECD countries has proved more resilient (Figure 6, Panel B). Declining market share could in part reflect the rise of China and other emerging market economies, but could also be driven by domestic supply factors as the share of tradable sectors in total gross value added has been falling (Figure 7, Panel A). This could help to explain why currency depreciation has not revived net exports from the manufacturing, oil and gas sectors (Figure 7, Panel B).
Figure 4. Fiscal policy has contributed to some pick-up in growth
Source:OBR (2014), “Forecast Evaluation Report – October 2014”, Office for Budget Responsibility and OBR (2014), “Economic and Fiscal Outlook – December 2014”, Office for Budget Responsibility.
1 2 http://dx.doi.org/10.1787/888933188984 Figure 5. Growth is driven by domestic demand
1. Three quarter moving average applied to household saving ratio. Household saving ratio is expressed as a percentage of total available households' resources. Quarterly data for consumer confidence are calculated as unweighted average of monthly figures.
2. Three month moving average applied to business confidence. Confidence indicator is calculated as the arithmetic average of the balances (in percentage points) of the answers to the questions on: production – future tendency; finished goods stocks-level; and order books-level. Net balance is used to summarise answers to multiple-choice questions related to business tendency surveys and it takes value between -100% (unfavourable) and +100% (favourable) with a midpoint of 0. Quarterly data for business confidence are calculated as unweighted average of monthly figures of confidence indicators in manufacturing, construction, retail trade and services (excluding retail trade). NFCs: non-financial corporations.
Source: OECD (2015),Main Economic Indicators(database), January and ONS (2014), “Quarterly National Accounts, Q3 2014”, Office for National Statistics, December.
1 2 http://dx.doi.org/10.1787/888933188992 -1.2 -1.0 -0.8 -0.6 -0.4 -0.2 0.0 0.2 0.4 2010/11 2011/12 2012/13 2013/14 2014/15 B. Implied impacts of discretionary fiscal policy
on GDP growth (OBR, Oct 2014)
Percentage points -1 0 1 2 3 4 2010/11 2011/12 2012/13 2013/14 2014/15 A. Consolidation effort was frontloaded
Per cent of GDP
Discretionary measures (OBR, Oct 2014) Change in the cyclically-adjusted primary balance (OBR, Dec 2014) 0 2 4 6 8 10 12 -40 -30 -20 -10 0 10 20 2008 2009 2010 2011 2012 2013 2014 A. Household saving ratio has fallen as
confidence improved...1
Consumer confidence (left scale) Household saving ratio (right scale) Net balance, per cent Per cent
-8 -6 -4 -2 0 2 4 6 -80 -60 -40 -20 0 20 40 60 2008 2009 2010 2011 2012 2013 2014 B. ... and similarly for businesses2
Business confidence (left scale) Financial balance of NFCs (right scale) Net balance, per cent Per cent of GDP
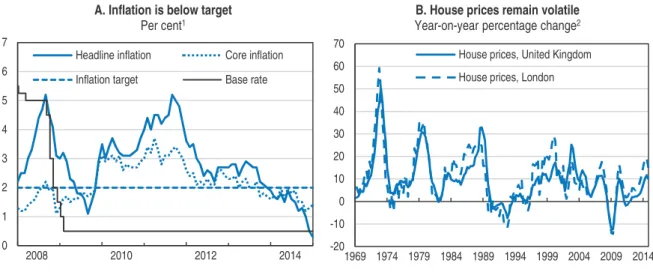
After four years of overshooting, consumer price inflation has fallen significantly below the Bank of England’s (BoE) target of 2% to 0.3% in the year to January 2015, the lowest since the consumer price index series began (Figure 8, Panel A). The main driver of this sharp fall has been the reduction in energy prices reflecting plummeting global oil prices, and falling food prices and the appreciation of the exchange rate have also contributed. Low inflation has supported real incomes and provided additional boost to consumption. The recovery in
Figure 6. Export performance has been deteriorating
Index 1997 = 1001
1. Export performance is the ratio between export volumes and export markets. Unweighted average of G7 countries (excluding the United Kingdom) (i.e. Canada, France, Germany, Italy, Japan and United States), BRICS countries (i.e. Brazil, Russian Federation, India, China, South Africa) and Other emerging countries (i.e. Czech Republic, Hungary, Korea, Mexico, Poland and Turkey).
Source:OECD (2015),OECD Economic Outlook: Statistics and Projections(database), January.
1 2 http://dx.doi.org/10.1787/888933189007 Figure 7. Declining relative size of export sectors is contributing
to weak net exports
1. Manufactured goods refer to both semi and finished manufactured goods (i.e. Standard International Trade Classification (SITC), Rev. 3: 5-8). Oil and gas refer to SITC, Rev. 3: 32-35 and also include net exports of coal and electricity that are negligible. Competitiveness-weighted real effective exchange rate.
Source:ONS (2014), “Quarterly National Accounts, Q3 2014”, Office for National Statistics, December, ONS (2014), “The Pink Book 2014”, Office for National Statistics, October and OECD (2015),OECD Economic Outlook: Statistics and Projections(database), January.
1 2 http://dx.doi.org/10.1787/888933189011 60 70 80 90 100 110 120 130 140 1977 1981 1985 1989 1993 1997 2001 2005 2009 2013 A. Competition of emerging countries is rising...
United Kingdom
G7 (excluding UK) BRICS
Other emerging countries
60 70 80 90 100 110 120 130 140 1977 1981 1985 1989 1993 1997 2001 2005 2009 2013 B. ... but some leading economies cope better
United Kingdom Germany
Austria Netherlands Sweden 0 2 4 6 8 10 12 14 16 1992 1995 1998 2001 2004 2007 2010 2013 A. Tradable sectors are falling...
Per cent of total gross value added (GVA) Manufacturing Oil and gas Financial services 60 70 80 90 100 110 120 -80 -60 -40 -20 0 20 40 1992 1995 1998 2001 2004 2007 2010 2013 B. ... and so are their net exports1
Manufactured goods (left scale) Oil and gas (left scale) Financial services (left scale)
Real effective exchange rate (right scale)
the housing market has been marked by large house price increases, particularly in London (Figure 8, Panel B), raising homeowners’ wealth, but also reducing affordability for first-time buyers and contributing to higher household indebtedness. However, there was some moderation in annual house price growth in late 2014.
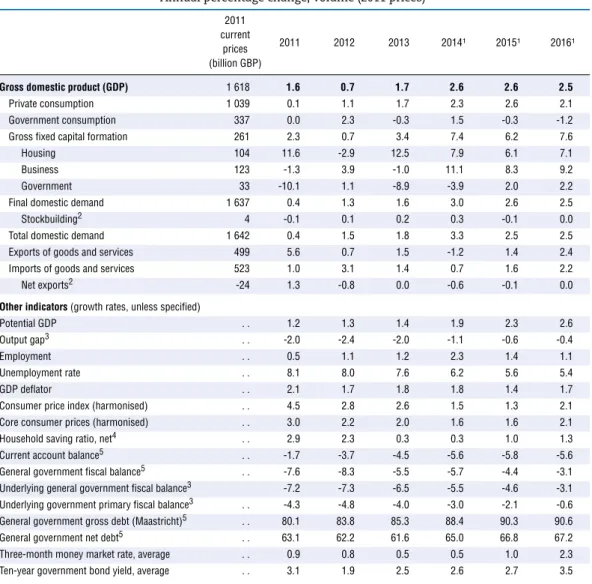
GDP growth is projected to continue to be driven by private consumption and private investment (Table 1). Capital accumulation should begin to push up labour productivity and real wages. The unemployment rate is projected to continue to fall. Exports will strengthen somewhat, but not enough for market share to rise. Interest rate increases should start as underlying inflation pressures emerge. The pace of interest rate increases will, however, depend on economic developments. Higher interest rates should encourage the selection of more profitable projects and the restructuring of loss-making companies, raising productivity.
Risks are broadly balanced. Regarding domestic risks, uncertainty about the recovery of productivity growth is a major, but to some extent symmetric, risk to the projection. On the downside, labour market pressures could result in real wages rising faster than productivity and lead to cost-push inflation. On the positive side, productivity growth could turn out to be stronger, especially if it is supported by stronger investment, making wage increases sustainable. Planned cumulative fiscal consolidation of almost 2.5% of GDP in 2015 and 2016 could reduce growth by more or by less than projected. House prices could fall, which may create risks for financial stability. The key external risk is the growth of the euro-area economy, which has faltered, but could also bounce more strongly than expected. On the upside, assuming it is sustained, the fall in oil price should boost activity. The UK current account deficit has widened to about 6% of GDP, notably as investment income has disappointed, which could make the economy more sensitive to shift in investor sentiment. Conversely, exports may pick up faster than projected if higher investment and productivity gains allow better export performance.
Figure 8. Monetary conditions are supportive, but house prices have increased significantly
1. Headline inflation refers to harmonised consumer prices index. Core inflation excludes energy, food, alcohol and tobacco.
2. Nominal house prices.
Source:Bank of England, ONS (2015), “Consumer Price Inflation, January 2015”, Office for National Statistics, February and ONS (2015), “House Price Index, December 2014”, Office for National Statistics, February.
1 2 http://dx.doi.org/10.1787/888933189027 0 1 2 3 4 5 6 7 2008 2010 2012 2014 A. Inflation is below target
Per cent1
Headline inflation Core inflation Inflation target Base rate
-20 -10 0 10 20 30 40 50 60 70 1969 1974 1979 1984 1989 1994 1999 2004 2009 2014 B. House prices remain volatile
Year-on-year percentage change2
House prices, United Kingdom House prices, London
Employment has been strong, but productivity and real wages have been flat
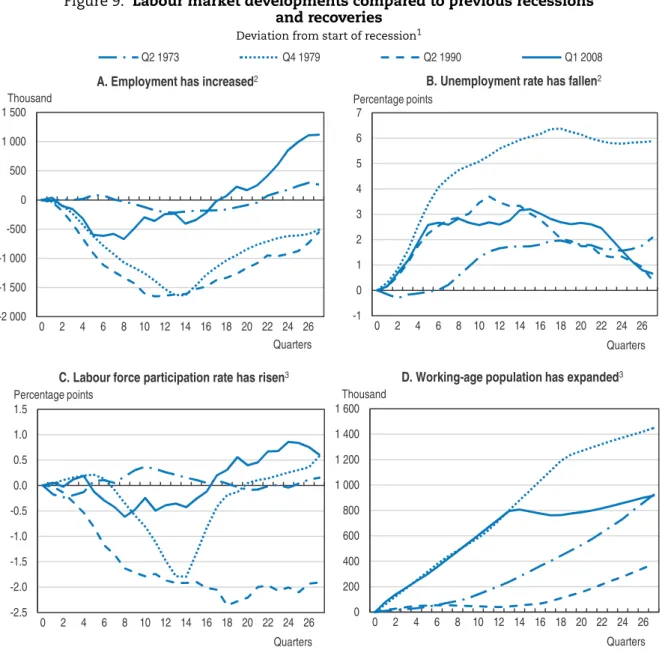
The labour market has been resilient, with employment rising significantly compared to past recessions (Figure 9, Panel A). Rises in the unemployment rate were contained, compared to output losses, early in the crisis and, more recently, the unemployment rate has declined rapidly (Figure 9, Panel B). However, youth (15-24) unemployment rate remains elevated as it was at nearly 16.5% in the third quarter of 2014 but it fell by about 4.5 percentage points over the year. Activation policies have helped to limit the increase in unemployment (OECD, 2014a). Equally importantly, the labour market has absorbed unusual increases in labour supply (Figure 9, Panels C and D). The participation rate of older workers has risen following pension reforms (Figure 10, Panel A; BoE, 2014a). Welfare
Table 1. Macroeconomic indicators and projections
Annual percentage change, volume (2011 prices)
2011 current
prices (billion GBP)
2011 2012 2013 2014¹ 2015¹ 2016¹
Gross domestic product (GDP) 1 618 1.6 0.7 1.7 2.6 2.6 2.5
Private consumption 1 039 0.1 1.1 1.7 2.3 2.6 2.1 Government consumption 337 0.0 2.3 -0.3 1.5 -0.3 -1.2 Gross fixed capital formation 261 2.3 0.7 3.4 7.4 6.2 7.6 Housing 104 11.6 -2.9 12.5 7.9 6.1 7.1 Business 123 -1.3 3.9 -1.0 11.1 8.3 9.2 Government 33 -10.1 1.1 -8.9 -3.9 2.0 2.2 Final domestic demand 1 637 0.4 1.3 1.6 3.0 2.6 2.5 Stockbuilding2 4 -0.1 0.1 0.2 0.3 -0.1 0.0 Total domestic demand 1 642 0.4 1.5 1.8 3.3 2.5 2.5 Exports of goods and services 499 5.6 0.7 1.5 -1.2 1.4 2.4 Imports of goods and services 523 1.0 3.1 1.4 0.7 1.6 2.2 Net exports2 -24 1.3 -0.8 0.0 -0.6 -0.1 0.0
Other indicators(growth rates, unless specified)
Potential GDP . . 1.2 1.3 1.4 1.9 2.3 2.6 Output gap3 . . -2.0 -2.4 -2.0 -1.1 -0.6 -0.4 Employment . . 0.5 1.1 1.2 2.3 1.4 1.1 Unemployment rate . . 8.1 8.0 7.6 6.2 5.6 5.4 GDP deflator . . 2.1 1.7 1.8 1.8 1.4 1.7 Consumer price index (harmonised) . . 4.5 2.8 2.6 1.5 1.3 2.1 Core consumer prices (harmonised) . . 3.0 2.2 2.0 1.6 1.6 2.1 Household saving ratio, net4 . . 2.9 2.3 0.3 0.3 1.0 1.3 Current account balance5 . . -1.7 -3.7 -4.5 -5.6 -5.8 -5.6 General government fiscal balance5 . . -7.6 -8.3 -5.5 -5.7 -4.4 -3.1 Underlying general government fiscal balance3 -7.2 -7.3 -6.5 -5.5 -4.6 -3.1 Underlying government primary fiscal balance3 . . -4.3 -4.8 -4.0 -3.0 -2.1 -0.6 General government gross debt (Maastricht)5 . . 80.1 83.8 85.3 88.4 90.3 90.6 General government net debt5 . . 63.1 62.2 61.6 65.0 66.8 67.2 Three-month money market rate, average . . 0.9 0.8 0.5 0.5 1.0 2.3 Ten-year government bond yield, average . . 3.1 1.9 2.5 2.6 2.7 3.5
1. Projections based on OECD (2014), “OECD Economic Outlook No. 96”, OECD Economic Outlook: Statistics and Projections(database), from November 2014, updated with the latest data available.
2. Contribution to changes in real GDP. 3. As a percentage of potential GDP.
4. As a percentage of household disposable income. 5. As a percentage of GDP.
reforms have also lifted the overall participation rate (Figure 10, Panel A) as they sharpened work incentives (Blundell et al., 2014). Sustained inflows of well-educated immigrants have boosted the working-age population (Wadsworth and Vaitilingam, 2014).
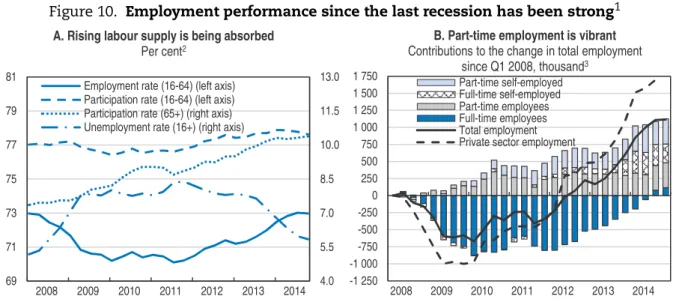
Against the background of strong increases in the labour force, private-sector employment has risen by almost three million people since 2010 (Figure 10, Panel B). Employment gains since early 2008 have mainly resulted from part-time workers, many of them self-employed, but more recent increases have been in full-time employment, the number of which slightly exceeds the pre-crisis level. The system of tax credits may have
Figure 9. Labour market developments compared to previous recessions
and recoveries
Deviation from start of recession1
1. Change in level for employment and working age population. Change in percentage points for unemployment rate and labour force participation rate. Data for Q4 2014 refer to the period between September and November 2014.
2. Refers to population aged 16 and over. 3. Refers to population aged between 16 and 64.
Source:ONS (2015), “Labour Market Statistics, January 2015”, Office for National Statistics.
1 2 http://dx.doi.org/10.1787/888933189033 -2 000 -1 500 -1 000 -500 0 500 1 000 1 500 0 2 4 6 8 10 12 14 16 18 20 22 24 26 Quarters A. Employment has increased2
Q2 1973 Q4 1979 Q2 1990 Q1 2008 Thousand -1 0 1 2 3 4 5 6 7 0 2 4 6 8 10 12 14 16 18 20 22 24 26 Quarters B. Unemployment rate has fallen2
Percentage points -2.5 -2.0 -1.5 -1.0 -0.5 0.0 0.5 1.0 1.5 0 2 4 6 8 10 12 14 16 18 20 22 24 26 Quarters C. Labour force participation rate has risen3
Percentage points 0 200 400 600 800 1 000 1 200 1 400 1 600 0 2 4 6 8 10 12 14 16 18 20 22 24 26 Quarters D. Working-age population has expanded3
encouraged stronger prevalence of part-time work and self-employment (OECD, 2014a). The rise in self-employment could also be traced to structural determinants linked to population ageing and more self-employment among older people (BoE, 2014b). Other important drivers include government programmes and tax incentives, and possibly a higher potential for tax evasion (Ashworth et al., 2014; Goodhart and Ashworth, 2014).
Figure 10. Employment performance since the last recession has been strong1
1. Data for Q4 2014 refer to the period between September and November 2014.
2. Employment (16-64) and participation (16-64) rates refer to population aged between 16 and 64. Participation rate (65+) refers to population aged 65 and over. Unemployment rate (16+) refers to population aged 16 and over. 3. Total employment also comprises unpaid family workers and those on government-supported training and
employment programmes.
Source:ONS (2015), “Labour Market Statistics, January 2015”, Office for National Statistics.
1 2 http://dx.doi.org/10.1787/888933189049 Figure 11. Productivity and wages have not recovered compared to previous
recessions and recoveries
Deviation from start of recession, percentage points
1. Labour productivity is defined as output per worker (i.e. real gross value added (GVA) divided by total employment).
2. Real wages refer to nominal wages divided by dependent employment and deflated by GDP deflator. Three quarter moving average applied.
Source:ONS (2014), “Labour Productivity, Q3 2014”, Office for National Statistics, December and OECD (2015),OECD Economic Outlook: Statistics and Projections(database), January.
1 2 http://dx.doi.org/10.1787/888933189057 -1 250 -1 000 -750 -500 -250 0 250 500 750 1 000 1 250 1 500 1 750 2008 2009 2010 2011 2012 2013 2014 B. Part-time employment is vibrant
Contributions to the change in total employment since Q1 2008, thousand3 Part-time self-employed Full-time self-employed Part-time employees Full-time employees Total employment Private sector employment
4.0 5.5 7.0 8.5 10.0 11.5 13.0 69 71 73 75 77 79 81 2008 2009 2010 2011 2012 2013 2014 A. Rising labour supply is being absorbed
Per cent2
Employment rate (16-64) (left axis) Participation rate (16-64) (left axis) Participation rate (65+) (right axis) Unemployment rate (16+) (right axis)
-10 -5 0 5 10 15 20 0 2 4 6 8 10 12 14 16 18 20 22 24 26 Quarters A. Productivity has been flat1
Q2 1973 Q4 1979 Q2 1990 Q1 2008 -6 -4 -2 0 2 4 6 8 10 0 2 4 6 8 10 12 14 16 18 20 22 24 26 Quarters B. Real wages have been weak2
However, labour productivity per employee (and labour productivity per hour) has failed to rise since the global downturn, in contrast to previous recessions and recoveries (Figure 11, Panel A). Income and wealth are below the G7 average (Figure 2, Panel A) and real earnings have been exceptionally weak as they have continued to reflect poor productivity (Figure 11, Panel B). In 2013, real GDP per capita was slightly more than 10% lower than in the upper half of OECD countries, with the gap being essentially explained by lower labour productivity (OECD, 2015). Developing a knowledge-based economy, strengthening infrastructure investment and improving the financing of the economy are all critical in this regard (see below).
Normalising macroeconomic policies
Gradually reducing the size of monetary stimulus
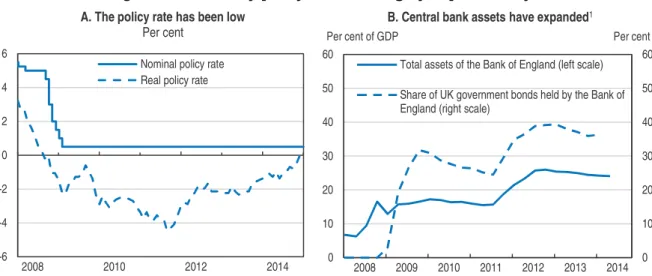
In response to the global crisis, the policy rate was cut to 0.5% in March 2009, and has been negative in real terms until recently (Figure 12, Panel A). Between March 2009 and October 2012, the BoE implemented quantitative easing (QE) by purchasing GBP 375 billion (nearly 25% of GDP) of long-term securities, essentially government bonds (Figure 12, Panel B). Empirical studies suggest that the QE programme may have lowered 10-year gilt yields by 90 basis points, corresponding to a cut in the policy rate by around 350 basis points, and providing temporary boost to real GDP estimated at about 2% (Rawdanowicz et al., 2014). The overall short-term stimulus of QE on GDP is likely to have been higher, as the programme also weakened the exchange rate and improved household financial wealth.
In July 2012, the Treasury and the BoE launched the Funding for Lending Scheme (FLS) to provide funding to banks and building societies on attractive conditions linked to their lending performance. Since then, the programme was modified by further increasing incentives to lend to SMEs in April 2013, but was terminated for mortgages in November 2013. The FLS has contributed to a reduction in bank funding costs, helping to unblock access to bank lending. Survey evidence suggests that broader credit conditions
Figure 12. Monetary policy has been highly expansionary
1. Government bonds refer to conventional gilts.
Source:Bank of England, ONS (2015), “Consumer Price Inflation, January 2015”, Office for National Statistics, February and UK Debt Management Office.
1 2 http://dx.doi.org/10.1787/888933189061 0 10 20 30 40 50 60 0 10 20 30 40 50 60 2008 2009 2010 2011 2012 2013 2014 B. Central bank assets have expanded1
Total assets of the Bank of England (left scale) Share of UK government bonds held by the Bank of England (right scale)
Per cent of GDP Per cent
-6 -4 -2 0 2 4 6 2008 2010 2012 2014 A. The policy rate has been low
Per cent Nominal policy rate Real policy rate
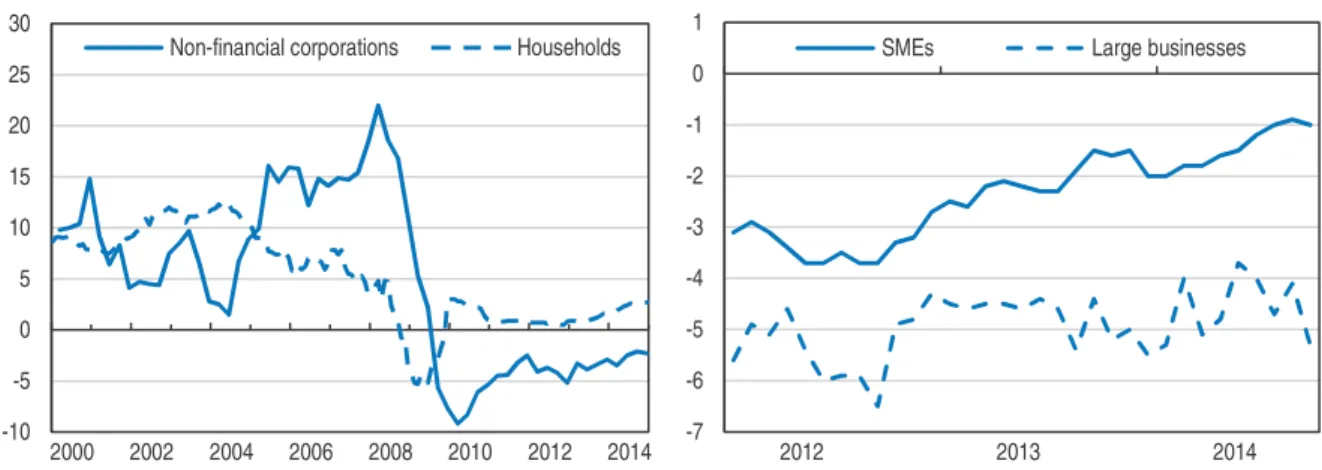
have improved for businesses of all size, including SMEs. Although bank lending to businesses has continued to fall (Figure 13), the programme may have prevented steeper declines (BoE, 2014b). Yet, empirical evidence has not found an impact on the loan supply to SMEs from the expansion of the scheme between April and December 2013, at the time declining market funding costs were reducing banks’ incentives to use the programme (Havrylchyk, 2015). To insure against an increase in banks’ funding costs, in December 2014 the Treasury and the BoE extended the scheme to January 2016. The UK government has also established the British Business Bank to unlock lending to smaller businesses, bringing together existing and new support programmes.
In March 2013, the government announced the Help to Buy programme to stimulate loan demand for high loan-to-value mortgages (a deposit of only 5% is required) and to encourage housing supply. Help to Buy has so far supported a total of close to 70 000 transactions, broadly in line the authorities’ expectations, compared to transactions of about 100 000 per month that were executed in 2014. The programme has been used predominantly by first-time buyers outside London, with average transaction prices being significantly below the national average.
In August 2013, the BoE adopted forward guidance, emphasising the importance of communicating the factors that would frame the monetary policy stance, in particular the unemployment rate. Survey evidence suggests that greater certainty about interest rates may have supported confidence, particularly of businesses, contributing to higher investment and hiring decisions of some firms (BoE, 2014c). As the unemployment rate rapidly plunged toward the threshold of 7%, forward guidance was refined in February 2014 with the BoE starting the publication of a wide range of variables since then. Moreover, the
Figure 13. Net loan growth of monetary financial institutions has been weak
Per cent1
1. 12-month growth rates. Data are not seasonally adjusted.
2. Lending to non-financial corporations (NFCs) refers to UK resident monetary financial institutions’ sterling and all foreign currency net lending to NFCs. Lending to households refers to monetary financial institutions’ sterling net lending (M4) to the household sector.
3. These data relate to loans and advances in all currencies made by UK monetary financial institutions (MFIs) to non-financial businesses, including to small and medium-sized enterprises (SMEs). SMEs are defined as those with an annual debit account turnover on the main business account of up to GBP 25 million. Those with an annual debit account turnover on the main business account above GBP 25 million are termed “large businesses”. Source:Bank of England (2015), “Monetary and Financial Statistics”,Statistical Interactive Database, January.
1 2 http://dx.doi.org/10.1787/888933189078 -10 -5 0 5 10 15 20 25 30 2000 2002 2004 2006 2008 2010 2012 2014 A. Bank lending has been hit by the crisis2
Non-financial corporations Households
-7 -6 -5 -4 -3 -2 -1 0 1 2012 2013 2014 B. Large and small firms get fewer loans3
Monetary Policy Committee indicated that there remained scope to further absorb spare capacity before lifting the policy rate, and that future interest rate normalisation would be limited and gradual, to a level materially below the pre-crisis average of 5%.
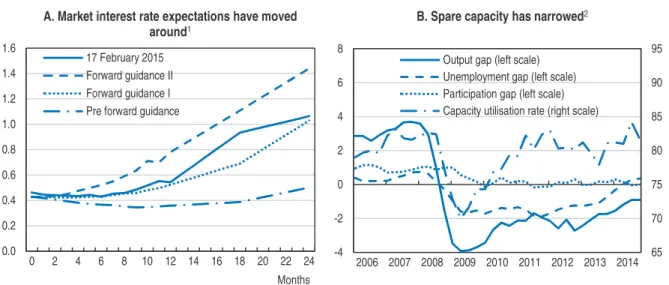
Monetary accommodation has so far proved sustainable in the sense that inflation has fallen below the inflation target of 2% (Figure 8, Panel A) and wage pressures have been non-existent, although real wage growth has become positive more recently. The timing and pace of the withdrawal of monetary support will depend on economic developments, notably, and in accordance with the BoE’s symmetric inflation target to ensure that inflation expectations remain anchored. Market participants’ expectations of interest rate normalisation have moved around (Figure 14, Panel A). Slack has been closing, although such measures are uncertain and there is evidence that some workers would like to work longer hours (Blanchflower and Machin, 2014) (Figure 14, Panel B). The number of vacancies has been rising steeply in the main sectors and the number of unemployed per vacancy has been falling (Figure 15). Policymakers should look through temporary effects on inflation of weaker commodity prices and a stronger exchange rate.
The BoE does not plan to reduce the stock of purchased assets until after the first interest rate hike (BoE, 2014c). This sequencing would give it some room for manœuvre to use the policy rate as an active tool in response to adverse shocks to activity. In any case, transparent communication will be needed during the exit from years of a highly-accommodative policy stance.
Figure 14. Normalisation of policy rates should start soon
Per cent
1. Future interest rates derived from zero yield curves. Horizontal axis refers to the number of months into the future. Pre forward guidance refers to the average of interest expectations for the period between 2 Jan. 2013 and 6 Aug. 2013. Forward guidance I refers to the average of interest expectations for the period between 7 Aug. 2013 and 11 Feb. 2014. Forward guidance II refers to the average of interest expectations for the period between 12 Feb. 2014 and 17 Feb. 2015.
2. Capacity utilisation rate in the manufacturing sector. Output gap is defined as the difference of actual and trend output as a percentage of trend. Unemployment gap is defined as the difference between non-accelerating inflation rate of unemployment (NAIRU) and unemployment rate. Participation gap is defined as the difference of actual and trend participation rate as a percentage of trend.
Source:OECD calculations based on Datastream and OECD (2015),OECD Economic Outlook: Statistics and Projectionsand Main Economic Indicators(databases), January.
1 2 http://dx.doi.org/10.1787/888933189080 0.0 0.2 0.4 0.6 0.8 1.0 1.2 1.4 1.6 0 2 4 6 8 10 12 14 16 18 20 22 24 Months A. Market interest rate expectations have moved
around1
17 February 2015 Forward guidance II Forward guidance I Pre forward guidance
65 70 75 80 85 90 95 -4 -2 0 2 4 6 8 2006 2007 2008 2009 2010 2011 2012 2013 2014 B. Spare capacity has narrowed2
Output gap (left scale) Unemployment gap (left scale) Participation gap (left scale) Capacity utilisation rate (right scale)
Continuing fiscal consolidation
Public finances were hit hard by the crisis and the budget deficit reached nearly 11% of GDP in 2009 (Figure 16, Panel A). From 2010 to the end of 2014, the government had been pursuing two fiscal targets: i) to balance the current budget (which is overall budget net of investment spending) in cyclically-adjusted terms by the end of a rolling five-year period; and ii) to begin to reduce public sector net debt (which is gross debt excluding liquid assets) as a share of GDP in 2015-16. To reach both targets, the authorities have been implementing a medium-term fiscal consolidation plan (Figure 16, Panel B). The budget, net of investment spending, is projected to reach a cyclically-adjusted surplus of 0.7% in 2017-18 and public sector net debt is projected to peak in 2015-16 and start falling the year after (OBR, 2014). From Budget 2015, the updated fiscal mandate will aim to achieve cyclically-adjusted current balance by the end of a rolling three-year period and a falling public sector net debt as a share of GDP in 2016-17. Implementation of fiscal consolidation has been monitored by the Office for Budget Responsibility (OBR), a high-profile fiscal watchdog created in 2010, whose stability and independence could be consolidated if it were funded by a multiannual commitment under Parliament’s scrutiny. OBR’s independence could also be strengthened by defining the term span of the chair independently of the electoral cycle (OECD, 2014b).
Between budgets 2009-10 and 2014-15, discretionary measures amounted to 7% of GDP, with three-quarters of the adjustment on the spending side, including cuts in public services, investment and benefits. More recently, some revenues have disappointed owing to weaker wage growth, lower residential property transactions and lower oil and gas revenues. This will require further offsetting measures to stick to the medium-term consolidation plan.
Fiscal consolidation has had important distributional effects, as it mainly fell on the top 20% of earners essentially because of tax increases, and the bottom 20% of earners because of cuts in tax credits and benefits, partly offset by successive above-inflation increases in the tax-free allowance (Figure 17, Panel A). However, the net position of the
Figure 15. Tensions are emerging in the labour market
1. Unemployment data refer to the population aged 16 and over. Data for Q4 2014 refer to the period between September and November 2014.
Source:ONS (2015), “Labour Market Statistics, January 2015”, Office for National Statistics.
1 2 http://dx.doi.org/10.1787/888933189098 0 1 2 3 4 5 2006 2007 2008 2009 2010 2011 2012 2013 2014 A. Available vacancies are rising
Vacancies by industry, per 100 employee jobs Manufacturing
Construction
Wholesale and retail trade Accommodation and food services
0 1 2 3 4 5 6 7 2006 2007 2008 2009 2010 2011 2012 2013 2014 B. Unemployed to vacancy ratio is falling
third and fourth income quintiles has so far been little affected. Once real wage increases start to be sustained, a stronger contribution from average-income earners to additional fiscal consolidation efforts would help to reduce pressure on low-income earners. The authorities’ assessment of distributional impacts of fiscal consolidation is welcome and
Figure 16. Fiscal consolidation is underway
Per cent of GDP
Source:OECD (2015),OECD Economic Outlook: Statistics and Projections(database), January and Institute for Fiscal Studies.
1 2 http://dx.doi.org/10.1787/888933189103 Figure 17. Distributional impact of fiscal consolidation
1. Cumulative impact of public service spending, tax and welfare changes on households in 2015-16 as a percentage of 2010-11 net income (including households’ benefits in kind from public services). Net income quintiles adjusted for household size.
2. The ranking of instruments is determined based on their short-term and long-term effects on growth, short-term and long-term effects on equity, with equal weights and scores of +1 (positive influence) or -1 (negative influence) attributed in each case.
Source:HM Treasury (2014), “Impact on Households: Distributional Analysis to Accompany Autumn Statement 2014”, December and Cournède, B., A. Goujard and Á. Pina (2013), “How to Achieve Growth- and Equity-friendly Fiscal Consolidation?: A Proposed Methodology for Instrument Choice with an Illustrative Application to OECD Countries”, OECD Economics Department Working Papers, No. 1088, OECD Publishing.
1 2 http://dx.doi.org/10.1787/888933189117 36 38 40 42 44 46 48 50 2001 2003 2005 2007 2009 2011 2013 A. The budget deficit is still sizeable...
Deficit Expenditure Revenue -2 0 2 4 6 8 10 12 2009/10 2011/12 2013/14 2015/16 2017/18 2019/20 B. ...but further tightening measures are planned
Tax increases Investment Benefits Debt interest Public services and other
-5 -4 -3 -2 -1 0 1 2 3 4 5
Bottom 2 3 4 Top All
Equivalised net income quintiles A. Equity effects of UK consolidation
Cumulative impact on households in 2015-16, per cent of 2010-11 net income, by income distribution1
Change in public service spending Change in tax credits and benefits Change in tax
Net position
0 5 10 15 20 25
B. OECD hierarchy of consolidation instruments when considering growth and equity
Rank from 1 (best) to 17 (worst)2
Subsidies Pensions Other property taxes
Unemployment insurance Personal income taxes Corporate income taxes Environmental taxes Rec. taxes on imm. property
Other gov. consumption Sales of goods and services
Sickness payments Consumption taxes Public investment
Health services in kind Soc. sec. contributions Childcare and family
Education
should be continued. Performing such analysis as policy proposals evolve would further support sound decision-making.
If the latest medium-term projection of the OBR to reach a budget surplus of 1% of GDP in 2019 is achieved (OBR, 2014) and assuming nominal GDP growth is about 4.5%, debt will fall sharply relative to GDP (Figure 18, baseline scenario). Structural reforms would make it easier to maintain such a surplus, though. In particular, raising the state pension age for men and women to 66 in 2020 and to 67 between 2026 and 2028, as already legislated, and linking the pension age to life expectancy, as the government has announced, would mitigate spending pressures. On the other hand, a recent decision to allow higher lump-sum withdrawals of pension assets, designed to give people flexibility and to make an informed choice, could however result in people having too little saving for retirement, ultimately resulting in political pressure to raise state pensions (OECD, 2014c). Public debt would only stabilise at nearly 80% of GDP if fiscal consolidation were to stop in 2016 and the budget deficit remained at close to 3% of GDP thereafter (the “less consolidation” scenario). Should productivity be flat and the deficit maintained at 3% of GDP, the public debt would rise steadily (the “less consolidation and no productivity growth” scenario).
Fiscal consolidation needed to fulfil the authorities’ medium-term plan amounts to an estimated reduction in the primary structural budget balance of nearly 2.5% of GDP from 2014 to 2016 (Table 1). From 2015-16, the authorities plan to cap welfare spending (apart from pension and unemployment benefits) while public services are expected to bear the major part of the adjustment (Figure 16, Panel B). This would imply reducing government consumption of goods and services by around 6.5% of GDP between 2010-11 and 2019-20, to the lowest level at least since 1948 (OBR, 2014). However, the exact composition of fiscal
Figure 18. Simulations show that reducing public debt will require further efforts
General government gross debt, Maastricht definition, per cent of GDP1
1. The baseline scenario shows projections based on theOECD Economic Outlook: Statistics and Projectionsdatabase until 2016, prolonged with the growth scenario used in the OECD (2014), “Long-term Baseline Model” (GDP growth in the period 2017-40 averaging 2.6% in real terms and 4.6% in nominal terms). It excludes financial transactions and assumes achieving budget balance in 2018 and a surplus of 1% of GDP from 2019 onwards. The “no productivity growth” scenario assumes only employment growth (averaging 0.5% in real terms) over 2017-40. The “less consolidation” scenario assumes that the budget deficit stabilises over 2017-40 at 3.1% of GDP. The “less consolidation and no productivity growth” scenario is a combination of constant budget deficit at 3.1% of GDP and only employment growth over the period 2017-40.
Source:Calculations based on OECD (2015),OECD Economic Outlook: Statistics and Projections(database), January and Office for Budget Responsibility (2014), “Fiscal Sustainability Report”, July.
1 2 http://dx.doi.org/10.1787/888933189123 0 20 40 60 80 100 120 1995 1998 2001 2004 2007 2010 2013 2016 2019 2022 2025 2028 2031 2034 2037 2040 Baseline No productivity growth Less consolidation
adjustment will need to be set out by the next government. Continuing the current policy of protecting (i.e. maintaining or slightly raising real spending) some departments (health, education and international development) would imply average cuts in real terms on the others of close to 40% between 2010-11 and 2019-20 (Crawford, 2014). The current government is aiming to achieve further efficiency gains in public administration, but there is evidence suggesting the potential scope for this is rather low (Hribernik and Kierzenkowski, 2013). Hence, the composition of fiscal adjustment should be reviewed to ease pressure on public services that have already contributed to consolidation.
There is scope to boost further efficiency in the health sector and education (OECD, 2011a; OECD, 2011b). In the former, by addressing excessive remuneration for general practitioners and by further increasing competition in health care provision. In the latter, efficiency can be strengthened by supporting higher and more equal autonomy across school types, and focusing investment and policies on disadvantaged children could generate more long-term savings. Yet, reforms should be carefully calibrated to preserve high health status (Figure 2, Panel A), growth and equity (Figure 17, Panel B).
There is room to increase revenue while making the tax system more efficient. Income tax expenditures are large and reducing them in certain areas could also improve resource allocation and productivity (Cournède et al., 2013). In particular, the self-employed could be subject to the same income taxes as employees, as recommended by theMirrlees Review (Mirrlees et al., 2011), which would support the quality of entrepreneurship and hence productivity. Moreover, higher social security contributions could be levied on the self-employed. Updating property valuations of the council tax, as discussed below, would further support public finances and improve equity, and would not hurt growth much (Figure 17, Panel B). Removing preferential and zero value-added tax (VAT) rates could generate substantial revenue (Cournède et al., 2013; OECD, 2011a). Only reduced VAT rates on food, energy and water supply have major progressive effects and therefore removing them could require adjustments to welfare programmes to protect the poor (Thomas, 2014).
Rekindling productivity growth
Drivers of the productivity puzzle
Subdued productivity since the crisis may reflect a combination of shocks that have lowered capital stock accumulation, reduced labour efficiency and boosted labour supply. These shocks have compounded productivity developments that were losing momentum in the run-up to the crisis.
Key macroeconomic policy recommendations
● As underlying inflationary pressures emerge, gradually start increasing the policy rate and, thereafter, begin reducing the size of the Bank of England’s balance sheet.
● Continue to pursue the medium-term fiscal consolidation path while letting automatic stabilisers operate, and ensure consolidation efforts are fair.
● Seek further efficiency gains in health and education, and broaden the tax base, such as equalising income taxes and social security contributions between the self-employed and employees.
The investment ratio was trending downward and was low in international comparison prior to the crisis (Figure 19, Panel A). It has been further hit by the global downturn, which led to weak demand, large uncertainty and depressed business confidence (Figure 5, Panel B). Impaired credit availability (Figure 13) and higher bank lending spreads, particularly for SMEs (Figure 20), have held back business investment. Tighter financial regulation needed to enhance financial stability and the reassessment of risk could have long-lasting effects (Cournède, 2010; Slovik and Cournède, 2011; Broadbent, 2012; McCafferty, 2014; Daly, 2014; Lewis et al., 2014). Fiscal consolidation has contributed to lower accumulation of the capital stock by the public sector (Figure 16, Panel B). At the same time, high wage flexibility may have encouraged substitution of labour for capital.
Total factor productivity (TFP) growth was weakening before the crisis (Figure 19, Panel B). Since the crisis, the build-up of intangible capital has fallen as the proportion of companies reporting product and process innovation has dropped (Barnett et al., 2014a). Moreover, capital and labour reallocation has weakened, holding back TFP. Churn in the labour market tumbled, although it has been rising more recently (Figure 21, Panel A), and there is evidence of less worker reallocation from low to high productivity firms (Barnett et al., 2014b). The movement of capital across and within sectors has been particularly low despite a significant increase in the dispersion of rates of returns, which should have increased incentives to reallocate (Barnett et al., 2014c). Pressure for corporate restructuring may have been lower than in the previous recession as reflected by a high share of loss-making firms, one reason being weak lending efficiency and possibly a crowding out of lending to new firms (Figure 21, Panel B). Also, business liquidations have been low compared to the size of the output shock and relative to the previous recession of the early 1990s. Poor resource reallocation may have resulted from bank forbearance and
Figure 19. Productivity growth was losing momentum before the crisis
1. Investment refers to gross fixed capital formation.
2. Labour productivity is defined as output per worker (i.e. real gross value added (GVA) divided by total employment). Contributions to growth are calculated using a weight of 0.67 for employment and 0.33 for productive capital; total factor productivity is calculated as a residual. Productive capital excludes investment in housing.
Source: OECD (2015),OECD Economic Outlook: Statistics and Projections(database), January, ONS (2014), “Labour Productivity, Q3 2014”, Office for National Statistics, December, ONS (2014), “Capital Stocks and Consumption of Fixed Capital, 2014”, Office for National Statistics, November and ONS (2015), “Labour Market Statistics, January 2015”, Office for National Statistics.
1 2 http://dx.doi.org/10.1787/888933189133 -5 -4 -3 -2 -1 0 1 2 3 4 1998 2001 2004 2007 2010 2013 B. Labour efficiency growth was weakening
Labour productivity growth with contributions, percentage points2
Total factor productivity Capital-to-employment ratio Labour productivity growth 0 5 10 15 20 25 30 35 40 1971 1978 1985 1992 1999 2006 2013 A. Investment was low
Per cent of GDP1
United Kingdom Canada
France Switzerland United States
low interest rates (Arrowsmith et al., 2013), and some tax reliefs for firms (Barnett et al., 2014a).
Structural reforms have strengthened labour supply. Welfare, pension and immigration reforms have lowered reservation wages, and declines in labour unionisation have reduced labour’s bargaining power (Blundell et al., 2014; Pessoa and Van Reenen, 2014; OECD, 2014a). These reforms have lifted the participation rate (Figure 9, Panel C; Figure 10, Panel A), which otherwise would have been falling if only accounted for by population ageing (BoE, 2014d). Increased labour supply has put downward pressure on productivity and it may take time for the capital stock to adjust to the higher level of labour (Carney, 2014). Moreover, recent job growth has partly been concentrated among individuals who may have lower-than-average productivity, moving into employment with generally lower skills and/or remaining self-employed.
Subdued productivity since 2007 is reflected in a persistent gap between actual and trend output, while employment has essentially converged to its pre-crisis trend (Figure 22) and total hours worked are already slightly above pre-crisis trend. However, this masks important heterogeneity across sectors (Figure 23; Kierzenkowski et al., 2015).
In non-financial services (explaining about a third of the overall productivity shortfall), employment and output have been recovering since 2010 but productivity growth has weakened, notably as the sector has absorbed increased labour supply (Figure 23, Panels A and B). In fact, this sector has been a high recipient of self-employed. In manufacturing (accounting for almost 30% of the overall productivity shortfall), employment was steadily falling prior to the crisis but it has been remarkably stable since 2010, suggesting weaker corporate restructuring and substitution of labour for capital (Figure 23, Panels C and D). In parallel, weak output may have reduced incentives for business investment. In the finance and insurance sector (contributing nearly 25% to the total productivity gap), output has
Figure 20. Businesses face lower bank lending rates, but higher risk premiums
Percentage points
1. Monthly average of weighted average interest rates of UK resident monetary financial institutions’ (excluding Central Bank) new sterling loans to private non-financial corporations. Not seasonally adjusted.
2. Three month moving average applied. In the United Kingdom, small loans are defined as loans below GBP 1 million, while in France, Germany and Netherlands small loans are defined as loans below EUR 1 million. Source:Bank of England (2015), “Interest and Exchange Rates Data”,Statistical Interactive Database, January and ECB (2015), “MFI Interest Rates”,Statistical Data Warehouse, European Central Bank, January.
1 2 http://dx.doi.org/10.1787/888933189149 0 2 4 6 8 10 2004 2006 2008 2010 2012 2014 A. UK interest rates have come down1
Loans below or equal to GBP 1 million Loans between GBP 1 and 20 million Loans above GBP 20 million
-0.5 0.0 0.5 1.0 1.5 2.0 2.5 3.0 2004 2006 2008 2010 2012 2014 B. Bank lending spreads have picked up
Spread between small and large loans2
United kingdom Germany
been falling in the wake of the financial crisis, but employment has been fairly steady perhaps owing to redeployment of staff to address higher compliance costs of tighter financial regulation (Figure 23, Panels E and F). With shrinking mining and quarrying
Figure 21. The reallocation of labour and capital resources has been weak
1. All resignations refer to the number of people who report resigning three months ago, and report being employed, unemployed or inactive. Job-to-job flows refer to the number of people who report resigning three months ago, and report being in employment for less than three months. Two quarter averages.
2. Loss-making firms refer to the number of companies that reported negative pre-tax profits in each year as a percentage of the total number of private non-financial corporations in the Bureau van Dijk data set that report data on pre-tax profits. Companies in the mining and quarrying, electricity and gas supply, and water supply sectors and extra-territorial organisations are excluded from the calculations. For company liquidations changes to legislation, data sources and methods of compilation mean the statistics should not be treated as a continuous and consistent time series. Since the Enterprise Act 2002, a number of administrations have subsequently converted to creditors’ voluntary liquidations.
Source:Bank of England (2014), “Inflation Report, November 2014” and “Inflation Report, August 2013”, and Bank of England (2014), “The UK Productivity Puzzle”,Quarterly Bulletin 2014 Q2, June.
1 2 http://dx.doi.org/10.1787/888933189155 Figure 22. Weak output is the main drag on productivity at the aggregate level1
1. Pre-crisis linear output and employment trends are calculated between 1997 and 2007, and are projected from 2008 onwards.
2. Real gross value added (GVA).
Source:ONS (2014), “Quarterly National Accounts, Q3 2014”, Office for National Statistics, December and ONS (2014), “Labour Productivity, Q3 2014”, Office for National Statistics, December.
1 2 http://dx.doi.org/10.1787/888933189160 0.0 0.2 0.4 0.6 0.8 1.0 1.2 1.4 1.6 1.8 2.0 1998 2000 2002 2004 2006 2008 2010 2012 2014 A. Job churn has not fully recovered
Per cent of private sector employment1
All resignations Job-to-job flows
15 20 25 30 35 40 0 5 10 15 20 25 30 1984 1990 1996 2002 2008 2014 Thousand
B. Corporate sector restructuring is poor2
Company liquidations (left scale) Loss-making companies (right scale)
Per cent -15 -10 -5 0 5 10 70 80 90 100 110 120 1997 1999 2001 2003 2005 2007 2009 2011 2013 A. Output2has not recovered to pre-crisis trend...
Deviation from trend (right axis) Output (left axis)
Pre-crisis trend (left axis)
Index 2007 = 100 Percentage points
-15 -10 -5 0 5 10 70 80 90 100 110 120 1997 1999 2001 2003 2005 2007 2009 2011 2013 B. ... but employment has largely done so
Deviation from trend (right axis) Employment (left axis) Pre-crisis trend (left axis)
Figure 23. There is significant heterogeneity in output and employment developments across sectors1
1. Output refers to real gross value added (GVA). Pre-crisis linear output and employment trends are calculated between 1997 and 2007, and are projected from 2008 onwards.
Source:ONS (2014), “Quarterly National Accounts, Q3 2014”, Office for National Statistics, December and ONS (2014), “Labour Productivity, Q3 2014”, Office for National Statistics, December.
1 2 http://dx.doi.org/10.1787/888933189175 -45 -30 -15 0 15 30 45 40 60 80 100 120 140 160 1997 1999 2001 2003 2005 2007 2009 2011 2013 A. Non-financial services - output
Deviation from trend (right axis) Output (left axis)
Pre-crisis trend (left axis)
Index 2007 = 100 Percentage points
-45 -30 -15 0 15 30 45 40 60 80 100 120 140 160 1997 1999 2001 2003 2005 2007 2009 2011 2013 C. Manufacturing - output
Deviation from trend (right axis) Output (left axis)
Pre-crisis trend (left axis)
Index 2007 = 100 Percentage points
-45 -30 -15 0 15 30 45 40 60 80 100 120 140 160 1997 1999 2001 2003 2005 2007 2009 2011 2013 E. Financial services - output
Deviation from trend (right axis) Output (left axis)
Pre-crisis trend (left axis)
Index 2007 = 100 Percentage points
-45 -30 -15 0 15 30 45 40 60 80 100 120 140 160 1997 1999 2001 2003 2005 2007 2009 2011 2013 B. Non-financial services - employment
Deviation from trend (right axis) Employment (left axis) Pre-crisis trend (left axis)
Index 2007 = 100 Percentage points
-45 -30 -15 0 15 30 45 40 60 80 100 120 140 160 1997 1999 2001 2003 2005 2007 2009 2011 2013 D. Manufacturing - employment
Deviation from trend (right axis) Employment (left axis) Pre-crisis trend (left axis)
Index 2007 = 100 Percentage points
-45 -30 -15 0 15 30 45 40 60 80 100 120 140 160 1997 1999 2001 2003 2005 2007 2009 2011 2013 F. Financial services - employment
Deviation from trend (right axis) Employment (left axis) Pre-crisis trend (left axis)
sector (Figure 7, Panel A) (driving around 3% of the aggregate productivity shortfall) employment and output were on a secular decline before the crisis, but rising maintenance costs and willingness to improve production may explain an expansion in labour between 2009 and 2012. Indeed, output of the sector has stabilised since late 2012.
Enhancing a knowledge-based economy
Reforms are needed to strengthen the supply side of the economy and to unleash productivity. The UK has long-standing challenges related to education and skills (Figure 2, Panel A), take-up of research, infrastructure and land-use planning, and access to finance for young and innovative firms. Policies to favour a knowledge-based economy could include encouraging highly qualified immigrants to work and live in the UK, which would help to address skill shortages and to boost labour productivity. To that end, the government should ease quotas on company-sponsored visas, which were introduced between 2008 and 2010 at a time of low labour demand, but are too restrictive for the tightening labour market.
The youth employment rate is close to 50% and exceeds the OECD average by nearly 10 percentage points, but the UK slightly lags behind the rest of the G7 in terms of education and skills (Figure 2, Panel A). Reducing the incidence of labour market mismatches of youth in employment – which is high in terms of field of study and qualification, and field of study only (Figure 24) – would also improve labour efficiency. This could be achieved by requalification and lifelong learning. Improving career guidance and encouraging the combination of work and study would be additional steps to reduce mismatches of labour market entrants (OECD, 2014d), and the government has put strong emphasis on developing apprenticeships. Reforms of vocational education in England (OECD, 2013a) – including the expansion of high quality post-secondary programmes, employer engagement in the development of qualifications, and improvements in teacher qualification requirements – would be additional steps forward to enhance skills and productivity.
Vibrant competition in product markets is also an effective spur to productivity. The UK product market regulation is among the least restrictive in the OECD, although there is scope to reduce barriers in services sectors and relax the licence and permits system (Figure 25). In particular, a “silence is consent rule” is not a standard procedure, there are no single contact points for all licences and at the local level (at least in the three largest cities), and access to some commercial activities is subject to entry requirements (road freight business, retail outlets, accountancy, architecture). According to 2015Doing Businesssurvey of the World Bank, the UK overall ranks 8th out of 189 countries, but only 45th for starting a business, 68th for registering property, 70th for getting electricity, and 36th for enforcing contracts. More generally, continued efforts to develop knowledge-based capital, maintaining market dynamism and sustaining the diffusion of new technologies are key to raise productivity growth.
Tax measures continue to be implemented to encourage innovation and business investment (OECD, 2013b). The government has increased tax incentives for research and development and has announced a temporary business rates relief for small businesses. Business investment will also benefit from a more generous annual investment allowance until the end of 2015. The corporate income tax rate was cut in steps from 30% in 2007 to 20% in 2015, the lowest single rate for businesses of all sizes in the G20. Also, in 2013 the authorities introduced a “Patent Box”, a tax rate of 10% on profits derived from patents. Such attractive tax conditions need to be coupled with requirements for substantial
activity to encourage productivity spillovers. The measures unveiled in the Autumn Statement 2014 demonstrate the willingness of the UK to put an end to double non-taxation. Also, international co-ordination is needed to avoid potential efficiency losses stemming from excessive tax competition, as well as to ensure a predictable and fair environment for business taxation.
Improving infrastructure
Physical infrastructure is a key driver of productivity as it facilitates activity in other sectors via logistics, information and so forth. There are important complementarities
Figure 24. Youth job mismatch is high
Total mismatch among youth (16-29) by type of mismatch, per cent of all youth in employment1
1. Data for Belgium and United Kingdom refer to Flanders and England and Northern Ireland respectively. Workers are classified as mismatched by qualification if they have higher or lower qualifications than required by their job and by field of study if they are working in an occupation that is not related to their field of study. The category of other includes mismatches by qualification only and by the combination of literacy, qualification and field of study. Occupation is only available at the 2-digit level in the ISCO-08 classification for Australia and Finland. Hence it is not possible to assess the extent of field of study mismatch in these two countries using the same definition used for the other countries.
Source:OECD (2014),OECD Employment Outlook 2014.
1 2 http://dx.doi.org/10.1787/888933189188 Figure 25. There is scope to reduce barriers to entrepreneurship
Product market regulation (PMR) score, index scale from 0 (least restrictive) to 6 (most restrictive)1
1. For antitrust exemptions the PMR score of the average of 5 best OECD countries is zero (i.e. least restrictive). Source:OECD (2013),OECD Product Market Regulation Database.
1 2 http://dx.doi.org/10.1787/888933189191 0 20 40 60 80 100
FIN AUS AUT DEU NLD BEL EST POL CZE SVK SWE KOR NOR DNK CAN IRL JPN FRA USA ITA GBR ESP Field of study and qualification Field of study only Other
0 1 2 3 4 5
Admin. burdens for sole proprietor firms Communication and simplification of rules/procedures Antitrust exemptions Legal barriers to entry Admin. burdens for corporation Barriers in network sectors Barriers in services sectors Licence and permits system Barriers to entrepreneurship (overall)
United Kingdom