1627
Best Practice for Inventory Optimization based on a Restructuring
of the Organization, its Functions, and its Information Systems
Shintaro Urabe
Research and Development Group.
Research and Development Department
Business Planning & marketing Division
Hitachi Solutions East Japan, Ltd
Kawasaki Ekimae Tower Riverk
12-1, Ekimae Honcho, Kawasaki-ku, Kawasaki, Japan
Masaru Tezuka
Research and Development Dept.
Business Planning & marketing Division
Hitachi Solutions East Japan, Ltd
NBF Sendai Honcho Bldg
2-16-10, Honcho, Aoba-ku, Sendai, Japan
Abstract
Although several manufacturers have introduced inventory management systems, few were successful at inventory optimization. This is because effective inventory control requires not only the information systems, but also a restructuring of the organization and its functions. This report describes a best practice to optimize inventory implemented by a health and beauty products company in Japan. The company underwent organizational restructuring by establishing a supply chain management (SCM) department to handle the functions of supply and demand management, and distribution. Before the restructuring, the production, sales, and logistics departments were responsible for these functions. However, their key performance indicators (KPIs) often conflict with each other. For example, continuous production with bigger lot sizes, implies lower production costs (KPI for Production). However, it reduces Production flexibility to respond to demand fluctuations, thus, negatively impacts the KPIs for Sales or Logistics. Post the restructuring, the SCM department was responsible for supply and demand management, thus, the problem of conflicting KPIs was resolved. The company also implemented functional restructuring. A new information system was implemented to support the restructured organization and its functions. It comprised the Production, Sales, and Inventory (PSI) dashboard and simulator. Consequently, the company reduced its inventory levels by 35 percent.
Keywords
Inventory management, Organizational restructuring, Functional restructuring, Dashboard, Key Performance Indicator (KPI)
1.
Introduction
Inventory management is of great importance to manufacturers since it has a significant impact on their financial positions. Excess inventory prevents cash from being utilized effectively (since the cash flows are stuck in inventory), while inventory shortfall leads to lost sales opportunities. Although several manufacturers have introduced inventory and order management systems, most of them failed at inventory optimization. This is because effective inventory control requires not only the introduction of information systems, but also a restructuring of the organization and its functions. In this context, we highlight that organizational restructuring is far more important than the information systems.
All manufacturers have their own business objectives. Each objective is divided into several sub-objectives based on the organization structure, and the sub-objectives are further divided into KPIs for each department. Surprisingly, the KPIs are often in conflict with each other, even though they are established to achieve the same overall
Proceedings of the 2014 International Conference on Industrial Engineering and Operations Management Bali, Indonesia, January 7 – 9, 2014
1628
objective. Thus, when a particular department achieves its KPI, the others report a failure in their KPIs. Consequently, the overall company objective, such as inventory optimization, is not achieved. In order to resolve the conflicts between the KPIs, the organizational structure and the functions of each department have to be modified so that their KPIs are synchronized. The information system design should be such that it supports the activities of the departments to achieve their KPIs. This paper introduces the successful inventory optimization practices of a health and beauty care products company in Japan.
2.
Conflicts between the KPIs for the Production, Sales, and Logistics Departments
Before discussing the successful restructuring of the company, we briefly describe the problems that the company faced. The company produces personal hygiene products, bath items, and chemical products. Its annual sales are around EUR 830 million. Prior to the organizational restructuring, the company had separate departments for production, sales, and logistics. Each department specialized in a particular function, but their KPIs were often in conflict with each other.
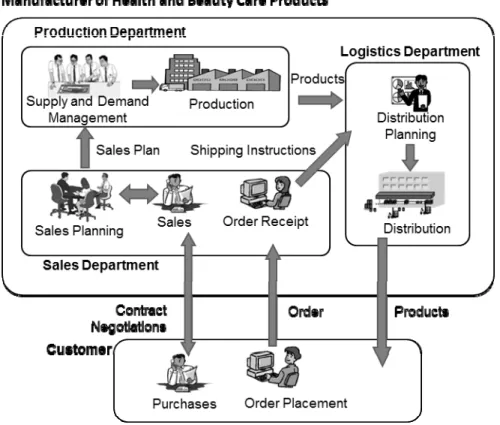
Figure 1 illustrates the organizational setup prior to the restructuring. The sales department prepares a sales plan. Based on this plan, the production department modifies their production plan. Products are manufactured as per the production plan, and then delivered to warehouses managed by the logistics department. The sales department receives orders from the customers and conveys the shipping instructions to the logistics department. The latter prepares a distribution plan and delivers the products to the customers.
2.1Old KPIs for the Production Department
The KPIs for the production department include the operating rate, the production efficiency and the production cost. Continuous production reduces the idle time and leads to a higher operating rate. However, the production is consequently greater than the market demand. Thus, a higher operating rate often results in excess inventory.
1629
Continuous production, along with bigger lot sizes, reduces the production cost because it entails lower setup and changeover costs. However, it reduces the production department’s flexibility to respond to demand fluctuations and, thus, negatively impacts the KPIs for Sales (lost sales opportunity) or Logistics (excess inventory).
2.2Old KPIs for the Sales Department
The KPI for the sales department is the company’s sales figure. The sales team tends to prepare a sales plan that exceeds actual demand. There are two key reasons for this. First, an ambitious plan indicates their enthusiasm for expanding sales. Second, they want to avoid lost sales opportunities, and therefore include “safety stock” in their sales plan. Consequently, the company tends to overstock.
Further, since the KPI is not an individual product sale but an overall sales figure, the sales team tends to focus on fast-selling products. Consequently, the sales of these products exceed the planned target leading to stock-outs. At the same time, the sales of the slow-moving products fall short of the target, thereby resulting in excess inventory. In case of stock-outs, the production department has to change the production and purchase plans in order to increase the production, thereby resulting in higher production costs. In case of overstocks, the storage costs increase.
2.3Old KPIs for the Logistics Department
The logistics department of the company is responsible for its product distribution system, including warehouse management and transportation. The department’s KPIs include the on-time delivery rate, the transportation costs, and the storage costs. These KPIs themselves are in conflict with each other. Frequent deliveries of smaller quantities will improve the on-time delivery rate; however, they will also lead to higher transportation costs. Further, the logistics team maintains high inventory levels so that the products can be readily shipped. This results in overstocks.
3.
Restructuring the Organization
As described above, the conflicting KPIs resulted in a high cost structure. In particular, the company’s inventory levels were very high.
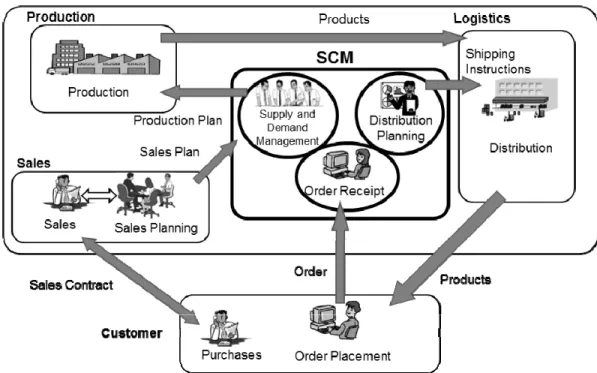
To resolve this problem, initially, the company implemented an organizational restructuring strategy by establishing a SCM department to handle the functions of supply and demand management, and distribution. Figure 2 illustrates the organizational setup post the restructuring. Certain functions like the supply and demand management function of Production, the order receipt function of Sales, and the distribution planning function of Logistics are integrated and transferred to the SCM department.
The sales plan prepared by Sales is sent to SCM. The latter forecasts the demand by utilizing both the sales plan and a statistical method based on the order receipt record. SCM then communicates with Sales to prepare a more realistic sales plan. It also modifies the production plan based on the demand and supply, and sends it to Production. SCM receives orders from the customers, makes the distribution plan, and sends it to Logistics. To achieve inventory and cost optimization for the company as a whole, new KPIs are set for each department.
3.1KPIs for the SCM Department
SCM is responsible for manufacturing and distributing the right products at the right time at the right place. It must also ensure the efficiency of the supply chain. Thus, the KPIs of SCM are maximizing the on-time delivery rate, and minimizing the opportunity loss, inventory costs, production costs and distribution costs.
3.2New KPIs for the Production Department
The plan achievement rate is introduced as the most important KPI for Production, followed by the production cost. Post the restructuring, the supply chain is centrally controlled by SCM. Thus, executing and achieving the production plan prepared by SCM is the most important function of Production.
3.3New KPIs for the Sales Department
The KPI for Sales continues to be the company’s sales figures. However, it is not a single overall sales figure, but rather is the sum total of the sales of the individual products.
1630
3.4New KPIs for the Logistics Department
Since the distribution planning function was moved to SCM from Logistics, the KPI for achieving the on-time delivery rate was also moved to SCM. The new KPIs for Logistics are the distribution plan achievement rate, the transportation costs, and the storage costs.
4.
Functional Restructuring
The company restructured the functions of each department.
4.1Production Department: Biweekly Production Review
Earlier, Production reviewed the production schedule on a monthly basis. However, post the restructuring, its KPI was the plan achievement rate. In order to execute the production as planned, it has to keep track of the production progress. In case of delays, it has to review and revise the schedule in order to achieve the production plan. Therefore, it introduced biweekly production reviews. It also increased the flexibility of its production lines.
4.2Sales Department: Product Portfolio Reduction
In 2007, prior to the restructuring, the company had a product portfolio of more than 4,000 products. It was reluctant to terminate unsalable and slow-moving products as it was afraid that its customers would switch to its competitors’ products. However, a large product portfolio implied excessive focus on managing the costs of sales. Post the restructuring, the KPI for Sales is the sum total of the sales of the individual products. Consequently, it has to manage the sales of individual products (i.e., prepare separate sales plans, promotional plans, and execute negotiations with customers), and therefore it reduced its product portfolio. Now, it sells around 2,000 products. The reduction in the product portfolio also contributes to inventory reduction since it eliminates the need for safety stock of the terminated products.
4.3Logistics Department: Merger of the Distribution Hubs and the Warehouses
Prior to the restructuring, the company had ten distribution hubs and each hub had more than one warehouse. There was some unused space in each warehouse, thus cumulatively resulting in a lot of wasted space. Further, it often
1631
happened that, for the same product, there were stockouts in a particular distribution area and excess inventory in another. The company merged the ten distribution hubs into four — one central hub and three remote hubs. All the products are initially sent to the central hub. About 80% of products are delivered to customers from the central hub. The rest are then sent to the remote hubs and are distributed by them. The merger led to higher transportation costs but drastically lower storage costs as the cost of land and the warehouse rental fees for the unused space was eliminated. Inventory distribution was also streamlined, thereby leading to lower total inventory levels.
5.
PSI Dashboard and Simulator
A new information system was implemented to support the newly restructured organization and its functions. It comprises the PSI dashboard and simulator. The main task of SCM is to ensure the efficiency of the supply chain by communicating with the other departments and synchronizing their KPIs. Thus, the new system focuses on communication. It ensures that all the departments share the same perspective on the current market conditions and the future trends, and collaborate accordingly. The PSI dashboard has three main windows — the PSI communication window, the PSI map window, and the inventory monitor window. The simulator is incorporated in the dashboard. The dashboard and the simulator can be accessed by all the departments. Anyone can see the record, the plan, and the simulated values of sales, production, and inventory.
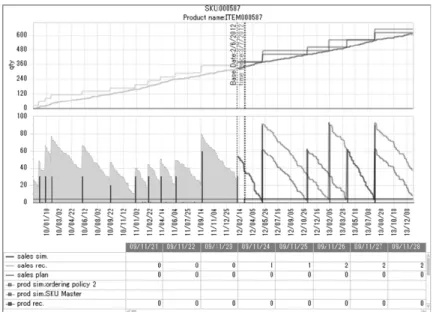
5.1PSI Communication Window
The PSI communication window is the most important window in this system. Figure 3 illustrates a sample of this window. It shows the sales plan prepared by Sales, the demand forecast calculated using statistical methods, and the sales record of the current year and the previous year. It also shows the production and the procurement plans and their actual records. The simulator module calculates the future production and inventory levels. One can set several scenarios with different sales and production levels. For every scenario, the simulated inventory level is immediately displayed.
SCM and Sales can both view the chart displayed in this window, and accordingly communicate with each other. When there is a huge gap between the sales plan and the forecast, they collaborate to eliminate it and develop a more realistic plan. SCM and Production can also view this chart, and discuss the revisions to the supply and demand management plan and the production plan. Thus, this window helps all the departments to develop the same perspective on the current market conditions, and facilitates smooth negotiations between them.
5.2PSI Map Window
The PSI communication window facilitates an understanding between the various departments. However, for a company with a product portfolio of more than 2,000 products, it is impractical to hold negotiations for all the
1632
Figure 4: PSI map window Figure 5: Inventory monitor window products. It has to filter and choose some products for negotiation.
The PSI map window aims to facilitate the filtering process. Figure 4 illustrates a sample PSI Map window. It uses a scatter chart to visualize the PSI data. Each point indicates a product. The horizontal and vertical axes of the chart can be set for more than 30 indices including the inventory level, the inventory turnover, the sales record, the sales plan, the sales forecast, and the delivery lead time.
In figure 4, the horizontal axis is the inventory turnover and the vertical axis is the inventory level. The products plotted in the top-left area have low inventory turnover and high inventory levels. These products are expected to generate excess inventory, and therefore their production has to be adjusted to the demand. Thus, the products’ plans have to be negotiated via the PSI communication window.
Similarly, when the horizontal axis represents the sales plan and the vertical axis represents the sales forecast, the products plotted in the top-left and the bottom-right areas have gaps between their sales plans and forecasts. Therefore, their plans have to be negotiated.
5.3Inventory Monitor Window
Figure 5 illustrates a sample inventory monitor window. It comprises a number of area charts. Each chart shows the inventory record and the simulated future inventory for a product. Line charts showing the inventory evaluation indices are also superimposed on the chart. Using this window, SCM notes the inventory status and prepares the distribution plan. In some cases, it may even revise the production plan as per the inventory level. Logistics also uses this window to optimize the structure of the distribution network. The chart specifications can be set to “product”, “product group”, “brand”, “distribution hub”, “warehouse”, and so on. When the specification is set as “brand”, every chart in the monitor shows the inventory of that particular brand.
1633
Figure 7: Days in Inventory of the three large health and beauty care companies in Japan
Figure 6: The evaluation indices
Figure 6 illustrates a sample chart displaying inventory evaluation indices. In this chart, the appropriate and current level of safety inventory, and the moving average of the inventory are shown. Based on this, one can determine whether the current safety inventory is lower than the appropriate level. In this case, the inventory falls short a couple of times, which is denoted by gaps in the chart area. The moving average shows the inventory trend line. This index has a parameter called “window size” which determines the number of points required for calculating the average value. In this example, the one-week moving average (7 days) is shown. If the trend is increasing or decreasing, it may indicate either excess inventory or stock-outs, respectively.
6.
Impact of the Restructuring
The company implemented the restructuring of the organization and its functions. It also introduced a new information system comprising the PSI dashboard and simulator. Consequently, it reduced its inventory levels by 35%. In Japan, there are three large companies in the health and beauty care products industry. Figure 7 shows the “days in inventory” for these companies, that is, the number of days the product remains in inventory, and is equivalent to the reciprocal of the inventory turnover in a day. Prior to the restructuring, the days in inventory for the company was 51 in 2006, the worst among the three companies. However, post the restructuring, it declined to 35 in 2009, and was the best among them.
7.
Conclusion
This paper discusses a best practice of inventory optimization implemented by a health and beauty care products company in Japan. The company implemented an organizational restructuring strategy by establishing a SCM department to handle the functions of supply and demand management, and distribution. The company also implemented functional restructuring, like the merger of its distribution hubs, the introduction of biweekly production review meetings, and the reduction in product portfolio. The PSI dashboard and simulator were introduced to facilitate communication between the SCM, sales, production, and logistics departments and to synchronize their KPIs. Consequently, the company reduced its inventory levels by 35 percent. Now it has the best
1634
inventory levels in the health and beauty care industry in Japan. This best practice highlights that effective inventory control is achieved not only by introducing information systems, but also by restructuring the organization and its functions.
References
Ciaran Walsh, 2004. Key Management Ratios.Pearson Education.
David Parmente, 2007.Key Performance Indicators. John Wiley and Sons, Inc.
Masanori Shishido, Satoshi Munakata, Masaru Tezuka, Takeru Narita, 2008. Early Detection of Inventory Troubles Utilizing Inventory Flow Visualization with Thumbnail View. Hitachi East Japan Solutions Technical Report, No. 14. , pp. 23-26
Masaru Tezuka, Satoshi Munakata, Masanori Shishido, Takeru Narita, 2008. KPI Balancing of Production, Sales, and Inventory through a Facilitation of Inter-department Communication. Hitachi East Japan Solutions Technical Report, No. 14, pp. 6-10
Shintaro Urabe, Masaru Tezuka, Satoshi Munakata, Shinji Iizuka, 2010. PSI Feature Map Method for Facilitating PSI Problem Detection and Inventory Management. National Conference of JASMIN 2010 Autumn.
Biography
Shintaro Urabe is a researcher in SCM of Research and Development Department at Hitachi Solutions East Japan. He received his Master of Engineering degree in Software and Information Science from Iwate Prefectural University in 2007. His research focuses on inventory control systems and visualization. He is also interested in simulation, optimization and user experience.
Masaru Tezuka is the Manager of Research and Development Department at Hitachi Solutions East Japan, Ltd. He received BE and ME in bio-physical engineering from Osaka University, Japan and PhD in systems and information engineering from Hokkaido University, Japan. His research interests include nonlinear optimization, evolutionary computation, computational intelligence, computational statistics, risk analysis, and their industrial application. He is a member of Information Processing Society of Japan.