A N N A L S OF
I N T E R N A L MEDICINE
VOLUME 9 DECEMBER, 1935 NUMBER 6
T H E HEMODYNAMICS OF T H E CIRCULATION IN
HYPERTENSION *
By J. MURRAY KINSMAN, M.D., F.A.C.P., and JOHN WALKER MOORE, M.D., F.A.C.P., Louisville, Kentucky
IN the past SO years, and especially in the last 10 years, many investiga-tors have been studying what may be called the mechanics or the dynamics of the circulation. The physiologists have succeeded in clearing up many disputed points in their work on animals; the clinicians have solved, by purely clinical observation, many of the problems which have arisen; and the physiologists and the clinicians together have studied many of the ques-tions involved, by experimentation on human beings. Of the mass of in-formation thus acquired concerning the dynamics of the circulation in man, much represents isolated and seemingly unrelated facts; some of it repre-sents correlated information concerning many factors and their interrela-tionships. But confusion still exists, and this confusion arises from several sources: (a) lack of correlation in the study of separate functions; (b) lack of accurate methods of measuring some of the most important of these functions; (c) lack of uniformity in respect to the conditions under which the observations were made; and (d) an apparent failure on the part of many investigators to appreciate that there may not always be any constant relationship from individual to individual, among the various functions concerned.
Within the past 10 years, relatively accurate methods of measurement of many of these functions have been developed. The velocity of blood flow, for example, can now be measured with great accuracy by several methods. The venous pressure is capable of measurement by the direct method to a degree of accuracy sufficient for our purposes. The vital capac-ity has been known as a very accurate index of the efficiency of the cir-culation for many years. The measurement of the cardiac output or blood flow is, however, still a controversial subject. Many methods have been * Read by title at the Philadelphia meeting of the American College of Physicians. May 2, 1935.
From the Department of Medicine, University of Louisville School of Medicine, Louis-ville, Ky.
6 5 0 J. MURRAY KINSMAN AND JOHN WALKER MOORE
developed for application to the human, most of them depending upon re-breathing for their performance. Between these individual methods there is not complete agreement in the order of the figures obtained. With all these rebreathing methods, accurate results are not possible in the presence of severe congestive failure, so that although unquestionably accurate in other conditions, their field of usefulness has been limited by this drawback. Hence, a complete understanding of the hemodynamics of the circulation in heart disease in all the various states of compensation and decompensation has not been possible because of this limitation.
With the development of the dye injection method of measuring the cardiac output, we believe we have a method which accurately measures the circulation, even in the presence of severe congestive failure. We present here a study, based on this method, of the hemodynamics of the circulation in hypertension, with data concerning the changes that occur in its various functions as congestive failure develops, even to an extreme degree, and as compensation becomes reestablished. We shall also show the relative effects upon these functions of rest alone and of rest and digitalis.
The technic of the dye injection method and the evidence for its ac-curacy have been reported elsewhere.1 Briefly the principle of the method is as follows: A dye (brilliant vital red) is injected rapidly into a vein while simultaneously samples of blood are collected from an artery (fem-oral) into little tubes arranged around the outside of a rotating drum. The samples are timed and the concentration of dye in each successive sample is determined colorimetrically. From the resulting curve of concentration plotted against time the cardiac output is calculated by a simple formula.
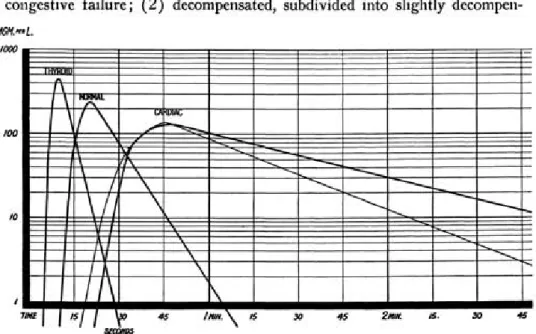
Figure 1 shows a series of curves obtained in this fashion. In this figure are shown a typical curve obtained from a normal case, one from a case of hyperthyroidism, one from a typical cardiac case severely decom-pensated and one from a typical cardiac case previously severely decompen-sated but compendecompen-sated at the time the test was made.
Bv this method we can determine: (1) the appearance time (A.T. or P.C.T.) of the dye, which indicates the pulmonary circulation time plus the time required for the dye to get to the heart from the point of injection and from the heart to the point of sampling; (2) the cardiac output ( F ) in liters per minute; (3) the total blood volume (B.V.) ; (4) the amount of blood (V) actively circulating in the heart and lungs and the great vessels of the chest. In addition, while the experiments were being carried out, we measured routinely: (5) the vital capacity (V.C.) ; (6) the venous pres-sure (V.P.) and the blood prespres-sure and the pulse rate. From these data we also calculated; (7) the stroke volume (S.V.) ; (8) the work of the heart ( W ) ; (9) the work per beat ( W B ) ; and (10) the volume clearance index (V.C.I.). This is the term we have given to a figure which is obtained by dividing the actively circulating blood volume by the stroke volume and which indicates the number of heart beats theoretically required to clear the heart, lungs and great vessels of their contained blood.
Clinically our cases were divided as follows: (a) 44 cases with normal cardiovascular systems, which furnished standards for comparison; (b) 75 cases of hypertension subdivided in the following fashion: (1) unde-compensated (14 cases) which had never shown any signs or symptoms of congestive failure; (2) decompensated, subdivided into slightly
decompen-FIG. 1. Illustrating typical curves obtained in different clinical conditions. Of the two curves to the right, the one in heavier lines was obtained from a cardiac patient showing severe congestive failure, and the one in lighter lines from a patient who had been severely decompensated but who, at the time the test was made, had regained compensation. sated (18 cases), moderately decompensated (7 cases), and severely decom-pensated (15 cases), depending upon the clinical impression as to the severity of congestive failure; (3) compensated (21 cases) which had previously been decompensated but which at the time of the test were per-fectly compensated. Many of the cases in the latter group had previously been in the decompensated group. It should be noted that this classification was made from the clinical standpoint alone, before the results of the test were known.
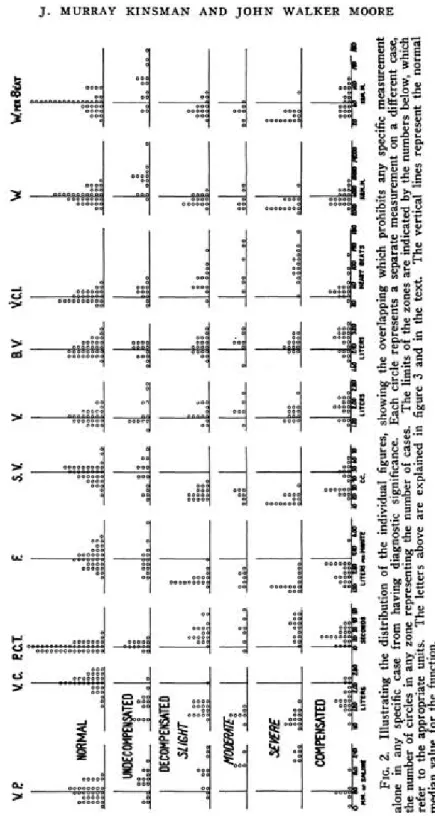
Results. The results of these tests are shown in table 1 and in figures 2 and 3. Figure 2 and table 1 both demonstrate the overlapping of results, indicating that, as has been pointed out by Starr, a single individual test on any given patient may not be of much value in diagnosis due to the fact that some of the factors may fall within the normal zone.
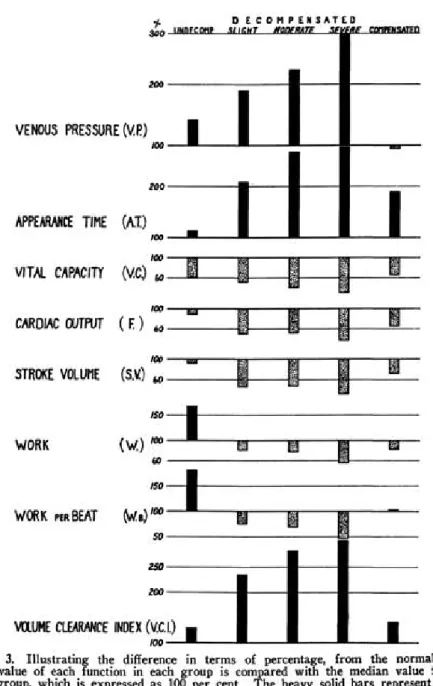
It will be seen from a study of figure 3 that very definite and consistent changes occur as heart failure develops and progresses. In those cases which have never been decompensated the venous pressure shows a definite increase over normal, and the vital capacity is very considerably reduced. The appearance time, that is the velocity of blood flow, is not significantly
6 5 2 J. MURRAY KINSMAN AND JOHN WALKER MOORE
FIG
. 2
. Illustratin
g
th
e distributio
n
o
f th
e individua
l figures
, showin
g
th
e overlappin
g
whic
h
prohibit
s an
y
specifi
c measuremen
t
alon
e i
n
an
y
specifi
c cas
e fro
m
havin
g
diagnosti
c significance
. Eac
h
circl
e represent
s a
separat
e measuremen
t o
n
a
differen
t case
,
th
e numbe
r o
f circle
s i
n
an
y
zon
e representin
g
th
e numbe
r o
f cases
. Th
e limit
s o
f th
e zone
s ar
e indicate
d
b
y
th
e number
s below
, whic
h
refe
r t
o
th
e appropriat
e units
. Th
e letter
s abov
e ar
e explaine
d
i
n
figur
e
3
an
d
i
n
th
e text
. Th
e vertica
l line
s represen
t th
e norma
l
media
n
valu
e fo
r th
e function
FIG. 3. Illustrating the difference in terms of percentage, from the normal. The median value of each function in each group is compared with the median value for the normal group, which is expressed as 100 per cent. The heavy solid bars represent an in-crease in value over the normal, and the stippled bars a dein-crease below the normal. changed, however, nor is there any significant change in output and the stroke volume. The volume clearance index does not show a marked in-crease, though there is a moderate one. On the other hand the work of the heart shows a tremendous increase, as might be expected, since the flow is essentially normal but the blood pressure greatly increased.
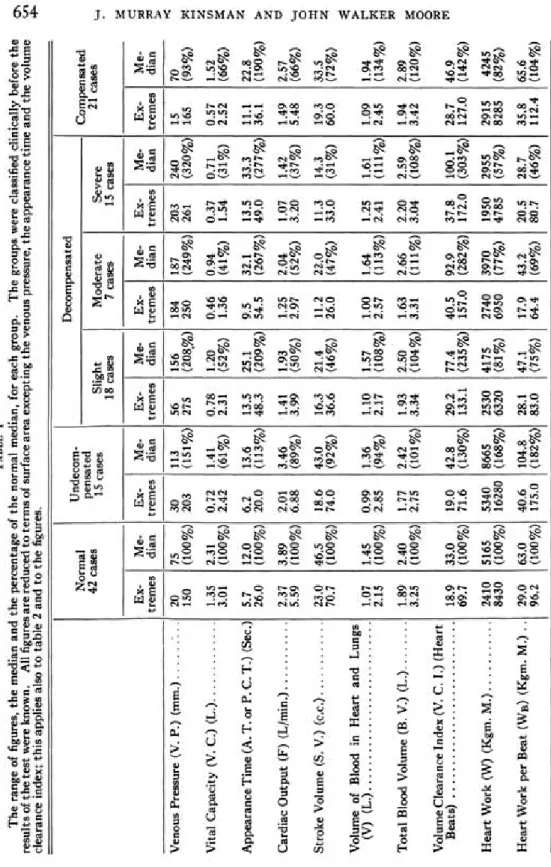
6 5 4 J . MURRAY KINSMAN AND J O H N WALKER MOORE TABL E I Th e rang e o f figures , th e media n an d th e percentag e o f th e norma l median , fo r eac h group . Th e group s wer e classifie d clinicall y befor e th e result s o f th e tes t wer e known . Al l figure s ar e reduce d t o term s o f surfac e are a exceptin g th e venou s pressure , th e appearanc e tim e an d th e volum e clearanc e index ; thi s applie s als o t o tabl e 2 an d t o th e figures
. TT
, Decompensate d Norma l ^n^ed " j 1 Compensate d 4 2 case s 1 5 case s Sligh t Moderat e Sever e 2 1 case s 18 case s 7 case s 1 5 case s Ex - Me - Ex - Me - Ex - Me - Ex - Me - Ex - Me - Ex - Me -treme s dia n treme s dia n treme s dia n treme s dia n trerrie s dia n treme s dia n Venou s Pressur e (V . P. ) (mm. ) ". . . 2 0 7 5 3 0 11 3 5 6 15 6 18 4 18 7 20 3 24 0 1 5 7 0 15 0 (100% ) 20 3 (151% ) 27 5 (208% ) 25 0 (249% ) 26 1 (320% ) 16 5 (93% ) Vita l Capacit y (V . C. ) (L. ) 1.3 5 2.3 1 0.7 2 1.4 1 0.7 8 1.2 0 0.4 6 0.9 4 0.3 7 0.7 1 0.5 7 1.5 2 3.0 1 (100% ) 2.4 2 (61% ) 2.3 1 (52% ) 1.3 6 (41% ) 1.5 4 (31% ) 2.5 2 (66% ) Appearanc e Tim e (A . T . o r P . C.T. ) (Sec. ) 5. 7 12. 0 6. 2 13. 6 13. 5 25. 1 9. 5 32. 1 13. 5 33. 3 11. 1 22. 8 26. 0 (100% ) 20. 0 (113% ) 48. 3 (209% ) 54. 5 (267% ) 49. 0 (277% ) 36. 1 (190% ) Cardia c Outpu t (F ) (L/min. ) 2.3 7 3.8 9 2.0 1 3.4 6 1.4 1 1.9 3 1.2 5 2.0 4 1.0 7 1.4 2 1.4 9 2.5 7 5.5 9 (100% ) 6.8 8 (89% ) 3.9 9 (50% ) 2.9 7 (52% ) 3.2 0 (37% ) 5.4 8 (66% ) Strok e Volum e (S . V. ) (c.c. ) 23. 0 46. 5 18. 6 43. 0 16. 3 21. 4 11. 2 22. 0 11. 3 14. 3 19. 3 33. 5 70. 7 (100% ) 74. 0 (92% ) 36. 6 (46% ) 26. 0 (47% ) 33. 0 (31% ) 60. 0 (72% ) Volum e o f Bloo d i n Hear t an d Lung s (V ) (L. ) 1.0 7 1.4 5 0.9 9 1.3 6 1.1 0 1.5 7 1.0 0 1.6 4 1.2 5 1.6 1 1.0 9 1.9 4 2.1 5 (100% ) 2.8 5 (94% ) 2.1 7 (108% ) 2.5 7 (113% ) 2.4 1 (111% ) 2.4 5 (134% ) Tota l Bloo d Volum e (B . V. ) (L. ) 1.8 9 2.4 0 1.7 7 2.4 2 1.9 3 2.5 0 1.6 3 2.6 6 2.2 0 2.5 9 1.9 4 2.8 9 3.2 5 (100% ) 2.7 5 (101% ) 3.3 4 (104% ) 3.3 1 (111% ) 3.0 4 (108% ) 3.4 2 (120% ) Volum e Clearanc e Inde x (V . C . I. ) (Hear t Beats ) 18. 9 33. 0 19. 0 42. 8 29. 2 77. 4 40. 5 92. 9 37. 8 100. 1 28. 7 46. 9 69. 7 (100% ) 71. 6 (130% ) 133. 1 (235% ) 157. 0 (282% ) 172. 0 (303% ) 127. 0 (142% ) Hear t Wor k (W ) (Kgm . M. ) 241 0 516 5 534 0 866 5 253 0 417 5 274 0 397 0 195 0 295 5 291 5 424 5 843 0 (100% ) 1628 0 (168% ) 632 0 (81% ) 695 0 (77% ) 478 5 (57% ) 828 5 (82% ) Hear t Wor k pe r Bea t (W B ) (Kgm . M. ) . . 29. 0 63. 0 40. 6 104. 8 28. 1 47. 1 17. 9 43. 2 20. 5 28. 7 35. 8 65. 6 96. 2 (100% ) 175. 0 (182% ) 83. 0 (75% ) 64. 4 (69% ) 80. 7 (46% ) 112. 4 (104% )
The venous pressure rises and the vital capacity falls (both long known by clinical observation) ; the rate of blood flow slows, as shown by the increased appearance time; the cardiac output and the stroke volume both decrease to only one-half of the normal value, while at the same time the number of heart beats required to clear the heart and lungs of actively circulating blood (volume clearance index) becomes more than doubled. The work of the heart becomes reduced, not only to normal but below it, in spite of little alteration in blood pressure.
As congestive failure increases, the changes in these functions become progressively more and more marked. When decompensation has become very severe, the venous pressure has risen to more than three times the normal level and the vital capacity fallen to one-third of normal; the blood is flowing only about one-third as rapidly as before congestion appeared; the cardiac output and the stroke volume have become reduced to about one-third of the normal figure, while it now requires three times the normal number of beats to clear the heart and lungs of blood; and the heart work has been reduced to one-half of its normal value.
When compensation again becomes fully established, as a result of ap-propriate therapeutic measures, very interesting changes occur. As can be observed clinically, the venous pressure returns to normal, but the vital capacity does not, remaining instead at a level approximately one-third below. The rate of blood flow increases, but does not even approach the normal velocity, remaining about one-half as rapid as normal. Neither do the cardiac output and stroke volume return to normal, but remain at about two-thirds of the normal value. The number of heart beats required to clear the heart and lungs of blood also remains increased at more than 40 per cent above the normal figure. The heart work, however, again becomes normal or nearly so though it does not reach the level it did before heart failure set in.
We stated earlier in the paper that we also measured the total actively circulating blood volume and the volume of actively circulating blood in the heart and lungs and great vessels. The changes in these functions are not particularly marked, as may be seen by a study of table 1 and figure 2. It is very interesting, however, that the changes which do occur are strik-ingly parallel for the two. In general, it may be said that before congestive failure develops, there is no essential change in either; as congestion de-velops they both increase, becoming slightly greater as congestion increases. As compensation becomes reestablished, they increase greatly and signifi-cantly (to 134 per cent and 120 per cent respectively, of the normal value).
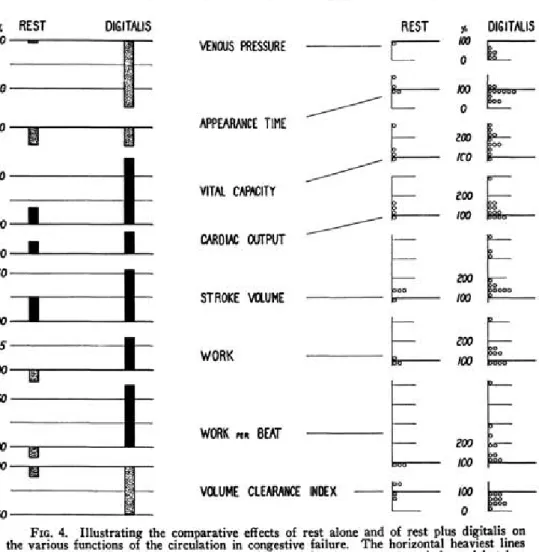
A comparison was made in these cases between the effects of rest alone and rest plus digitalis on these various functions. The result of this ap-pears in figure 4 and table 2. It will be noted that, although rest alone produces a change toward normal in all of the functions, yet this change is not nearly as striking as occurred after digitalis was administered. Many
656 J . MURRAY KINSMAN AND J O H N WALKER MOORE
FIG. 4. Illustrating the comparative effects of rest alone and of rest plus digitalis on the various functions of the circulation in congestive failure. The horizontal heaviest lines represent the previous (decompensated) median level for the group as a whole, and is taken as 100 per cent. The height or depth of the bars represents the percentage change from that previous level. The medians are taken in all instances. The right half of the figure shows the distribution of the percentile changes from the decompensated levels, each circle repre-senting, as in figure 2, an individual case, and the changes being divided into zones. of these patients had bed rest for as long as two weeks between the deter-minations, giving the circulation ample opportunity to readjust itself with-out help, if it could do so. The right-hand side of figure 2 represents the distribution of the individual cases in regard to the various functions out-lined.
DISCUSSION
The observations reported here, concerning many of the functions of the circulation, are not new. The progressive increase in venous pressure and decrease in vital capacity as congestive failure develops have been known clinically for many years. The slowing of the blood flow under these conditions has been assumed for a long time and was demonstrated
con-clusively by Blumgart and by ourselves as far back as 1927.2 So, too, observations concerning the cardiac output, unreliable though they are con-sidered by some, have been in keeping with our own. But we feel that a correlated picture of all of these functions, observed in a series of cases large enough to be considered of significance, can give us a more complete picture of what happens to the circulation as a whole, than grouping to-gether observations on one or only a few of the many functions of the cir-culation. This assumes especial significance when we consider variations in individual cases. A perusal of figure 2 will illustrate this to some extent by the evidence of overlapping of results shown there. It must be remem-bered that we have dealt here with groups, showing the tendencies exhibited by such groups as a whole. But it must not be assumed that each individual case behaves always as the group characteristically does.
For example, in four cases picked from the severely decompensated group (see table 3), case 161 with the lowest vital capacity of all. had the quickest appearance time and the highest output; whereas case 182, with a vital capacity nearly three times as great, had the slowest appearance time and the lowest output, though the venous pressure was the same in both cases; and case 90 with the highest vital capacitv of all, had an appearance time and an output intermediate in position. Thus throughout all of our observations we encounter many variations, where sometimes, for example, the flow may be normal and the velocity of blood flow decreased, or vice versa. Therefore, it is apparent that not the observation of one or two or three functions only, but the measurement of all of them simultaneously will give us the true picture of the circulatory state in any given individual.
Starr8 has shown that in normal persons there is a linear relationship (within limits) between heart work and heart volume; that as the heart volume increases the heart work increases also; whereas in congestive failure the increase in heart volume and the decrease in heart work throw this re-lationship outside the normal zone. We have taken teleroentgenograms on most of our patients, and although we have not yet analyzed the results, it is apparent that the coordinates of work plotted against volume are far outside the normal zone. In this respect our results agree perfectly with those of Starr, although his method of determining heart work is based on rebreathing.
The lack of marked changes in the volume of blood in the heart, lungs and great vessels might cause one to assume that our method of measuring this factor was at fault since it is obvious from both clinical and postmortem experience that the lungs and great vessels do become engorged with blood as congestive failure develops. However, it must be borne in mind that we are measuring only the actively circulating blood, and that stagnant blood is not accounted for. Though the change is not great, there is a decided ten-dency for even the actively circulating blood in the heart, lungs, etc. to be-come increased as congestion develops; moreover, the changes in the volume
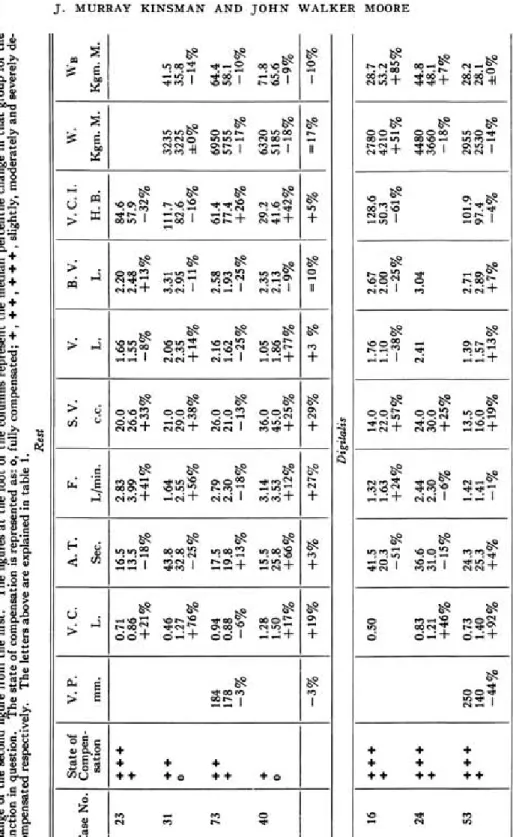
6 5 8 J . MURRAY KINSMAN AND J O H N WALKER MOORE TABL E I I Th e effect s o f res t alon e an d o f res t plu s digitali s upo n th e variou s cardia c function s studied . I n eac h grou p o f thre e figures , th e firs t represent s th e figur e obtaine d whe n firs t tested , whil e decompensated , th e secon d th e figur e a t a late r date , afte r res t o r digitalis , an d th e thir d th e percentil e chang e o f th e secon d figur e fro m th e first . Th e figure s a t th e foo t o f th e column s represen t th e media n percentil e chang e i n tha t grou p fo r the functio n i n question . Th e stat e o f compensatio n i s represente d as : o , full y compensated ; + , + + , + + + , slightly , moderatel y an d severel y de -compensate d respectively . Th e letter s abov e ar e explaine d i n tabl e 1
. Rest
Stat e o f V . P . V . C . A . T . F . S . V . V . B . V . V.C.I . W . | W B Cas e No . Compen -satio n mm . L . Sec . L/min . c.c . L . L . H . B . Kgm . M . Kgm . M . 2 3 + + + 0.7 1 16. 5 2.8 3 20. 0 1.6 6 2.2 0 84. 6 + 0.8 6 13. 5 3.9 9 26. 6 1.5 5 2.4 8 57. 9 +21 % -18 % +41 % +33 % -8 % +13 % -32 % 3 1 + + 0.4 6 43. 8 1.6 4 21. 0 2.0 6 3.3 1 111. 7 323 5 41. 5 o 1.2 7 32. 8 2.5 5 29. 0 2.3 5 2.9 5 82. 6 322 5 35. 8 + 76 % -25 % +56 % +38 % +14 % -11 % -16 % ±0 % -14 % 7 3 + + 18 4 0.9 4 17. 5 2.7 9 26. 0 2.1 6 2.5 8 61. 4 695 0 64. 4 + 17 8 0.8 8 19. 8 2.3 0 21. 0 1.6 2 1.9 3 77. 4 575 5 58. 1 J -3 % -6 % +13 % -18 % -13 % -25 % -25 % +26 % -17 % -10 % 4 0 + 1.2 8 15. 5 3.1 4 36. 0 1.0 5 2.3 5 29. 2 632 0 71. 8 o 1.5 0 25. 8 3.5 3 45. 0 1.8 6 2.1 3 41. 6 518 5 65. 6 + 17 % +66 % +12 % +25 % +77 % -9 % +42 % -18 % -9 % -3 % J +19 % +3 % +27 % +29 % + 3 % =10 % I +5 % =17 % -10 % Digitalis 16 + + + 0.5 0 41. 5 1.3 2 14. 0 1.7 6 2.6 7 128. 6 278 0 28. 7 + 20. 3 1.6 3 22. 0 1.1 0 2.0 0 50. 3 421 0 53. 2 -51 % +24 % +57 % -38 % -25 % -61 % +51 % +85 % 2 4 + + + 0.8 3 36. 6 2.4 4 24. 0 2.4 1 3.0 4 448 0 44. 8 + 1.2 1 31. 0 2.3 0 30. 0 366 0 48. 1 +46 % -15 % -6 % +25 % -18 % +7 % 5 3 + + +
25 °
°-7 3 24. 3 1.4 2 13. 5 1.3 9 2.7 1 101. 9 295 5 28. 2 + 14 0 1.4 0 25. 3 1.4 1 16. 0 1.5 7 2.8 9 97. 4 253 0 28. 1 -44 % +92 % +4 % -1 % +19 % +13 % +7 % -4 % -14 % ±0 %
11-^
f ^ f ^ ^ f $S
CN<X>2 "1^.3 *°.°.^ "i^cs ^ . R S ° i ° i 3 *i °.S
" ^ o 6 _ l _ *** ON i O f C X © ON J _ CO PC _1_ *>^CS_|_ o d t ^ J _
( S V O T N f O T CS ON 1 « O K ) T - ^ 00 ~ T *H Tp I PO T * 1
+
w
.
Kgm
. M
.
270
5
378
5
+40
%
297
0
291
5
-2
%
195
0
641
5
+220
%
244
0
330
0
+35
%
397
0
514
5
+30
%
200
5
330
5
+65
%
457
0
409
0
+33
%
V
. C
. I
.
H
. B
.
^ t 8 t t f t CM*^.S Cs' . £ - 1 ^ . S OO^K < * « 3 ^ H I O | - ^ O | f » 0 0 1 T - i r o | T J < I O I T * C O 1 t ^ " « ^ |
* H I O 1 ON ^< ' *-• CN 1 H Q \ 1 t>. ^ 1 ^ H NO 1 » 0 CO 1 -50
%
r
J
ro»oi^ ^»o!2 o ^ S ^ ^ — ooH ^"^JC ^ ^ ^ ^ ^ S ^ ^ S qpor^ t ^ . 7 i/?°.*2. ^ ^ 7 ^ ^ 7 *^°i*7 tH. 2 ^ ^ . 7 t * i j _pf> po + CM* CM 1 cs cr> + CM CM* 1 CM" CM* 1 CM* CM* + CM* PO" + CM* CM* 1 CM* PO +
**•
+
> J
N \ O S "^osS ^ ^ " " ^ oo^lS C M O ® ^"^S) "^^S* ^ ^ ^ ^ ^ ^ ^^H* CM + ,-<»-* 1 ^ * ,-J 1 ,_* CM + H H 1 ,_IcsJ+ ^»-H +
g5
+
—
Continue
d
gitalis
S.V
.
c.c
.
q o g j r o q g c o o o ^ o o ^ § © o j g C M P O ^ N q o g 0 0 5 T H O O ^ PO CM 1 ^ r - » i T - I >o 1 \ 0 » 0 _ L CM CM _ i _ *-• 0 0 _ i _ v O * O j _ ON PO j _ * H 0 0 _|_
_ ( T t r T H N T _ | « « ^ - r _ I C M 1 CMPO 1 r H f ^ T C M T * T ^ «-• fS) T CMCM 1 +53
%
TABL
E
I
]
EH
F
.
L/min
.
P O < N ^ * o ^ o f ^ t ^ p o g I O H « " * o \ ^ > o ^ 2 O N O O S ; ^ 2 * ^ S 2 £ r £ . 10/0*2 "1°.*? 0 * 1 5 . ^ " - i !0. ° . ° i ^ N ^ J V ° } * t j i ci ° i 7 ^ ^ 1 1 ^H* CM* + ^H CM* + ,-* PO + ,-* CM' + c4 *-* ' ,-* ,-J + pfj li") + CM* *-" • ,-" CM* +
+22
%
A.T
.
Sec
.
csoo^ O N © * ^ . S °i°°.8 'i^-.S ^ . ^ . 2 ^ ^ . 2 ^.°^S ® ^ S P O * - H ' | O O v O l « ^ " * | I O 0 0 I M ' w i 1 CM* NO* _1_ P f J ^ I > O ^ H | 00* TJ* I C O P O • -^H *-H « r^ *-i • PC CM 1 POCM • POPO 1 * H * H 1 •<* CM 1 ^ PO 1
O N
7
r
v o ^ ^ ^ ^ fcP fc? fc8
© ^ ON » 0 O O j s P O O v S ^ © ^ © ^
P O I O ^ < o ^ 2 ™<x>I"! ^ ^ 2 o o ^ S ^ ^ ^ 2 ^ ^ S ^ 2 S 2 ^ N
^HOOY " ^ ^ 7 ONOvT1 IOCS'-1 ^ ^ ^ O M O * 7 O0^ ^ . POCO^° 0 0 O \ ^
H ^ + 0 ^H + 0 ^ + 0 ^ ' + ^ ' ^ 1 0 CN + 0 ^ + ^ cs ~r 0 0 T"
+68
%
> s
t^. PO O N « ^ O NO O O N ^ O i o _ ^ t * » ^ 0 I P O I O 1 o o t ^ I *^"<h I
CS t ^ 1 CS »-< 1 * H l O • CN NO 1
O N NO
1
Stat
e o
f
Compen
-satio
n
+ + + +
+ + + + + +
+ 0 + 0 + 0 + 0 + + + 0 + 0 + 0 + 0
Cas
e No
.
i O t - * P O » 0 0 0 « S P O O O O
6 6 0 J. MURRAY KINSMAN AND JOHN WALKER MOORE TABLE III
Data of four cases chosen from the 15 cases in the severe congestive failure group, to illustrate the wide variation in individual functions of the circulation and to emphasize that one must take into consideration all of the functions and not one or two individual ones in order to determine the true state of the circulation.
Case No. V. P. V. C. A. T. F. S. V. 161 203 0.37 13.5 3.20 33.0
84 0.50 41.5 1.32 14.0 182 210 0.92 47.7 1.07 11.3 90 1.54 27.0 1.88 20.0 of blood in the heart, lungs and great vessels are greater than the changes in total blood volume, indicating in this fact alone, a tendency for the blood to accumulate in the thorax and abdomen. The increase after compensation becomes reestablished indicates that there must be liberated into the blood stream considerable quantities of blood previously stagnant and out of cir-culation. It follows also that the term " volume clearance index " indicates the number of heart beats required to clear the heart and lungs of actively circulating blood.
One other feature should be emphasized: It is an important fact that when compensation becomes reestablished after congestive failure has once developed, certain of the functions of the circulation do not return to normal, notably the velocity of blood flow and the cardiac output. It may be stated in another fashion, that once heart failure has developed, the heart may never be the same again.
SUMMARY
1. Using the dye injection method, the various functions of the cir-culation were studied in cases of hypertension before congestive failure had developed, when congestion had appeared and when compensation had be-come reestablished.
2. The changes in venous pressure, vital capacity, appearance time (velocity of blood flow), cardiac output, stroke volume, volume of actively circulating blood in the heart, lungs and great vessels, total blood volume, volume clearance index (the number of heart beats required to clear the heart, lungs and great vessels of actively circulating blood), work and work per beat are reported and discussed.
3. The relative effects of rest alone and of rest plus digitalis are reported. 4. Emphasis is laid upon the fact that even in severe heart failure certain of the functions, as the flow, for example, may be within normal limits, and that only by a study of the interrelationships of all of the functions con-cerned can a true picture of the cardiac hemodynamics be obtained.
BIBLIOGRAPHY
1. HAMILTON, W. F., MOORE, J. W., KINSMAN, J. M., and SPURLING, R. G.: Simultaneous determination of pulmonary and systemic circulation times in man, and of a figure re-lated to cardiac output, Am. Jr. Physiol., 1928, lxxxiv, 338-344.
KINSMAN, J. M., MOORE, J. W., and HAMILTON, W. F.: Studies on circulation. I. In-jection method; physical and mathematical considerations, Am. Jr. Physiol., 1929, lxxxix, 322-330.
MOORE, J. W., KINSMAN, J. M., HAMILTON, W. F., and SPURLING, R. G.: Studies on cir-culation. II. Cardiac output determinations; comparison of injection method with direct Fick procedure, Am. Jr. Physiol., 1929, lxxxix, 331-339.
MOORE, J. W., HAMILTON, W. F., KINSMAN, J. M., and SPURLING, R. G.: Studies on cir-culation. III. Description of injection method of studying circulation, with some clini-cal applications, Southern Med. Jr., 1930, xxiii, 1131-1135.
HAMILTON, W. F., MOORE, J. W., KINSMAN, J. M., and SPURLING, R. G.: Studies on cir-culation. IV. Further analysis of injection method, and of changes in hemodynamics under physiological and pathological conditions, Am. Jr. Physiol., 1932, xcix, 534-551. 2. BLUMGART, H. L., WEISS, S., and YENS, O. C.: Studies on velocity of blood flow, Jr. Clin.
Invest, 1927 iv, 1-13, 15-31.
3. STARR, I., JR., and OTHERS : Studies of heart and circulation in disease; estimations of basal cardiac output, metabolism, heart size and blood pressure in 235 subjects, Jr. Clin. Invest., 1934, xiii, 561-592.