MICROCT AND PREPARATION OF ß-TCP GRANULAR MATERIAL BY
THE POLYURETHANE FOAM METHOD
R
OBERTF
ILMON, N
ADINER
ETAILLEAU-G
ABORIT,
G
UENAELLEB
ROSSARD,
F
LORENCEG
RIZON-P
ASCARETTI,
M
ICHELF
ELIXB
ASLE ANDD
ANIELC
HAPPARDINSERM, U 922 –LHEA, Faculté de Médecine, 49045 ANGERS Cedex – FRANCE e-mail: [email protected]
(Accepted February 27, 2009)
ABSTRACT
Commercial ß-tricalcium phosphate (ß-TCP) is commercialy available in granules manufactured by sintering of powders. We have evaluated the different steps of the manufacturing process of ß-TCP ceramics granules prepared from blocks obtained with the polyurethane foam technology. Three types of slurry were prepared with 10, 15 and 25 g of ß-TCP per gram of polyurethane foam. Analysis was done by scanning electron microscopy, EDX, Raman spectroscopy and microcomputed tomography combined with image analysis. A special algorithm was used to identify the internal microporosity (created by the calcination of the foam) from the internal macroporosity due to the spatial repartition of the material. The low ß-TCP dosages readily infiltrated the foam and the slurry was deposited along the polymer rods. On the contrary, the highest concentration produced inhomogeneous infiltrated blocks and foam cavities appeared completely filled in some areas. 2D microcomputed sections and reconstructed 3D models evidenced this phenomenon and the frequency distribution of the thickness and separation of material trabeculae confirmed the heterogeneity of the distribution. When crushed, blocks prepared with the 25 g slurry provided the largest and irregular granulates.
Keywords: ß-TCP, bone histomorphometry, bone substitute, microCT, tricalcium phosphate.
INTRODUCTION
Tri calcium phosphate (ß-TCP) has been recognized as a suitable ceramic material with bioactive properties since several decades (Jarcho, 1981; Driessen et al., 1982; Daculsi et al., 2003). TCP is a highly resorbable material that can be prepared in various conditions. Macroporous blocks can be used in orthopedics and granules are preferred in dentistry and maxillofacial surgery for filling small bone defects such as alveolar sockets after tooth extraction or for sinus lift elevation. A large number of papers have been published concerning the fabrication of TCP scaffolds or granules. For preparing granules, crushing of sintered blocks, dipping or stirring in a variety of non-miscible liquids, mixing with porogen beads have been proposed (Aokia et al., 2003; Bohner et al., 2005; Hsu et al., 2007). An interesting method is the use of polyurethane foam to prepare 3D scaffolds that are sintered and crushed in a second time. Several commercial processes are available but the different steps of the full process have not been fully analyzed. The method was originally proposed by Schwartzwalder and Somers and has been used in a number of patents for preparing different types of porous biomaterials
(Schwartzwalder et al., 1963). Briefly, a polymeric foam is used as a template and filled with a ceramic slurry; the composite adheres onto the surface of the foam and this creates macroporosity. The composite is then submitted to heat-treatment at an elevated temperature to remove the polymeric template and to sinter the ceramic coating layer (Schwartzwalder et al., 1963; Peng et al., 2000; Zhu et al., 2002). The polymer foam is thus destroyed and leaves small internal voids (microporosity).
et al., 2005; Hiu-Yan et al., 2005; Mathieu et al., 2006). The method is also well adapted to phospho-calcic or polymer bone substitutes and can be used to follow their bioerosion and their osteoconduction properties (Ruhe et al., 2003; Blouin et al., 2006). The aims of the present study were to characterize the different steps of the preparation of ß-TCP granules by the polyurethane foam method by scanning electron microscopy and microCT. Stacks of microCT images were transferred to an image analyzer to determine the macro and microporosity in search of the best amount of ceramic to add into the slurry.
MATERIAL AND METHODS
Blocks of ß-TCP were prepared by the foam method by using a commercial polyurethane template. ß-TCP was purchased from Kasios (Launaguet – France). The sequence of operations for preparing sintered calcium-phosphate materials is based on previous works presented in the literature (Schwartzwalder et al., 1963; Peng et al., 2000; Zhu et al., 2002). Three different volume fractions were investigated: 10 g, 15 g and 25 g of ß-TCP were mixed with distilled water to produce slurries which were used to substantially impregnate 1 g of the polyurethane foam under vacuum. These materials will be refered here after as the 10 g, 15 g and 25 g series. This ensured that the ceramic coated the polyurethane walls to produce a replica of the reticulated foam material, the ceramic parts of the biomaterial being centered by the polymer.
The blocks of polyurethane impregnated with the slurry were then dried in an oven and then heated in a furnace oven at 800 °C; this led to a complete burn of the organic polyurethane foam. The 3D scaffold of ß-TCP were then sintered at a temperature > 1200 °C and small blocks (approximately 3 x 3 mm cubes were prepared). Granules were obtained by crushing the blocks in an alumina mortar.
CHARACTERIZATION OF THE
ß
-TCP
MATERIAL
– Raman analysis was performed on a Senterra microscope with the OPUS 5.5 software (BRUKER OPTIK – Ettlingen). The excitation laser wave length was 532 nm. The long working distance of the 20X microscope objective gave a spot size in the order of five micrometers. The final spectrum of each spot was the average of four scans. An automatic baseline correction was applied. Values from peak intensities and bandwidths of peak
recorded spectrum were used as described in the literature using the vendor-supplied scripts.
– Scanning electron microscopy (SEM) and EDX analysis.
Blocks of pure polyurethane foam, foam impregnated with ß-TCP slurry, sintered ß-TCP and ß-TCP granules were examined by SEM after having being carbon-coated (10 nm thick) with a MED 020 (Bal-Tec, Balzers, Liechtenstein). SEM was performed on a JEOL 6301F (Jeol France Paris) field emission microscope equipped with an energy dispersive X-ray microanalysis machine (EDX-Link ISIS- Oxford). EDX was done by point analysis at the surface of the material to determine its composition. Grain size was determined on SEM images with the Image J software (NIH).
MICROTOMOGRAPHY ANALYSIS
(MICROCT)
The Skyscan 1072 X-ray computed microtomo-graph (Skyscan - Kontich, Belgium) was used in the cone beam acquisition mode. The system is composed of a sealed microfocus X-ray tube, air cooled with a spot size less than 8 µm and a CCD camera. Images were obtained at 80 kV and 100 µA with a 1 mm aluminum filter each time the ß-TCP material was present in the specimen, the pixel size was 6.66 µm. For the analysis of the polyurethane foam, the acquisition constants were 40 kV and 87 µA without aluminum filter. Specimens were directly fixed with plasticine on the brass stub of the microCT. For each specimen, a series of 400 projection images were obtained with a rotation of 0.45° between each image. The magnification used produced images with a highly precise resolution with a voxel size of 6.66 µm on side. Given a series of projection images, a stack of 2D sections was reconstructed for each specimen and stored in the bmp format with indexed grey levels ranging from 0 (black) to 255 (white).
SOFTWARES FOR 3D
RECONSTRUCTION AND IMAGING
material covered the polyurethane template and formed trabecular-like structures, the material scaffold characteristics were measured alike trabecular bone: trabecular material thickness (Tb.Th, in µm), number (Tb.N, in mm-1) and separation (Tb.Sp, in µm).
These parameters were derived from the frequency distribution of thickness obtained with the sphere algorithm described by Hildebrand (Hildebrand; Ruegsegger, 1997). Briefly the diameter of non-overlapping spheres filling the material trabeculae is computed and the mean trabecular thickness is calculated as:
Tb.Th = Σa. P(a),
where P(a) is the frequency of sphere diameters in the class a. Mean trabecular separation (Tb.Sp) was measured in a similar way by fitting non-overlapping spheres of maximal diameter to a 3D model of the void spaces (macroporosity), the frequency distribution of the values was also recorded to study the homogeneity of the material disposition (Chappard et al., 2005; 2007). Trabecular pattern factor (Tb.Pf)
which quantifies the connectivity of the material scaffold was also determined. This index is negative in highly connected networks.
IMAGE ANALYSIS
For imaging of the internal microporosity of the ß-TCP left in void by the calcination of the polyurethane polymer, the 2D stacks of images were transferred to a Leica Q 550 image analyzer and a Quips program was written to automatically select the internal voids by an algorithm using conditional image closings. Listing of the routine is as follows:
For (I = FIRST to LAST, step 1)’ for the first to last image of the stack
ACQFILE$ = image$(I) ACQOUTPUT = 0
Read image (from file ACQFILE$ into ACQOUTPUT)
Grey Transform (WTopHat from Image0 to Image1, cycles 4, operator Disc) Grey Arithmetic (C = A+B : C
Image2, A Image0, B Image1)
Grey Transform (BTopHat from Image0 to Image3, cycles 6, operator Disc) Grey Arithmetic (C = A-B : C
Image4, A Image2, B Image3) DETIMAGE = 4
DETBINARY = 0
Detect (whiter than DETUPPER, from DETIMAGE into DETBINARY )
Binary Amend (Close from Binary0 to Binary1, cycles 12, operator Disc, edge erode on)
Binary Logical (C = A XOR B : C Binary2, A Binary0, B Binary1)
Binary Identify (Spots from Binary2 to Binary3)
Measure feature (plane Binary3, 64 ferets, minimum area: 7, grey image: Image0)
Selected parameters: Area, X FCP, Y FCP
Copy Accepted Features (from Binary3 into Binary4)
Binary Identify (Outline from Binary1 to Binary10)
Binary Amend (Dilate from Binary10 to Binary9, cycles 1, operator Disc, edge erode on)
Binary Logical (C = A AND B : C Binary11, A Binary4, B Binary9) Binary Logical (C = A OR B : C Binary12, A Binary0, B Binary11)
Binary Logical (C = A XOR B : C Binary2, A Binary11, B Binary4) Binary to Grey (Copy Binary2 to bit 7 of Image5) ’ microporosity
Binary to Grey (Copy Binary12 to bit 7 of Image6)’ material
ACQOUTPUT = 6
ACQFILE$ = "material_"+ (I) +".bmp" Write image (from ACQOUTPUT into file ACQFILE$, export calibration) ACQOUTPUT = 5
ACQFILE$ = "hole_"+ (I) +".bmp" Write image (from ACQOUTPUT into file ACQFILE$, export calibration)
Next (I)
In this way, two new stacks of 2D images binary images were produced for each specimen in whom the calcium-phosphate material was given a pixel value of 0, the internal microporosity 100 and the macroporosity and surrounding volume of 255.
make the virtual models semi-transparent. Because different 3D models can be reconstructed and made visible simultaneously (thus offering the possibility to combine several images), this possibility was used to visualize the calcium-phosphate material (with a semi-transparent rendering) and the internal voids by overlaying two different models.
STATISTICAL ANALYSIS
Statistical study was performed using SYSTAT Release 11 (Systat Software, Inc., San Jose, CA). Data were expressed as mean ± standard deviation. Differences between the series were searched with a non parametric ANOVA. When differences existed, the Scheffé's post-hoc test was used. The histogram frequency of Tb.Th and Tb.Sp were computed by pooling the data from six blocks randomly selected of each formulation. Determination of equations was computed with TableCurve (Systat Software) and the best fit value was retained (the equation numbers provided by the software are provided).
RESULTS
CHARACTERISATION OF THE FOAM
TEMPLATE
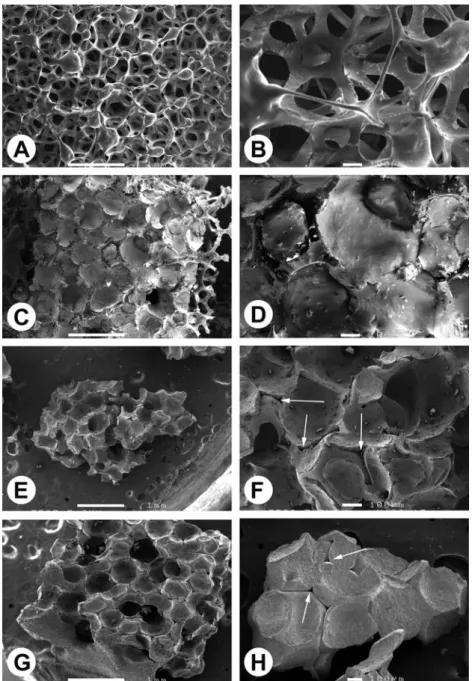
The polyurethane foam could be easily observed under SEM and appeared composed of pores and polymer struts. The webs of the foam were well connected and composed of thin rods with occasional minute plates (Figs. 1A, B). The mean pore size was about µm and the mean thickness of the polymer struts was 27 ± 4 µm.
INFILTRATION WITH ß-TCP SLURRY
Fig. 1C illustrates a block of polyurethane foam filled with a 25 g slurry of ß-TCP. Although infiltration was done under vacuum, it is likely that it was not homogeneous. SEM at higher magnification visualized at the same time the foam and the raw calcium-phosphate coating (Fig. 1D). Blocks of 10
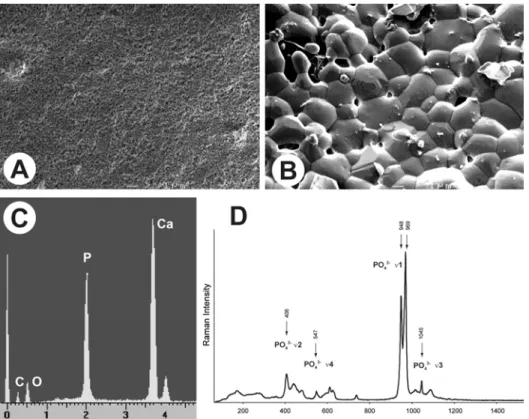
and 15 g of sintered β-TCP were brittle and difficult to mount on the SEM stubs due to poor mechanical resistance. They frequently crushed and granules were affixed to a carbon tape used for immobilization and electron conduction (Fig. 1E). At higher magnification, the material appeared composed of large round cavities but internal voids, (created by the disappearance of the polymer foam) were observed (Fig. 1F). Blocks of 25g of sintered β-TCP were somewhat less brittle and could easily be observed (Fig. 1G). Granules prepared from these blocks were very similar although larger and the internal voids were also evidenced (Fig. 1E). The surface of the calcium-phosphate round cavities considerably changed during the sintering process. The micro-structure features showed a conversion of an amorphous micro granular surface before sintering (Fig. 2A) to a regular paving composed of geometric tiles with a rounded top (Fig. 2B). EDX analysis confirmed that only phosphate and calcium were present in the samples (Fig. 2C) and Raman spectra evidenced the different peaks of phosphates at 406 cm-1 for the ν2
band, 547cm-1 for the ν4, 948-969 cm-1 for ν1 and
1045 cm-1 for the ν3 band (Fig. 2D).
MICROCOMPUTED TOMOGRAPHY
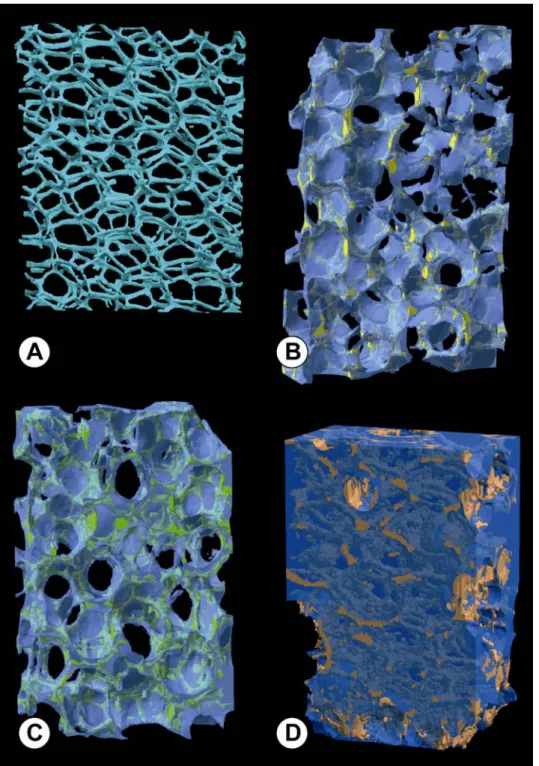
MicroCT 2D sections evidenced a delicate honeycomb like network of thin polymer trabeculae (Fig. 3A) when low acquisition parameters were used with the microCT. When the calcium-phosphate material has been used to infiltrate the foam, high energy X-rays were used and the polymer material was radiolucent. No difference was noticeable between raw and sintered blocks with microCT. The
Fig. 2. Scanning electron microscopic analysis of the β-TCP material prepared by the foam technology at different steps. A) before sintering; B) after sintering. C) EDX analysis; D) Raman micro spectroscopic analysis of the β-TCP material.
Fig. 3. Microcomputed tomography (microCT), 2D sections of: A) the polyurethane foam; B) the sintered material prepared with the 10 g slurry; C) with 15 g; D) with 25 g. In each case, note the voids in the center of the trabeculae due to pyrolysis of polyurethane (microporosity) and the large circular holes corresponding to macroporosity. Note the irregular repartition of the material in the 25 g sample.
3D reconstructions confirmed the 2D findings. The polyurethane network could easily be recon-structed and appeared as a delicate network of thin rods highly interconnected (Fig. 4A) but the small plates observed by SEM were not evidenced. The 3D reconstructions with two over imposed models appear
Fig. 4. Micro computed tomography (microCT), 3D models of: A) the polyurethane foam; B) the sintered material prepared with the 10 g slurry; C) with 15 g; D) with 25 g. In each case, the internal porosity due to pyrolysis of polyurethane has been reconstructed in a colored model; the β-TCP material in a semi-transparent blue model.
The histomorphometric results appear on table I. As expected, the MatV/TV increased as a function of the amount of β-TCP used in the slurry. However the standard deviations were considerably increased for all parameters with this formulation, meaning that the material repartition was not uniform in the different blocks. The thickness of the material trabeculae also
increased significantly when the concentration increased in the slurry but the number of trabeculae did not vary between 10 and 15 g. Connectivity of the trabeculae was considerably increased in the 25 g as shown by the very negative value of Tb.Pf.
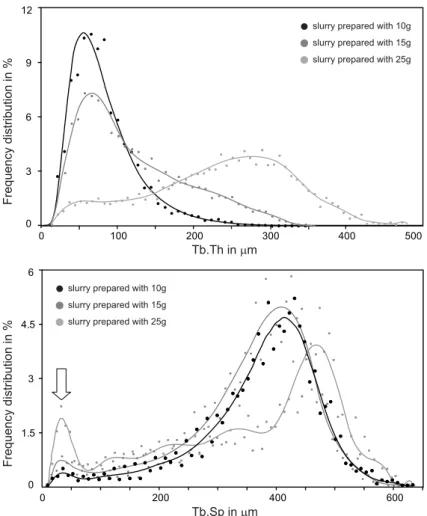
morphometric findings. A lognormal distribution was found to best describe the Tb.Th data in the 10 and 15 g groups with r2 = 0.975 and 0.96 respectively
(equation ref. # 8005, lognormal a, b, c, d). For the 25 g series, the log normalcy was not respected and a more complex function (Fourier series polynomial 9 x 2, ref. # 6849) provided the best fit with r2 = 0.974. On this last function, it appears that most β-TCP deposits were large blocks filling the polyurethane template. Similar findings were obtained from the Tb.Sp distributions. The 10 and 15 g series were roughly similar with a peak centered on ~400 µm. With 25 g, the curve was very complex with a polynomial order 17 regression curve (ref. # 6067) provided by the TableCurve software. It should be noticed that on the 3 curves, a small peak was observed at ~25 µm and corresponded to the internal microporosity created by the voids left by the elimination of polyurethane (Fig. 5B).
The mean size of the grains obtained by crushing (without filtration) also evidenced differences: grains obtained with the 15 g formulation were somewhat, but significantly larger than those prepared with 10 g. On the other hand, the 25 g series led to the largest granules.
DISCUSSION
The optimal fabrication techniques must be available and extensively studied to prepare porous materials or granules for calcium-phosphate ceramics suitable for repairing damaged bone. A number of studies have suggested that pores in the range of 100-1000 µm are the most suitable to prepare large blocks (Gauthier et al., 1998; Lu et al., 1999; Bohner et al., 2005). However when preparing granular materials, this parameter may appear not important since the sintered final product is crushed. In the present study, three formulations of β-TCP were used to prepare
Frequency distribution in %
Tb.Sp in µm
0 200 400 600
0 1.5 3 4.5 6
slurry prepared with 25g slurry prepared with 15g slurry prepared with 10g
Frequency distribution in %
Tb.Th in µm
0 100 200 300 400 500
0 3 6 9 12
slurry prepared with 25g slurry prepared with 15g slurry prepared with 10g
blocks and granulates by the polyurethane method. Although the chemical composition did not differ between the three formulations considered (as measured by EDX and Raman micro spectroscopy), considerable differences exist when considering the spatial repartition of the calcium-phosphate material at the surface of the polymer template. The 10 and 15 g formulations provided very similar results. The biomaterial trabeculae formed at the surface of the polymer were roughly similar and only differed by a small variation in thickness and connectivity by microCT. The repartition of the material was homogenous and corresponded to a regular deposition of the slurry onto the scaffold. On the other hand, the 25 g series provided considerable heterogeneous blocks with the central cavities of the foam blocks completely filled with the slurry. The consequence was that 25 g blocks provided the largest granules after crushing.
MicroCT appeared as an interesting tool for measuring the structural properties of β-TCP biomaterial formulations. MicroCT evidenced both in 2D sections and 3D reconstructions the material microarchitecture and showed the internal voids created by the polyurethane template after the polymer had been pyrolyzed. Very few reports have been concerned with the imaging of the different steps in the preparation of biomaterials by the foam method. Miao et al., have presented very similar pictures obtained by SEM on TCP / hydroxyapatite / poly-lactic poly-glycolic acid composites (Miao et al., 2005). Bohner et al. have prepared β-TCP blocks by emulsion of calcium-phosphate salts in paraffin and castor-oil. They obtained macroporous blocks with a non-interconnected porosity that could be studied both by SEM and microCT (Bohner et al., 2005). The polyurethane foam method is nowadays a widely used technique to prepare porous materials since the template has been used in a number of reports. The main drawback of the technique is the internal microporosity that remains at the center of the material trabeculae after pyrolysis of the polyurethane template. This phenomenon has been found to have deleterious biomechanical consequences on some types of materials (Peng et al., 2000). MicroCT and SEM appear to be complementary and not exclusive tools in the study of biomaterials (Chappard et al., 2005; van Lenthe et al., 2007). SEM can visualize minute details that cannot be imaged by microCT due to the nature of the X-ray photons. This was previously shown by our group (Stancu et al., 2007) and confirmed in this study since the small and thin minute polyurethane plates of the network were not detected by microCT.
On the other hand, SEM is unable to provide quantitative measurements and one should remember that images are obtained with a cavalier projection. However, microCT results also known to depend on the polychromatic nature of the X-ray beam (Davis et al., 2006). In this study, the use of a 1mm aluminum filter was used reduce the spectrum of the X-ray radiation, thus improving the analysis of the calcified material. When the foam was scanned alone, the filter was not used due to the low attenuation coefficient of polyurethane. This could also represent a cause of misrecognition of the small plates observed by SEM and not evidenced by microCT.
MicroCT can provide 3D measurements, however the method is not as sensitive as histomorphometry in the diagnosis of metabolic bone diseases (Chappard et al., 2005; 2007). Parameters obtained with the sphere algorithm are strongly influenced by the shape of the objects themselves (Chappard et al., 2005) and the study of the frequency distributions of Tb.Th and Tb.Sp appear much more interesting to consider than the raw value of the parameters. Here, a lognormal distribution of Tb.Th was observed with the 10 and 15 g slurries while a more complex distribution resulted with the use of the 25 g formulation. Similarly, the frequency distribution of Tb.Sp revealed a great heterogeneity in the distribution of the pores with the 25 g formulation. With the three formulations, the curves were negatively skewed and a small peak centered on the 25 µm class corresponded to the thickness of the polyurethane skeleton used to prepare the biomaterial. The mode of preparation using 10 or 15 g of slurry per one gram of foam allows the preparation of more regular granules. The 25 g formulation leads to highly heterogenous blocks with large packets of materials in which macroporosity cannot be properly controlled.
ACKNOWLEDGMENTS
Authors thank Mrs. Laurence Lechat for secretarial assistance. This work was made possible by grants from Contrat de Plan Etat – Region “Pays de la Loire”, the Bioregos program and INSERM. They also thank the Kasios Company for providing the β -TCP, and particularly N. Guéna and A. Lerch for helpful discussions.
REFERENCES
Blouin S, Moreau MF, Weiss P, Daculsi G, Baslé MF, Chappard D (2006). Evaluation of an injectable bone substitute (betaTCP/hydroxyapatite/hydroxy-propyl-methyl-cellulose) in severely osteopenic and aged rats. J Biomed Mater Res A 78:570-80.
Blouin S, Gallois Y, Moreau MF, Baslé MF, Chappard D (2007). Disuse and orchidectomy have additional effects on bone loss in the aged male rat. Osteoporos Int 18:85-92.
Bohner M, van Lenthe GH, Grunenfelder S, Hirsiger W, Evison R, Muller R (2005). Synthesis and character-ization of porous beta-tricalcium phosphate blocks. Biomaterials 26:6099-105.
Chappard D, Blouin S, Libouban H, Baslé MF, Audran M (2005). Microcomputed tomography for the study of hard tissues and bone biomaterials. Microsc Anal 19: 17-9.
Chappard D, Retailleau-Gaborit N, Legrand E, Baslé MF, Audran M (2005). Comparison insight bone measure-ments by histomorphometry and microCT. J Bone Miner Res 20:1177-84.
Chappard D, Josselin N, Rougé-Maillart C, Legrand E, Baslé MF, Audran M (2007). Bone microarchitecture in males with corticosteroid-induced osteoporosis. Osteoporos Int 18:487-94.
Chappard D, Baslé MF, Legrand E, Audran M (2008). Trabecular bone microarchitecture: A review. Morphologie 92:162-70.
Daculsi G, Laboux O, Malard O, Weiss P (2003). Current state of the art of biphasic calcium phosphate bioceramics. J Mater Sci Mater Med 14:195-200. Davis GR, Elliott JC (2006) Artefacts in X-ray
micro-tomography of materials. Mater Sci Technol 22:1011-8. Driessen AA, Klein CP, de Groot K (1982). Preparation
and some properties of sintered beta-whitlockite. Biomaterials 3:113-6.
Filmon R, Retailleau-Gaborit N, Grizon F, Galloyer M, Cincu C, Baslé MF et al. (2002). Non-connected versus interconnected macroporosity in poly (2-hydroxyethyl methacrylate) polymers. An X-ray microtomographic and histomorphometric study. J Biomater Sci Polym Ed 13:1105-17.
Gauthier O, Bouler JM, Aguado E, Pilet P, Daculsi G (1998). Macroporous biphasic calcium phosphate ceramics: influence of macropore diameter and macroporosity percentage on bone ingrowth. Biomaterials 19:133-9. Hildebrand T, Ruegsegger P (1997). A new method for the
model-independent assessment of thickness in three-dimensional images. J Microsc 185:67-75.
Hiu-Yan Y, Ling Q, Kwong-Man L, Ming Z, Kwok-Sui L, Chun-yiu CJ (2005). Novel approach for quantification
of porosity for biomaterial implants using micro-computed tomography (microCT). J Biomed Mater Res B 75:234-42.
Hsu YH, Turner IG, Miles AW (2007). Fabrication and mechanical testing of porous calcium phosphate bioceramic granules. J Mater Sci Mater Med 18:1931-7. Jarcho M (1981). Calcium phosphate ceramics as hard
tissue prosthetics. Clin Orthop Relat Res:259-78. Lu JX, Flautre B, Anselme K, Hardouin P, Gallur A,
Descamps M et al. (1999). Role of interconnections in porous bioceramics on bone recolonization in vitro and in vivo. J Mater Sci Mater Med 10:111-20.
Mathieu LM, Mueller TL, Bourban PE, Pioletti DP, Muller R, Manson JA (2006). Architecture and properties of anisotropic polymer composite scaffolds for bone tissue engineering. Biomaterials 27:905-16.
Miao X, Lim W-K, Huang X, Chen Y (2005). Preparation and characterization of interpenetrating phased TCP/HA/PLGA composites. Mater Let 59:4000-5. Parfitt AM, Drezner MK, Glorieux FG, Kanis JA,
Malluche H, Meunier PJ et al. (1987). Bone histo-morphometry: standardization of nomenclature, symbols, and units. Report of the ASBMR Histomorphometry Nomenclature Committee. J Bone Miner Res 2:595-610.
Peng HX, Fan Z, Evans JRG (2000). Factors affecting the microstructure of a fine ceramic foam. Ceramics Int 26:887-95.
Peng HX, Fan Z, Evans JRG, Bushfield JJC (2000). Microstructure of ceramic foams. J Eur Ceram Soc 20:807-13.
Ruhe PQ, Hedberg EL, Padron NT, Spauwen PH, Jansen JA, Mikos AG (2003). rhBMP-2 release from injectable poly(DL-lactic-co-glycolic acid)/calcium-phosphate cement composites. J Bone Joint Surg Am 85-A S3:75-81.
Schwartzwalder K, Somers H, Somers AV: Method of making porous ceramics. InUS, 1963.
Stancu IC, Layrolle P, Libouban H, Filmon R, Legeay G, Cincu C et al. (2007). Preparation of macroporous poly (2-hydroxyethyl) methacrylate with interconnected porosity. J Optoelectr Adv Mater 9:2125-9.
van Lenthe GH, Hagenmuller H, Bohner M, Hollister SJ, Meinel L, Muller R (2007). Nondestructive micro-computed tomography for biological imaging and quantification of scaffold-bone interaction in vivo. Biomaterials 28:2479-90.