Cationic guar gum polyelectrolyte complex micro particles
Cuddapah Sandeep, Tamal Krishna Deb, Afrasim Moin*, HG Shivakumar
Department of Pharmaceutics, JSS College of Pharmacy, Mysore, Karnataka, India
ABSTRACT
Aim: The aim of this study was to organize polyelectrolyte complex microparticles (PECMP) of cationic guar gum and xanthan gum. Materials and Methods: The complex formed was loaded with diclofenac sodium (DS) as a model drug. The prepared microparticles were characterized by Fourier transform infrared spectroscopy (FT-IR), differential scanning colorimetry (DSC), scanning electron microscopy (SEM), and evaluated for in vivo in vitro properties. Result: DSC and FT-IR studies were done to measure the formation of PEC and confi rmed the absence of chemical interactions between drug and polymers. By SEM, the surface morphology was studied. Particle size ranged between 294 and 300 μm. The percentage of encapsulation effi ciency of the microparticles was found to be 96.47%. In vitro release studies indicated that the drug release extended beyond 12 h. Kinetic analysis of dissolution data indicated that the drug release was by super case II mechanisms. Compared with DS solution, microparticles show low and prolonged drug release when subjected to in vivo pharmacokinetic evaluation in rabbits. Based on in vitro and in vivo studies, it was concluded that these micro particles provided oral controlled release of DS. Conclusion: The research fi ndings obtained from the studies were found to be satisfactory. Hence, PECMP can be effectively used for preparation of sustained-release formulation.
Key words: Cationic guar gum, micro particles, polyelectrolyte complex, xanthan gum
INTRODUCTION
Throughout the past decades, a variety of polymer-based pharmaceutical carrier systems have been developed as a new means of the controlling temporal or distributional drug delivery. These controlled drug release systems tender abundant reward in assessment with conventionally administered drugs in dosage forms, such as superior
effectiveness and reduced toxicity. Polymeric cross-linked carrier matrices, such as micro particles, hydrogels and supra molecular polymer aggregates are typical examples of common drug delivery devices.1,2
Single unit dosage forms containing extremely acidic drug such as Ibuprofen, Diclofenac sodium, etc., when compared to multiple unit dosage forms dispense the drug more reliably in the gastrointestinal tract, ensuing in consistent drug absorption and abridged local irritation. Prominent local drug concentration and the menace of toxicity due to locally restrained tablet can be avoided with the multiple unit dosage forms, the reimbursement of such controlled-release preparations containing non-steroidal anti-infl ammatory drugs over their conventional dosage forms have been reported in progress. Predominantly, such systems diminish
*Address for correspondence:
Dr. Afrasim Moin, Department of Pharmaceutics, JSS College of Pharmacy, S. S Nagar, Mysore - 570 015, Karnataka, India. E-mail: [email protected]
Access this article online Journal Sponsor
Website:
www.jyoungpharm.org
DOI:
the serious gastric irritant side effects of the conventional NSAID preparations.3 Conventional drug delivery, in
the majority of cases, gives poor control of plasma drug concentration. By designing a dosage form with aptitude to release its contents at an unremitting and controlled rate for a long extent of instance, constant plasma drug levels can be attained.4,5 Poly Electrolyte Complex (PEC) is the
combination of two polymers, of which one polymer is positive charged and another is negatively charged. In the PEC, polymer prepared with the same monomer alone cannot meet the divergent demand in terms of both properties and performance. Therefore, PEC of two different polymers would be a better choice.6-8 PEC could help improve the
mechanical strength and resiliency of the polymer.
The foreword of trimethyl ammonium groups imparts cationic personality to the gum. Cationic guar gum (CGG) is personalized guar gum in which hydroxyl groups are replaced with trimethyl ammonium groups - it acts as viscosity, volume & foam enhancer, outstanding non-gelling thickener. It carries a net positive charge and can be easily cross-linked with other anions because of presence of ammonium groups.9,10 Cationic guar is less explored
among the guar derivatives which will be studied for formulation of micro particles.
Xanthan gum (XG) is a polysaccharide having polyanionic properties due to carboxylic groups and has very good bio adhesive strength. However, despite their biodegradable character, neither CGG nor XG can be used alone to formulate a controlled-release formulation as both possess highly acidic or alkaline pH due to the presence of anionic or cationic groups, respectively. The intense alkaline or acidic pH, gives rise to mucosal irritation.11,12
The presence of a number of amino groups permits CGG to chemically react with XG, thus ensuing in amendment of physiochemical characteristics and release performance of such combinations.13
Diclofenac sodium is used in the long-term symptomatic treatment of an kylosing spondylitis, osteoarthritis and rheumatoid arthritis. Its biologic half-life has been reported as 1-2 h. gastrointestinal side effects are commonly seen. Due to the short biologic half-life and associated adverse effects, it is considered as an ideal candidate for controlled drug delivery.14-16
In consideration of the above facts, the present study addresses the preparation of novel Poly Electrolyte Complex micro particles by mixing both anionic gum and cationic gum in the solution form for controlled release. The release of DS from PEC micro particles was
determined by preparing micro particles by using cationic guar gum and Xanthan gum in dissimilar ratios. These micro particles were characterized by SEM, FTIR and DSC to investigate the shape and drug polymer interactions in the PEC micro particles.
MATERIALS AND METHODS
Ma terial
DS (2-[(2,6-dichlorophenyl) amino]-Mono sodium), were obtained free of charge from Darwin Formulation Pvt. Limited, Vijayawada, India. XG was purchased from Sigma-Aldrich, Bangalore, India. CGG was purchased from Encore natural polymers Pvt. Ltd., Ahmadabad, India. Acetic acid, hydrochloric acid, sodium hydroxide pellets, and potassium dihydrogen phosphate, methanol were purchased from Merck specialties private ltd, Mumbai, India.
Methods
Turbidity measurements
The XG/CGG ratio in the complex was examined by monitoring the transmittance of the solution at a wavelength of 600 nm using a UV spectrophotometer. Aqueous XG solutions (0.02-0.18%) were added to CGG in 2% acetic acid solution (0.18-0.02%) gives the ratios of XG:CGG - 1:9, 3:7, 5:5, and 7:3, 9:1. Each mixture was shaken vigorously. The mixtures were then left to stand for 10 min before measuring the transmittance as a function of the various mixing ratios (XG/CGG).
Viscosity measurements
The effi ciency of PEC formation was determined by measuring the viscosity of the supernatant solutions after mixing different ratios of the solutions. Aqueous XG solutions (0.02-0.18%) were added to CGG in 2% acetic acid solution (0.18-0.02%) gives the ratios of XG:CGG - 1:9, 3:7, 5:5, and 7:3, 9:1. Each mixture was shaken vigorously. The mixtures were then left to stand for 10 min before measuring the viscosity as a function of the various mixing ratios (XG/CGG).
pH measurements
Determination of PEC formation between CGG and XG
Appropriate volumes of 0.02-0.18% (w/v) XG solutions were taken in a fl ask, and placed on the mechanical stirrer (REMI, India). Then 0.18-0.02% (w/v) aqueous CGG in 2% (v/v) acetic acid solution was added to give total volume of 50 mL and specifi ed XG/CGG (% w/w). The presence of a gel-like precipitate was observed in each fl ask. The content of the fl ask was centrifuged at 5000 rpm for 15 min. The precipitate was dried at 45°C, and the yield (%) of the precipitate was determined. The prepared complex is as shown in the chart presented in the (Table 1)
Preparation of drug-loaded microparticles using PEC of CGG and XG
The formulation F1 gives maximum % yield, where the PEC formation is more that the formulation is selected to prepare drug-loaded microparticles. To the solution of 0.18% cationic guar in 2% acetic acid, 0.02% xanthan aqueous solution containing a constant amount of DS 0.2% (w/v) is added. The precipitated product was separated from the solution by centrifugation at 5000 rpm, and then it was dried at 45°C for 12 h, and milled in a mortar and passed through a sieve # 40 over # 85. Those particles passed through a sieve # 40 but retained on the sieve # 85 were used for further studies.
Fourier transforms infrared spectroscopy (FT-IR)
FT-IR studies were carried out to evaluate the compatibility of the drug and the polymers used, using Shimadzu FT-IR 8400S. The pellets were prepared by pressing the sample with KBr. Compatibility between the drugs and the polymers were compared by FT-IR spectra. The positions of FT-IR bands of important functional groups of drugs were identifi ed and were cross-checked in FT-IR spectra of drug with formulation.
Differential scanning calorimetry (DSC)
All the dynamic DSC studies were carried out on DSC Q200, Thermal analyzer. Calorimetric measurements were made with an empty cell (high-purity alpha alumina discs) as
a reference. By using high-purity indium metal as standard, the instrument was calibrated. In the nitrogen atmosphere at the heating rate of 10°C/min, the vibrant scans were taken and run were made in triplicate.
Scanning electron microscopy (SEM)
Photographs were taken for the prepared microparticles with an SEM, Joel- LV-5600, USA, in room temperature at the required magnification. For morphological characteristics, the photographs were observed, and the shape of microparticles was authenticated.
Micromeritic properties
Tap densities of the prepared microparticles were determined using tap density tester and percentage Carr’s index was calculated.
Particle size analysis
Particle size analysis was carried out by optical microscopy. About 200 microparticles were selected randomly, and their size was determined using an optical microscope fi tted with a standard micrometer scale.
Yield of the process
Determining whether the preparation procedure chosen for incorporating a drug into the microparticles is effi cient, is of prime importance. The raw materials, an amount of active compound, DS, an amount of polymers, stirring speed and other process parameters are deciding factors in the yield of the product during the preparation of microparticles. The percentage yield was determined using the below-mentioned formula.
% Yield=(Wt of microspheres)/(Wt of polymers+Wt of drug)×100
Drug loading and entrapment efficiency
With regard to release characteristics, drug loading is important. Normally, improved drug loading leads to
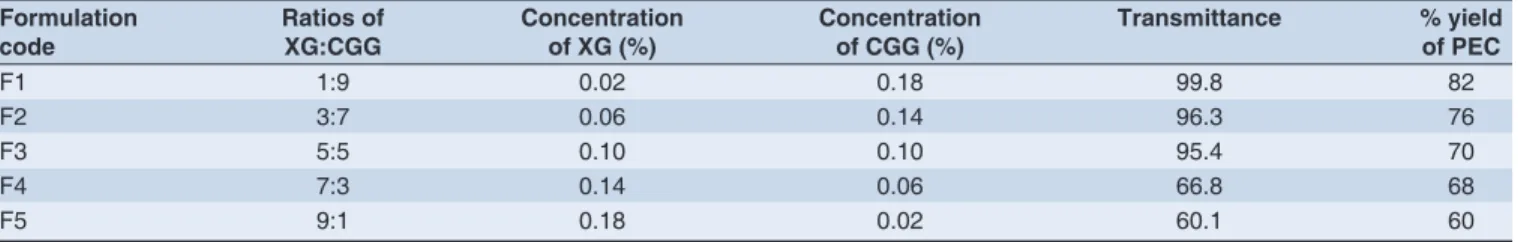
Table 1: Formulation chart of PECMP without drug Formulation
code Ratios of XG:CGG Concentration of XG (%) Concentration of CGG (%) Transmittance % yield of PEC
F1 1:9 0.02 0.18 99.8 82
F2 3:7 0.06 0.14 96.3 76
F3 5:5 0.10 0.10 95.4 70
F4 7:3 0.14 0.06 66.8 68
F5 9:1 0.18 0.02 60.1 60
an acceleration of the drug release. Drug entrapment efficiency represents the proportion of the initial amount of drug, which has been incorporated into the microparticles. 100 mg of microparticles was extracted with 5 mL of methanol. The extracted solution was fi ltered and made to 100 mL with pH 7.4 phosphate buffer. From this, 1 mL of solution was transferred to 10 mL volumetric
fl ask and diluted up to the mark. Further 3 mL of this solution was diluted to 10 mL with pH 7.4 phosphate buffer and absorbances were measured at 276 nm. The drug content was calculated using the below-mentioned formula.
Amount of drug= (conc.from standard graph ×dilution factor)/1000
Encapsulation effi ciency and drug loading percentage were calculated using the following equations.
% of Loading=(Weight of dr ug)/(Weight of microspheres)×100
Encapsulation Efficiency= (Actual drug content)/ (Theoretical drug content)×100
In vitro release studies
In vitro, release studies are useful for quality control as well as for the prediction of in vitro- in vivo correlation. Unfortunately, due to small sizes of the microparticles, the drug release from microparticles observed in vitro can differ greatly in In-vivo conditions. Depending on the type of carrier, drug release from microparticles can take place through several processes.
Release study for microparticles was carried out on the formulation in triplicate, using basket type dissolution tester-USP XXII, TDT-08L, using 900 mL of pH 7.4 phosphate buffer as a dissolution medium at 100 rpm and 37 ± 0.5°C. An aliquot of sample was withdrawn periodically at every 1 h intervals, and the volume was replaced with an equivalent volume of plain the dissolution medium. Spectrophotometrically at 276 nm after suitable dilutions, samples were analyzed.17
Mathemati cal model fitting of formulation
In vitro release studies
To know which mathematical model will suit the obtained release profi le, the release data were fi tted into various mathematical models using planar cell polarity. PCPDisso V 2.08 software Bharthi vidypeeth Pune college of Pharmacy, India. The parameters like ‘n’ the
diffusion exponent ‘k’ the release rate constant and ‘R’ the regression co-effi cient were determined to know the release mechanisms.18,19
In vivo evaluation
Rabbits of either sex weighing (2.8-3.2 kg) were divided into 2 groups, each consisting 6 animals. First group received 3 mg DS aqueous solution. Second group received the formulated microparticles containing an equivalent of 3 mg DS. 12 h before drug administration, food was withdrawn from the rabbits. Throughout the study, all rabbits had free access to water. The protocol for this study was permitted by the institutional animal ethical committee. At defined time intervals, blood samples were collected from the marginal ear vein. Blood collected was centrifuged at 2000 rpm for 10 min and drug concentration after deproteinization with acetonitrile was determined by high-performance liquid chromatography (HPLC) assay.19
Estimation of plasma drug concentration by HPLC
After extraction, 10 mL of the aqueous phase was injected into the C-18 column through which mobile phase components were pumped. The peak area ratio of DS to that of internal standard (mefenamic acid) was determined, and this was used to estimate the plasma concentration of DS using the regression equation. The regression equation was set up by spiking the drug-free plasma with varying amounts of DS and fi xed quantity of internal standard (0.5 mg), and treating the plasma as described above. A good linear relationship was observed between the peak area ratio and plasma.
Drug decomposition or degradation occurs during storage due to chemical alteration of the active ingredients or due to product instability. Hence, the stability studies are conducted.
RESULTS
V iscosity measurements
viscosity measurement, it shows F1 (XG:CGG - 1:9) shows less viscosity due to the formation of dense phase due to the formation of more PEC (Figure 1).
Turbidity measurements
To determine the composition of the PEC, the change in transmittance as a function of the ratio of XG to CGG was measured. The XG solution in different concentrations is added at different concentrations of CGG in 2% acetic acid solution. When the gum solutions were observed prior to mixing, it shows turbidity. After mixing the solutions, it forms PEC that settles down, and the solution will remain clear. If the PEC formation is more, then turbidity decreases and the solution transmittance will increase. Hence, the solution which shows higher transmittance will form more PEC. The transmittance result shows the formulation F1 (XG:CGG - 1:9) shows more transmittance and forms more PEC.
pH measurements
The XG/CGG ratio in the complex was examined by observing the pH of the supernatant solutions after mixing different ratios of the solutions exhibiting specifi c pH.
Determination of PEC formation between XG and CGG
Different concentrations of XG and CGG were mixed to form PEC that was centrifuged at 5000 rpm for 15 min to separate the precipitate. The precipitate was dried at 45°C, and the yield (%) of the precipitate was determined. The formulation F1 (XG:CGG - 1:9) showed maximum PEC formation with maximum % yield. Thus, XG at low concentrations, the PEC yield is more.
Preparation of drug loaded microparticles using PEC of CGG and XG
To the solution of cationic guar in 2% acetic acid, Xanthan aqueous solution containing the constant amount of DS 0.2% (w/v) was added. The precipitated product was separated from the solution by centrifugation at 5000 rpm, and then it was dried at 45°C for 12 h, and milled in a mortar and passed through a sieve # 40 over # 85. Those particles passed through a sieve # 40 but retained on the sieve # 85 were used for further studies.
Compatibility Studies
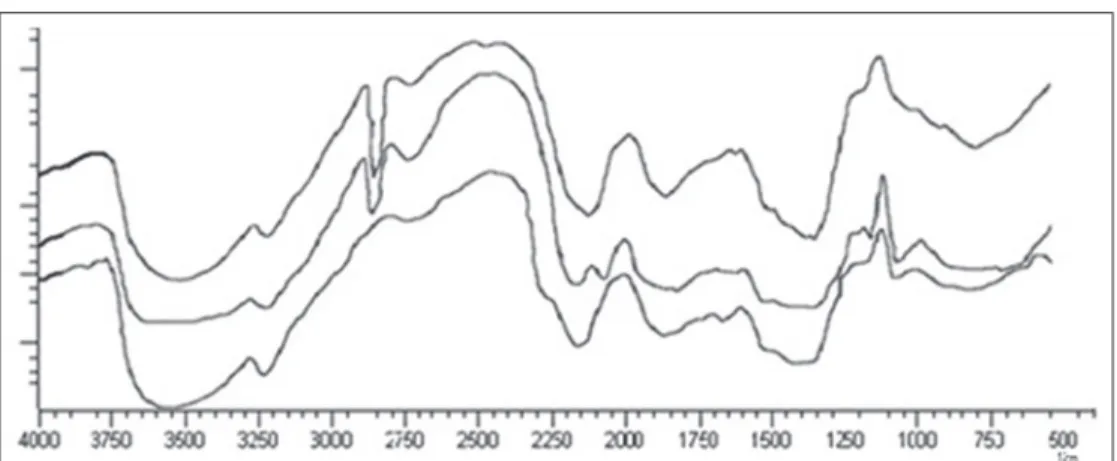
FT-IR analy sis
Sharp peaks of strong intensity were observed at 1653/cm and 1419/cm in the FT-IR spectra of CGG. The FT-IR spectra of XG showed a peak at 1728/cm indicating the presence of carboxyl groups. Whereas the PEC exhibited, peaks at 1565/cm could be attributed to - N+(CH3)3 of
CGG and 1407/cm indicated the presence of - COO−
ions (representing C=O stretch of - COO−). These results
indicate that the carboxylic groups of XG are dissociated into - COO− ions which complex with cationic groups of
CGG through electrostatic interaction to form the PEC Figure 2.
Figure 3 shows the FT-IR spectra of drug-loaded microparticles, pure DS. In the case of DS, a broadband at 3430/cm is due to N-H stretching vibrations. Bands at 2924, 1772, 748, 1452, 771/cm are attributed to alkaline C-H stretching, ester C=0 stretching, aromatic C-H, and aromatic C=C, C-N, respectively.
DSC
DSC thermograms of pure DS, pure XG, pure CGG, and drug-loaded PEC microparticles (formulation F1) were taken as shown in Figure 4. The pure DS shows sharp peaks at 101.35°C and 288.99°C these peaks are due to polymorphism and melting of DS. In the DSC thermogram of XG, the transition temperature was observed near 101.87°C. In the DSC thermogram of CGG showed a sharp peak at 68°C due to melting of CGG. In the DSC thermogram of PEC showed peaks at 48°C and 95.6°C.
SEM
Figure 5 formulation F1. SEM was performed to confi rm the formation of microparticles. Microparticles did not agglomerate and had a rough surface. Polymeric debris appears on some micro particles surface.
Percentage yield of DS micro particles
Microparticles were weighed after drying and the percentage yield was calculated. For the optimized formulation (F1), the percentage yield was found to be 81.2 ± 0.38% (mean ± standard deviation, n = 3).
Entrapment efficiency
The results of % encapsulation effi ciencies were calculated by estimating the amount of DS present in the solution from which the PEC is separated by centrifugation. The difference between total drug used in the preparation and amount of DS left in the solution will give the amount of drugs entrapped in the PEC. From that results actual drug loading was 48.4 ± 0.23%, theoretical drug loading was 50% and %EE was found to be 96.47 ± 0.12% for the optimized formulation F1.
Figure 4: Differential scanning colorimetry thermograms of diclofenac sodium, xanthan gum, cationic guar gum, and drug-loaded polyelectrolyte complex
Figure 5: Scanning electron microscopy micrographs of polyelectrolyte complex microparticles
Figure 3: Fourier transform infrared spectroscopy of diclofenac sodium and formulation
Micromeritic properties
The fl ow property of the microspheres was studied by calculating the angle of repose (θ) and % compressibility index (CI). The angle of repose of optimized formulation F1 was found to be 25.6 ± 0.7 indicating that the obtained values were well within the limits. This result clearly shows that the prepared microparticles have reasonably good
fl ow potential. The value of bulk density was found to be 0.4250 ± 0.023 g/cm3. The value of tapped density was
found to be 0.4908 ± 0.023 g/cm3. The value of CI was
found to be 13.4 ± 0.32 indicates good (free fl owing) fl owing properties. In vitro drug release, and in vitro dissolution studies were carried out for DS-loaded microparticles using 900 mL of pH 7.4 phosphate buffers as the dissolution medium at 100 rpm for 12 h at 37 ± 0.5°C.
A result of % cumulative drug release of microparticles for optimized formulation F1 was compared with diclofenac pure drug is shown in Figure 6.
In vitro drug release
The release profi le of DS exhibits a sigmoidal profi le. From the literature, it is evident that (Singh et al.) the release of DS is lower in acidic condition when compared to pH 7.4 phosphate buffer. Overall release of DS in acidic pH was less due to:
i. Low solubility of the drug in acidic solution
ii. CGG and XG were ionized to a substantial level causing a tightening of network in PEC.
This effect results in less swelling, thus retarding the drug release. In the diclofenac pure drug dissolution, release is more in pH 7.4 compared to microparticles because there is no PEC to control the drug release. The optimized formulation F1 showed 61.02% release in 12 h, and pure drug showed 96.11% release in 2 h. Hence, the in vitro dissolution results of the PEC microparticles showed the controlled drug release in 12 h compared to pure DS.
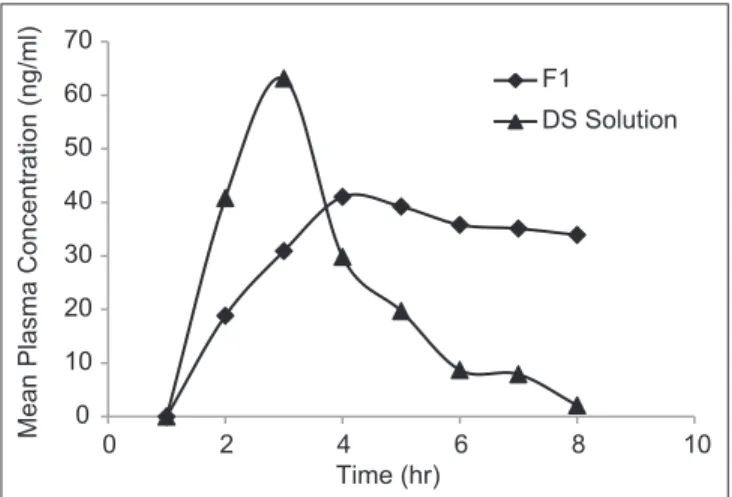
In vivo studies
Rabbits of either sex weighing (2.8-3.2 kg) were divided into 2 groups, each consisting 6 animals. Rabbits (New Zealand, White) of either sex weighing (2.8-3.2 kg) were divided into 2 groups, each consisting 6 animals. First group received 3 mg DS aqueous solution. Second group received the formulated microparticles (F1) containing the equivalent of 3 mg DS. Food was withdrawn from the rabbits 12 h before drug administration. All rabbits had
free access to water throughout the study. Blood samples were collected from the marginal ear vein at defi ned time intervals. Blood collected was centrifuged at 2000 rpm for 10 min and drug concentration after deproteinization with acetonitrile was determined by HPLC assay, and the plasma drug concentration time profi le is presented in Figure 7.
From the obtained data, DS solution showed peak plasma concentration (Cmax) as 65.11 ± 2.2 ng/mL and 43.25 ± 1.2 ng/mL for PEC microparticles (F1). The Tmax for DS solution was found to be 2.23 ± 0.34 h and 4.43 ± 0.1 h for PEC microparticles (F1). The observed values AUC0-12 were 269.35 ± 4.52 and 615.71± 5.21ngh/mL for DS solution and F1. The elimination rate constant (Ke) for DS solution was found to be 0.702 ± 0.01 (h-1) and 0.126 ± 0.03 (h-1) for F1. The t1/2 values were 0.986 ± 0.04 (h) for DS solution and 5.471 ± 0.032 (h) for F1. From the results, it was observed that optimized formulation showed sustained/extended release (Figure 7).
0 20 40 60 80 100 120
1 2 3 4 5 6 7 8 9 10 11 12 13 Pure Diclofenac F1
%CDR
Time
Figure 6: In vitro release rate profi le of microparticles formulation F1 and diclofenac SR tablet
0 10 20 30 40 50 60 70
0 2 4 6 8 10
F1
DS Solution
Mean Plasma Concentration (ng/ml)
Time (hr)
DISCUSSION
Viscosity measurements
XG is poly-anionic in nature; hence it requires more CGG molecules to neutralize all - COO− groups of XG.
At XG: CGG 1:9 ratio the - N+(CH3)3 groups of CGG
neutralize all- COO− groups of XG and forms more
PEC so the dissolved gum concentration decreases at this ratio and shows less viscosity. In other ratios, the numbers of amine groups on CGG are not enough to neutralize the carboxylic groups on the XG, so they show high viscosity levels due to dissolved gums in the solution. Therefore, the XG and CGG with the mixing ratio 1:9 were used to characterize the PEC and to study the release profi le.
Turbidity measurements
When the amount of CGG is more, the PEC formation also more at an XG:CGG ratio of 1:9, each interaction site of CGG and XG was saturated. Therefore, the XG and CGG with the mixing ratio 1:9 were used to characterize the PEC and to study the release profi le.
pH measurements
Polyelectrolytes carry net negative charge or positive charge and exhibits specific pH. Hence, there is a possibility of neutralization of charge when polyelectrolytes of opposite charge are mixed during the formation of PEC.
Determination of PEC formation between XG and CGG
Trimethyl ammonium groups impart cationic character to the guar and can be cross-linked with other anions. XG is a polysaccharide having polyanionic properties due to carboxylic groups. The presence of a number of amino groups permits CGG to chemically react with XG, thereby resulting in alteration of physiochemical characteristics and release behavior.
Preparation of drug loaded microparticles using PEC of CGG and XG
The viscosity measurements, pH measurements, turbidity measurements, and % yield of PEC shows that F1 is suitable for maximum PEC formation. So that ratio (F1 XG:CGG - 1:9) was selected for preparation of drug loaded microparticles.
FT-IR analysis
From FT-IR spectroscopy, it was found that PEC is formed between CGG and XG. PEC shows the characteristic peaks of both CGG and XG with minor shifts. The presence of -COO− groups and - N+(CH3)3 in the PEC strongly suggests
the existence of N (CH3)3+COO− complex between CGG
and XG molecule thus, leading to PEC Figure 2.
In the case of drug-loaded microparticles all the bands that were observed in DS have also appeared, indicating the chemical stability of DS after formation of PEC micro particles. This FT-IR showed the drug DS is compatible with the polymers used to form PEC Figure 3.
DSC
There is no detectable endotherm, if the drug is present in a molecular dispersion or solid solution state in the polymeric microparticles loaded with drug. There was no peak corresponding to DS, indicating the amorphous dispersion of DS into PEC complex.
Percentage yield of DS micro particles
During the process of microencapsulation, the mechanical variables cause loss of the fi nal product and hence, process yield may not be 100%.
CONCLUSION
The objective of the study was to prepare polyelectrolyte complex microparticles (PECMP) of CCG and XG using DS as model drug. The prepared microparticles were characterized and evaluated.
The following conclusions were drawn from the results obtained.
• The maximum yield of PEC was obtained at 1:9 ratio of XG:CGG
• FT-IR and DSC studies confi rmed the formation of PEC and also indicated the compatibility between drug and the polymers used
• The prepared micro particles exhibited good micromeritic properties of the particle size ranging between 294 and 300 μm with a notable EE of 96.47% • SEM studies indicated that the drug-loaded
microparticles were nonaggregated, with the hydrated micro particles showing spongy surface conforming the diffusional and erosional mechanism
• In vivo results of microparticles showed the sustained release of DS
Thus, the present research work has been carried out adopting a standard procedure to meet the set objectives. The research fi ndings obtained from the studies were found to be satisfactory. Hence, PECMP can be effectively used for preparation of sustained-release formulation.
ACKNOWLEDGMENT
The authors acknowledge JSS Mahavidyapeetha, Mysore and JSS University, Mysore, India, for their valuable support during this research. The authors wish to thank to IISc, Bangalore for providing facilities for SEM and DSC studies.
REFERENCES
1. Yin C, Yin L, Fei L, Cui F, Tang C. Superporous hydrogels containing poly (acrylic acid-co-acrylamide)/O-carboxymethyl chitosan interpenetrating polymer networks. Biomaterials. 2007;28:1258-66.
2. Rokhande AP, Shelke NB, Patil SA, Aminabhavi TM. Novel interpenetrating polymer network microspheres of chitosan and methylcellulose for controlled release of theophylline. Carbohydr Polym. 2007;69:678-87.
3. Gohel MC, Amin AF. Formulation design and optimization of modifi
ed-release microspheres of diclofenac sodium. Drug Dev Ind Pharm. 1999;25:247-51.
4. Elworthy PH, George TM. The molecular properties of ghatti gum: A naturally occurring polyelectrolyte. J Pharm Pharmacol. 1963;15: 781-93.
5. Rokhade AP, Sunil A, Patil SA. Mallikarjuna N, Kulkarni V. Aminabhavi TM. Semi-interpenetrating polymer network microspheres of gelatin and sodium carboxymethyl cellulose for controlled release of ketorolac tromethamine. Carbohydr Polym. 2006;65:243-52.
6. Nishi KK, Jayakrishnan A. Preparation and in vitro evaluation of primaquine-conjugated gum Arabic microspheres. Trends Biomater Artif Organs. 2005;18:2.
7. Ramesh Babu V, Sairam M, Hosamani KM, Aminabhavi TM. Preparations of sodium alginate-methylcellulose blend microspheres for controlled release of nifedipine. Carbohydr Polym. 2007;69:241-50.
8. Kurkuri MD, Aminabhavi TM. Poly(vinyl alcohol) and poly(acrylic acid) sequential interpenetrating network pH-sensitive microspheres for the delivery of diclofenac sodium to the intestine. J Control Release. 2004;96:9-20.
9. Ranaa V, Raia P, Tiwarya AK, Singh RS, Kennedy JF, Knill CJ. Modifi ed
gums: Approaches and applications in drug delivery. Carbohydr Polym. 2011;83:1031-47.
10. Gowda D, Gowrav M, Gangadharappa H, Khan M. Preparation and evaluation of mixture of eudragit and ethylcellulose microparticles loaded with ranolazine for controlled release. J Young Pharm. 2011;3:189-96. 11. Singh M, Tiwary AK, Kaur G. Investigations on interpolymer complexes of
cationic guar gum and xanthan gum for formulation of bioadhesive fi lms. Res Pharm Sci. 2010;5:79-87.
12. Janet Degrazia L, Bowman CN. Settling characteristics of microparticles
modifi ed by hydrophilic semi-interpenetrating polymer networks. J Appl
Polym Sci. 1994;55:793-805.
13. Bhardwaj TR, Kanwar M, Lal R, Gupta A. Natural gums and modifi ed
natural gums as sustained-release carriers. Drug Dev Ind Pharm. 2000;26:1025-38.
14. Das A, Wadhwa S, Srivastava AK. Cross-linked guar gum hydrogel discs for colon-specifi c delivery of ibuprofen: Formulation and in vitro evaluation. Drug Deliv. 2006;13:139-42.
15. Santos H, Veiga F, Pina ME, Sousa JJ. Compaction, compression and drug release properties of diclofenac sodium and ibuprofen pellets comprising xanthan gum as a sustained release agent. Int J Pharm. 2005;295:15-27. 16. William Martindale, James EF, Reynolds (Editor). Martindale. The
Extra Pharmacopoeia Pharmaceutical Press. 27th ed. London: The Royal
Pharmaceutical Society; 1978. p. 1748-9.
17. Indian pharmacopoeia. Buffer Solutions. IP-2007; 1: 477-8.
18. Korsmeyer RW, Gurny R, Doelker E, Buri P, Peppas NA. Mechanisms of potassium chloride release from compressed, hydrophilic, polymeric matrices: Effect of entrapped air. J Pharm Sci. 1983;72:1189-91. 19. Costa P, Sousa Lobo JM. Modeling and comparison of dissolution profi les.