Journal of Global Pharma Technology
Available Online at:
www.jgpt.co.in
RESEARCH ARTICLE
Synthesis, Characterization and Spectrophotometric Studies of
New Hydrazone Derived from Ethyl benzoate
Maha D. Azeez
1,Sajid H.Guzar
2*,Athraa H. Mekky
11. Department of Chemistry, College of Science, Thi-Qar University, Iraq.
2. Department of Chemistry, College of Science, University of Kerbala, Iraq.
*Corresponding Author: Sajid H.Guzar
Abstract
The present work includes synthesis and characteriation of new hydrazone derived from ethyl benzoate. Firstly, benzoate hydrazide [A] has been synthesized from the condensation of ethyl benzoate with hydrazine.Then the benzoate hydrazide was reacted with phenylisothiocynate to prepare [B]. Cyclization reaction of product [B] with sodium hydroxide produced terazole derivative [C].On the other hand, alcylation reaction of compound [C] with chloroethylacetate in the presence of Sodiumacetatetrihydrate as a catalyst resulted [D]. The acid hydrazide derivative [E] has been synthesized by the reaction of compound [D] with hydrazine hydrate . Finaly, hydrazone derived [M] was synthesized by the condensation reaction of the acid hydrazide [E] with 5-bromo-2-hydroxy benzaldehyde . The synthesized compounds were characterized by UV-Visible, FT-IR, 1H-NMR ,13C-NMR and Mass spectra. Analytical spectrophotometric study of the complexes of Lead (II),Cobalt(II) and Cadmium (II) with the hydrazone[M] was achieved. At a pH value of 7.0. lead, cadmium and cobalt salts reacted with [M] to form a 1:1 yellow, 1:1green, and 1:1 viole complexes with absorption peaks at 397, 389 ,and 396 nm, respectively. Under the optimal conditions, Beer’s law was obeyed over the ranges of 0.01- 0.000001 The apparent molar absorptivity and Sandell’s sensitivities were 8.5 ×102,8.0 ×103, and 9.8 ×10² L·mol−1·cm−1 respectively, and 0.00964, 0.00600, and 0.00275 µg·cm-2 respectively. The detection limits were found to be 32.75, 41.85, and 40.66 µg/mL-2 respectively.
Keywords:Hydrazones Schiff base, Ethyl benzoate, Analytical studies.
Introduction
Hydrazones are a class of azomethine have the group -C=N-N-obtained by the reaction of hydrazide with aldehydes or ketones . Hydrazides have the general formula of NH2-NH-R which derived from hydrazine NH2-NH2 [1]. Hydrazones contain two nitrogen atoms of different nature connected with each other. The carbon nitrogen double bond (C=N) that is conjugated with a lone
pair of electrons on the terminal nitrogen atom (N̈) these structural fragments are responsible for the physical and chemical properties of hydrazones. Both nitrogen atoms of the hydrazone group are nucleophilic , but the amino nitrogen is more active.The carbon atom of hydrazone group has both electrophilic and nucleophilic characteristics [2,3].
Hydrazine Hydrazide Hydrazone
Figure 1: General Formula of Hydrazine, Hydrazide and Hydrazone
Hydrazone formation is extensively used in the detection, determination and isolation of compounds containing carbonyl group[4]. Photometric methods for determining
intensive area of study and numerous transition metal complexes with those ligands have been investigated [7, 8].
Hydrazone compounds obtained by the reaction of aromatic and heterocyclic hydrazides with mono and di-aldehydes or ketones have revealed very versatile behavior in the metal coordination [9]. Many researchers have synthesized a number of new hydrazones because of their ease of synthesis [19].
Hydrazones have been studied as a group of the most useful spectrophotometric reagents [10, 12]. With appropriate starting materials(carbonyl compounds and hydrazine) used, the sensitivity as an analytical reagent and or the solubility of the hydrazones could be improved and the donating environment could be changed. The limitation of hydrazones was their lack of selectivity [10] for metal ions. Therefore, much effort has been devoted to the development of masking reagents for the use of hydrazones [13, 14]. Their metal complexes have applications in various chemical processes such as nonlinear optics, sensors, and medicine. Furthermore, hydrazones incorporating heterocyclic moieties are well known for their metal binding ability and exhibit interesting coordinating behavior with transition metal ions [15, 17].
Materials and Methods
Reagents
All used chemicals and solvents were of chemically pure grade, and commercially available. A standard stock solution of lead, cadmium, cobalt (0.01 mol/mL) was prepared by dissolving 0.23g of cadmium nitrate, 0.32g of lead acetate and 0.23g of cobalt chloride in 100 mL of distilled water. A 0.01 mol/mL M1
solution was prepared by dissolving 0.059 g of M1 in 10 mL of dimethyl sulfoxide-methanol(5/5).
Apparatus
Melting points of all the prepared compounds were observed in an electro thermal melting point apparatus model (Melting SMP31). The FTIR spectra in the rang of (400-4000) cm-1
were recorded as KBr disc by the use of a perkin Elme,tensor 27 (Bruker). Nuclear Magnetic Resonance Spectra were obtained using Burker DXR System AL500(500 MHz).
Mass Spectra were obtained utilising (Network Mass Selective Detector5973).UV-Visible spectra were obitained using (Perkin Elmer UV-VIS spectrometer Lambda 35).
Synthesis of Compounds
Synthesis of Benzohydrazide [A]
A mixture of ethyl benzoate (13.6gm, 0.1mol) and hydrazine hydrate (6.4gm, 0.2mol) was dissolved in (50 ml) ethanol, then the mixture was refluxed for 6 hours (monitored by TLC). Afterwhile, the solvent was evaporated to half, cooled and the solid precipetate was filtered and recrystallized in ethanol [18a,b], the solid [A] has white, coloure with a melting point between 114- 117 °C,. The resulted yield was 77%.
Synthesis of 2- benzoyl- N
-phenylhydrazinecarbothioamide [B]
Benzohydrazide [A] (3.32gm, 0.02mol) was added to isothiocyanatobenzene (2.76gm, 0.02 mol) in ethanol (25ml) as a solvent. Then the resulting mixture was refluxed for 6 hours (monitored by TLC). After the completion the mixture was evaporated to half and then cooled. the white solid crystall was filtered and recrystallized in ethanol [19]. Melting point of the product was between 168- 170 °C, with a yield of 88%.
Synthesis of 4,5-diphenyl-4H
-1,2,4-triazole-3-thiol [C]
The mixture of 2-benzoyl-N-phenylhydrazinecarbothioamide [B] (0.542 gm, 0.002mol) in ethanol (20 ml) and sodium hydroxide(16 % , 2ml), was gently refluxed for 7 hrs (monitored by TLC). The mixture was cooled ,then filtered.The pH of the filtrate was adjusted to be 5-6 with diluteacetic acid and was kept aside for 1hr. The white crystalls were formed filtered , and recrystallized from ethanol, the solid (C) had white, colour with a melting point ofm 279- 281 °C,and a yield of 83% .
Synthesis of Ethyl [(4,5-diphenyl-4H
-1,2,4-triazol-3-yl)thio]acetate [D]
The mixture solvent was evaporated to half ,cooled, the solid precipetate was filtered and recrystallized in ethanol, melting point 102- 105 °C, yield 75%.
Synthesis of 2-[(4,5-diphenyl-4H
-1,2,4-triazol-3-yl)thio]acetohydrazide) [E]
Ethyl [(4,5-diphenyl-4H-1,2,4-triazol-3-yl) thio]acetate (D) (0.474gm, 0.0014mol) and hydrazine hydrate (0.07gm, 0.0014mol) were dissolved in (25ml) ethanol .The mixture continuous stirring at room temperature for 6 hours (monitored by TLC). The mixture was cooled and the white solid formed filtered and recrystallized in ethanol, melting point 215- 118 °C, yield 74.8%.
Synthesis of 2-[(4,5-diphenyl-4H
-1,2,4-triazol-3-yl)thio]-N'-(2-furylmethylene)
acetohydrazide) [M]
The hyrazone [M] was synthesized by the condensation of 2-[(4,5-diphenyl-4H -1,2,4-triazol-3-yl)thio]acetohydrazide) [E] (0.4 gm,0.0012mol) and furfural (0.115 gm, 0.0012mol) in ethanol (30 ml), and add 5 drops of acetic acid. Then the mixture refluxed for 4 hours (monitored by TLC). The hydrazone was precipitated, filtered and recrystallized from ethanol [20, 21a,b] to get white solid, melting point 220-223 °C, yield 88.7%.
benzohydrazide
O O CH3
ethyl benzoate
O NH NH2
[A]
,
O NH
NH S
NH
Ph
[B]
N N
SH N
Ph Ph N
N
Ph N Ph S CH2 O
O CH2
C H3
Ethyl chloroacetate
Sodium acetate , Ethanol PhNCS
Ethanol , Reflux
2-benzoyl-N-phenylhydrazinecarbothioamide
4,5-diphenyl-4H-1,2,4-triazole-3-thiol hydrazine hydrate 80%
Ethanol , Reflux
[C] [D]
ethyl [(4,5-diphenyl-4H-1,2,4-triazol-3-yl)thio]acetate
NaOH ,4N(2ml) Ethanol ,Reflux
N N Ph
N Ph
S CH2
O
NH NH2
2-[(4,5-diphenyl-4H-1,2,4-triazol-3-yl)thio]acetohydrazide [E]
+
O H
OH
Br
N N
Ph N
Ph
S O
NH N H
Br O
H
G.A.A
Ethanol
+
H
O
2
N'-[(1E)-(5-bromo-2-hydroxyphenyl)methylen
e]-2-[(4,5-diphenyl-4H-1,2,4-triazol-3-yl)thio]a cetohydrazide
[M]
Scheme 1: Synthesis of ligand (M)
Spectroscopic Studies
Procedure for the Determination of Lead, Cadmium, and Cobalt
Firstly , 1 mL of each lead(II), cadmium (II), and cobalt(II) solutions was transferred into a 10 ml standard flask; then 2 ml of abuffer solution of appropriate pH of 7.0 and 1 ml of
reagent solution were added, successively; finally, the solution was diluted to the mark with dimethyl sulfoxide-methanol(5/5), mixed well, and left for 2 min.
35 spectrophotometer with a cell of 1.0 cm path length against reagent blank. The total volume of the experimental solution was maintained at 10 mL.
The Selection the Appropriate
Wavelength of Ligand
A group of volumetric bottles (10ml) was collected and a liquefaction solution (1M) was prepared with a concentration of 1× 10⁻⁴ mol.L-1 by mixing (2ml) of lycandene solution with 2ml. A combination of two-dimethyl sulfoxide and methanol. The absorbance spectra were recorded at a range of (200-800 nm) using dimethyl sulfoxide -methanol as a reference solution.
The Selection the Appropriate
Wavelengthof Complex
A combination of 10 ml bottles was prepared and a liquefaction solution (M) was prepared at a concentration of (1x 10⁻⁴ mol.L-1) by
mixing (2ml) of ligande solution with 2ml of solution and adding The volume was supplemented to the mark by a combination of dimethyl sulfoxide- methanol, and the absorbance spectra were recorded in the range of (2ml) (Co 2+ , Cd 2+ , Pb2 +) 200-800
nm) using a dimethyl sulfoxide- methanol and solution ligand as a reference solution.
The Determination of the Stoichiometry of the Complex
This study involves finding the ratio of metal ion to lycand for the complexes in the solution and using the methods of continuous changes and molar ratios.
Method of Continuous Changes (Job
Method) [22]
In this method, variable volumes of solutions containing same molar concentration (1×10 -4M) of ligand and metal ions were mixed
together. The total volume was kept constant at 2ml . The absorbance of each solution was measured at λmax and the relationship between the mole fraction of the volume Vm / (Vm + VL) on the X-axis (where Vm and VL represent the volume of the metal and ligand solutions respectively) was plotted against the absorbance on the Y-axis.
Method of Molar Ratios [23]
Two groups of volumetric bottles with a capacity of 10 ml were placed.In each group the concentration of the metals it was fixed to equal (1x 10⁻⁴ mol.L-1) and the concentration
of ligand varied with a range of(0.2x10⁻⁴
-1.6x10⁻⁴) mol.L-1 where the volume is equal to
2 ml.The size was completed to the mark .Then the absorption was measured for each solution at maximum max for each.
Stability Study of Complex Solutions
[24]
The effect of time on the stability of complexities at the best conditions was studied by measuring the absorbance of complex solutions under study at different times from the mixing time of the solutions to 180 min.
Result and Discussion
Physical Properties
The physical properties of the prepared compound M areshown in Table1 .
Table1: Physical properties data of the ligand M
Rec.Solvent Colour
M.wt Rf
Yield% M .P ˚C
Molecular formula NO
Ethanol White
508.39 0.72
74.8 264-266
C23H18BrN5O2S M
FT-IR Spectra
The FTIR spectrum (KBr, υ, cm−1) for M
component shows a characteristic stretching
absorption bands at 3442cm-1, 3205 cm-1,
3059cm-1,2865 cm-1, 1679cm-1, 1619 cm
-1assigned to υ(OH), υ(N-H) ,υ(C=C aromatic),
υ (C-H alphatic), υ(C=O) ,υ(C=N) of azomethine respectively [25].
Nuclear Magnetic Resonance Spectra
(1H-NMR)
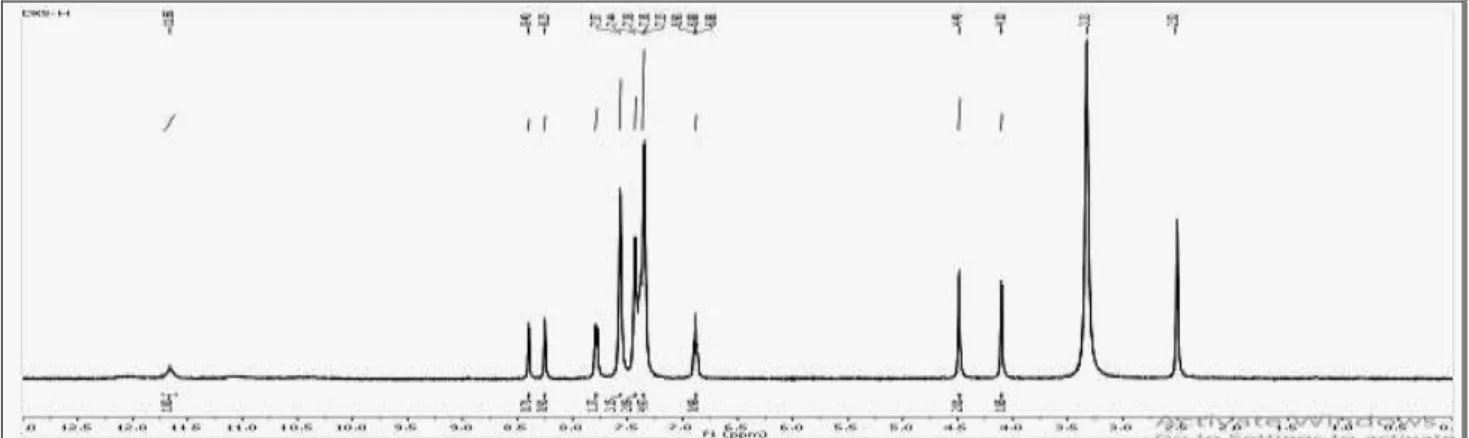
The 1H-NMR spectrum of M in DMSO-d6 and the chemical shifts (δ) were calculated in ppm downfield form TMS (tetamethylsilane) showed the following signals , singlet at 4.49 ppm refer to -SCH2CO- methylene protons
also singlet signal at 4.10 ppm for amide proton (NH) whearas anther multiplet signal at (6.87-8.25) ppm for aromatic protons and signal at 8.40 ppm for azomethine protons and signal broad peak at δ 11 ppm for hydroxyl, as shown in Figure (4).
Figure 2 : 1H- NMR analysis for M
Nuclear Magnetic Resonance Spectra
(13C-NMR)
The 13C-NMR spectrum in DMSO-d6 of
compound M shows the following signals signal at 32 ppm due to carbon atom of the (CH2) group and another signals at δ (111.5 -151.3 ppm) indicated to aromatic carbons in the phenyl ring .Beside that the signals at (154-164.1 ppm refer to (C=N) and signal at δ (169.5 ppm) for carbon atom of amid group (O=C-NH).
Mass Spectra of M
The mass spectra of ligand(M) appears molecular ion peak at 508 m/z which is in conformity with the molecular formula C23H18
Br N5O2S, other peaks m/z (,294, 253, 234,
180, 158, 131, 104,77, 51).
Ultra Violate-Visible Spectra
(determination of λmax
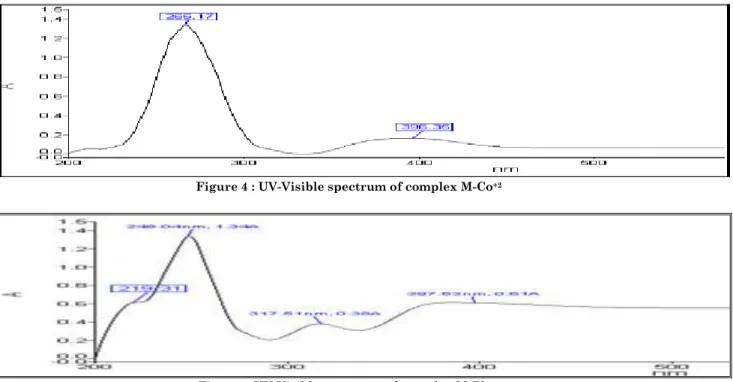
The UV- visible spectrum of the synthesized of the hydrazone solution in DMSO and methanol as asolvents were performed at room temperature in arange of (200- 900) nm. The hydrazone were composed of three main maximum absorption peaks that are shown in Figure (6) due to free reagents. The first at wavelength in arange of (271) nm due to transitions of (π → π*) in the aromatic ring[26] and the second absorption maximum has emerged at the wavelength λmax in the (334) nm due to the transition (n→π*) [27] which belongs to the bond C=N-) and (-C=O).
Spectrum UV – Vis shows absorption bands of the prepared complexes within studies range, the (π→π*) and (n→π*) transitions observed in the spectrum of reagents were shifted to longer wavelength (bathochromic effect) values along which confirm the chelation of the reagent with metal ions[28].
Figure 4 : UV-Visible spectrum of complex M-Co+2
Figure5: UV-Visible spectrum of complex M-Pb +2
Determination of the Stoichiometry of the Complex
The Continuous Variation Method (Job’s method)
Job’s method was used for the determination of the stoichiometry of the complexes. A series of solutions were prepared, with aconstant molar concentration of metal and ligand. The absorbance recorded at λmax. The results showed that the M:L ratio for all complexes are 1:1.
Molar Ratios
This method involves the preparation of a series of solutions containing a constant molten concentration for metallic ions and increasing molten concentrations for ligand, taking into account the use of the same volumes for ligand and metallic ions. The relationship between the molten ratio on the x-axis and the absorbance on
the yaw axis . The intersection of straight lines represents the proportion of ligande the metal involved in the installation of the complex or what is known as the mulality required to form the complex. The absorbance recorded at λmax. The results are showed that the M:L ratio for all complexes are 1:1.
Effect of Reaction Time
The effect of time to get the complex is an important factor to obtain knowledge of the time period which maintains the complex on stability that is especially employed in the field of analytical chemistry. The study was achieved at time (5-180) min. When the components were mixed at room temperature. The reaction remains stable for 24 hr. This shows the ligands strong coordination with metal ions [29].
Baer-Lambert Law
Table 2 Analytical Performance Summary No. Metal
ion
Complex color
λmax/ nm
Stability time/h
Complex stoi- chiometry
(M:R)
Beer’s law range/mg·L−1) )
10−4ε/(L· mol-1·cm-1)
Detection limit/ (mg·L−1)
pH
1 Co+2 violet 396 24 1:1 0.01-0.000001 9.8 0.04 7
2 Cd+2 green 389 24 1:1 0.01-0.000001 8.0 0.04 7
3 Pb+2 yellow 397 24 1:1 0.01-0.000001 8.5 0.03 7
Conclusion
Hydrazone [M] derived of the ethyl benzoate was synthesized, The synthesized compound was characterized by 1H-NMR, 13C-NMR,
UV-Visible, FT-IR, and Mass spectra.
with absorption peaks at 397, 389 ,and 396 nm, respectively. Under the optimal conditions, Beer’s law was obeyed over the ranges of 0.01- 0.000001 The apparent molar absorptivity and Sandell’s sensitivities were
8.5 ×102,8.0 ×103, and 9.8 ×10² L·mol−1·cm−1
respectively, and 0.00964, 0.00600, and 0.00275 µg·cm-2 respectively. The detection
limits were found to be 32.75, 41.85, and 40.66 µg/mL-2 respectively.
References
1. H Abd El-Wahab, M Abd El-Fattah, Ayman H
Ahmed, Ahmed A Elhenawy, Alian NA (2015) Journal of Organometallic Chemistry, 79: 199-106. 2. A John Maria Xavier, Manisha Thakur, Marie JM
(2012).
3. O Babaiah, C Kesava Rao, T Sreenivasulu Reddy, Reddy VK Talanta (1996) 43: 551-558.
4. P Jain, RP Singh (1982) Talanta, 29: 77.
5. B Budensinksy (1960) Chem. Listry, 54: 916.
6. VA Terentev, RK Andreeva Zh (1968) Analait.
Khim, 23: 10-89.
7. Mehrotra RC (1988) Comprehensive Coordination
Chemistry, Pergamon Press, New York, 269.
8. Chakravorty A (1997) Coord. Chem. Rev., 1: 413.
9. Rodriguez-Agüelles MC, Ferrari MB, Bisceglie F, et
al (2004) J. Inorganic Biochemistry, 98: 313. 10. Uehara K, Morimoto KK, Shijo Y (1992) Analyst,
117: 977.
11. Smith PAS (1996) The Chemistry of Open-chain
Organic Nitrogen Compounds, Benjiamin, New York, 2: 119.
12. Singh RB, Jain KP, Singh RP (1982) Talanta, 29: 77.
13. Pozo MEU, De Torres AG, Pavon JMC (1988)
Analyst, 113: 547.
14. Asuero A, Jimenez AM, Herrador MA (1986)
Analyst, 111: 74-79.
15. Gudasi KB, Shenoy RV, Vadavi RS, et al (2006) Journal of Molecular Structure, 788: 22.
16. Kuriakose M, Prathapachandra Kurup MR, Suresh
E Polyhedron, 2007, 26, 2713
17. Xiang J, Yin YG, Mei P (2007) Inorganic Chemistry
Communications, 10: 11-68.
18. (a)Dina A Najeeb, J Al-NahrainUniv., 14.(2011)
3.(b) Redha IH AL-Bayati, Mazin JH, Athraa H Mekky (2014) Synthesis of Novel Compounds
Derived from Saccharin, International Journal of Science and Technology, 3: 9.
19. Yasmin K, Mohammad S, Vijender S, Mohammad S
(2017) Applied Pharmaceutical Science, 7(07):158-167.
20. Reddy LR, Saravanan P, Corey EJ (2004) J.
Am.Chem. Soc., 126: 6230-6231.
21. (a)Athraa H Mekky, Sajida M Thamir (2012)
Synthesis, characterisation and antibacterial evaluation of some novel 1-
phenyl-1h-tetrazole-5-thiol derivatives, Int. J. Res. Pharm. Sci.,
10(2), 1136-1142 (b) Athraa Hameed Mekky, Zainab Abed Ali Mohammad,Sanaa Mahdi Auribi , Synthesis and biological activity of monocyclic Spiro Azetidine-2- one. Journal of Education for Pure Science- University of Thi-Qar, 2 (1): 67-74.
22. VG Vosburgh, GR Copper (1941) J. Amer. Chem.
Sco, 63: 437.
23. AE Haevy, DL Manning (1950) J.Am. Chem,Sco., 72: 44-88.
24. NV Sree Kumar, B Narayana, Prashant Hegde, BR
Manj Unatha, BK Sarojini (2003) Micro. Chem J.,74.
25. Redha IH AL-Bayati, Mazin J Habib, Athraa H Mekky (2015) Synthesis and Characterization of New Saccharin Derivatives, Int. J. of Multidisciplinary and Current research, 3.
26. SM Hezaveh, H Khanmohammadi, M Zendehdel
(2018) Spectrochimica Acta Part A Molecular and Biomolecular spectroscopy, 199: 21-31.
27. G Özkana, M Kösea, H Zenginb, V McKeec, M
Kurtoglua (2015) Spectrochimica Acta Part A: Molecular and Biomolecular Spectroscopy, 5 (150): 966-73.
28. KJ AL-Adilee, KA Abedalrazaq, ZMAL-Hamdiny
(2013) Asian J. Chem., 25 (18): 10475-10481.
29. KJ AL-Adilee, KA Abedalrazaq, Z M.AL-Hamdiny