Journal of Global Pharma Technology
Available Online at:
www.jgpt.co.in
RESEARCH ARTICLE
©2009-2019, JGPT. All Rights Reserved 730
Morphometric Assessment of the Cerebellum of the Pre-implanted
albino Rats Embryos after Maternal Exposure to AgNPs
Israa Hassan Ali
*,Lina Abdal-Muttalib Salih
University of Baghdad, College of Science, Biology Department, Iraq.
*Corresponding Author: Israa Hassan Ali
Abstract
©2009-2019, JGPT. All Rights Reserved 731
Keywords: AgNPs, Pre-implantation, Cerebellum, ED, Albino rats.
Introduction
Nanotechnology is the most important engineering technique development since the industrial period [1]. With the rapid development of nanotechnology and its applications, numerous nanotechnology based on consumer products have become available [2]. Silver nanoparticles (AgNPs) are emerging as one of the most usually used nanomaterials.
AgNPs exhibit strong antimicrobial and anti-inflammatory activity; thus, they have become widely employed in medical applications, personal care products, building materials, food packaging, and textiles [3]. Many studies on distribution of AgNPs demonstrated that these particles were transported mainly to the liver and the spleen but they were also found in brain, heart, lungs, kidneys and testes.
The blood-brain barrier (BBB) constitutes a distinctive and tightly regulated interface between the brain and the peripheral circulation [4]. AgNPs may disrupt the blood– brain barrier (BBB) integrity and reach the brain and inducing neuronal cell death. Continuous accumulations of AgNPs even at very low concentrations may result in neuronal degeneration and necrosis as AgNPs were proved to be highly neurotoxic [5].
To understanding how AgNPs induce the BBB dysfunction and the loss of brain protection could enable to develop nanomedical treatment and help to ensure that nanoparticles, which are not projected to reach the brain and do not cause adverse effects. Silver nanoparticles AgNPs are known to penetrate into the brain and cause neuronal death. Though, there is a small number studies examining the effect of AgNPs on the resident immune cells of the brain, microglia. Given microglia are implicated in neurodegenerative disorders such as Parkinson’s disease (PD) as [6].
Material and Methods
Animal Housing (Mating the Animals and Timing of Pregnancy)
In this study, 30 mature female Sprague-Dawley albino rats were used. They were purchased from animal house of national center for drug control and research.
The averages of weights were between 100-300g.All animals housed in the animal house of the department of Biology, College of Science- University of Baghdad, in plastic cages with a metal network cover under climate conditions, with temperature 22±2°C. Cages were cleaned and sterilized in different time with 70% ethanol. Rats were provided with water and food ad libitum daily. In this study after isolation of the sexually mature females which at the estrous stage by examine the vaginal smears under light microscope.
The isolated females put in breeding cages (each 2-3 females with one mature male) and left overnight. In the next morning, copulation was confirmed by examining the vaginal smears. The gestational day zero was defined as the day when spermatozoa were observed in the smear of the vaginal smears, and then females were transferred to separate cages without males and stay until the appropriate days to isolate the embryos [7].
Silver Nanoparticles (AgNPs) Preparation
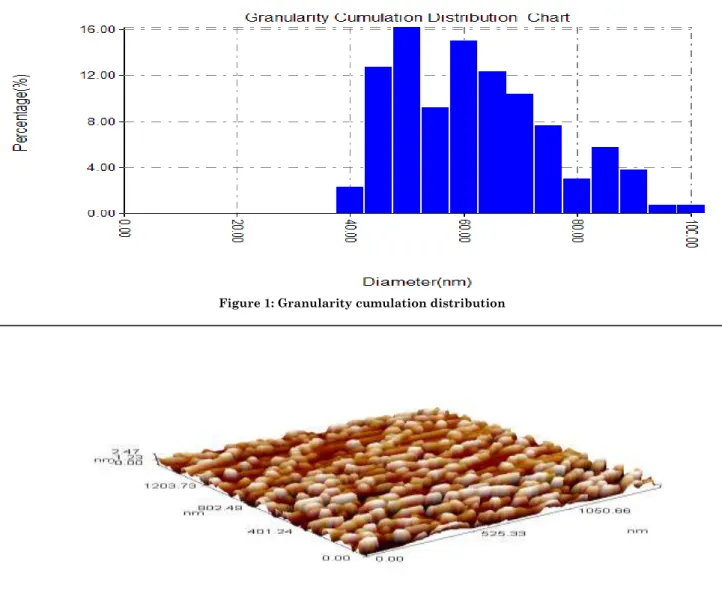
AgNPs were used in this study, it was purchased as grey black solid powder (purity 99.9 %, apparent density: 0.97g /ml, tap density: 2.16 g/ml and CAS NO.: 7440-22- 4) with an average diameter of (40-60) nm in diameter. AgNPs were prepared at a two concentrations, low concentration 2 mg/kg of body weight and high concentration 20mg/kg of body weight according to (3).
The AgNPs stock solution was prepared by suspending the calculated weight of AgNPs powder in a certain volume of deionized distilled water D.D.W in a sterile glass universal tube. The suspension was exposed to the ultrasonication technique by ultrasonic water bath for 2-3h in dark and under biological safety.
Characterization of AgNPs
©2009-2019, JGPT. All Rights Reserved 732
nanoparticles under SPM were showed in) Figure 2).
Figure 1: Granularity cumulation distribution
Figure 2: Spherical shape of AgNPs Chart
Administration of Ag NPs to Pregnant Female Rats
In this study, the AgNPs suspension was given to the treated groups (G2, G3) orally (gavage route) in a volume of 2 ml daily during pregnancy period by using polyethylene orogastric tubes (feeding tube ) connected to a syringe in appropriate size . The dosage was in milligram per kilogram body weight (mg/Kg/B.wt). D.D.W was used as the vehicle for AgNPs preparation, while the control group G1 was given D.D.W only.
Embryos Retrieved
The pregnant female albino rats were fully anesthetized by diethyl ether for several minutes. The female were killed to remove the embryos in different gestation days (GD). In this study, we selected embryonic day from ED 12 to ED 21, in treated and control groups, abdominal midline incision was performed, the two uterine horns were
exposed, the embryos were extracted from the placental sacs, and the extra-embryonic membranes were removed, rinsed in normal saline, then the embryo’s brain were retrieved and stained in H&E for morphometrical examination.
ED12 transferred immediately to the Bouin’s solution for fixation, embryos at ED15, 18 and 21 the skulls were removed and cerebellum was isolated from brain carefully by incision along the dorsal aspect, under the dissecting microscope, blotted dry with filter paper. All the samples were fixed in the Bouin’s solution for 24-48h and were transferred to 70% ethanol until the time of the histological section [8]. Then everyone the sections prepared for morphometrical examination.
Morphometric Measurements
©2009-2019, JGPT. All Rights Reserved 733
using the Motic Image Plus version 2.0 software programs 2004 on the personal computer, this version was downloaded to the computer and the recommended digital pictures of the many serial sections of the embryos were measured in some appropriate parameters of the morphometric parameters. The Motic Image plus 2.0 programs 2004, parameters were employed for the evaluation of the embryonic development of the cerebellar anlage during different embryonic stages by using only the serial midsagittal section of the cerebellum anlage.
The morphometric parameters were used to the midsagittal sections of the embryo’s brain.
•Area mm2.
•Perimeter mm2.
•Antero-Posterior Diameter (APD µm) or called rostro-caudal diameter
•Transverse Diameter (TD µm)
Statistical Analysis
In this study the Statistical Analysis System- SAS was used to find the morphometric analysis of cerebellum during the embryo development, in this study the two treatment groups in the embryos were compared to their control group. The least significant difference-LSD test at the comparison between means was done on the level 0.05 to
detect the significant effect of the different concentrations on the development of the cerebellum in embryos [9].
Results
Control Group
During normal development of the metencephalon and later the cerebellum in the embryos of the albino rats, these embryonic structures undergo several morphological changes due to the alterations in the dimension of their shape, this alteration we tried to detect them by using the morphometrical analysis through many selected parameters. In the present study, we attempted to evaluate the effect of AgNPs on the ontogenesis of the metencephalon quantitatively. Therefore (area, perimeter, anterior-posterior diameter and transverse diameter) were selected as morphometric parameters in this study.
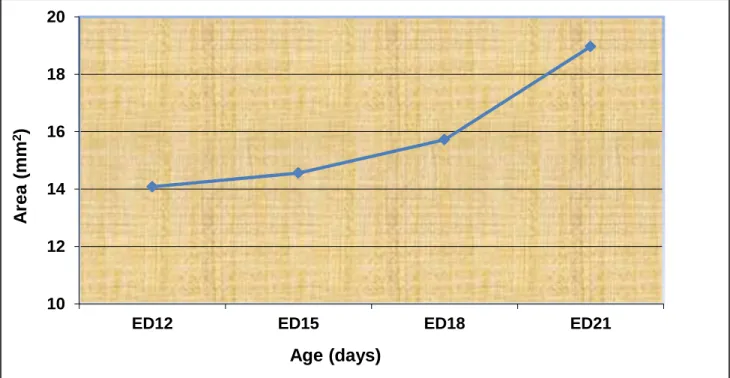
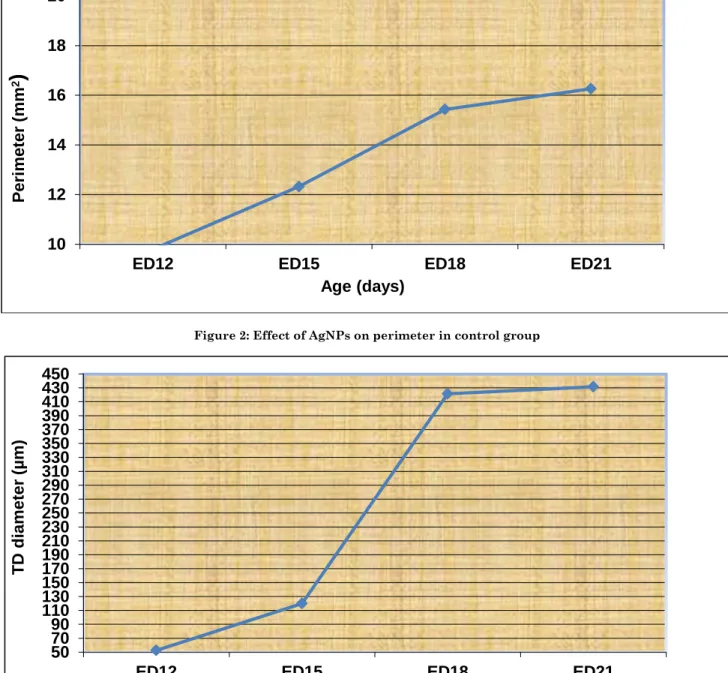
The data of area, perimeter and transverse diameter (TD) of the normal development metencephalon and cerebellum cb was increased significantly (P˂0.05) along the selected embryonic days until reach to the maximum growth at last stage of embryonic development at ED21, while the APD of the normal development of metencephalon and cb was also increased during embryonic development but decreased after ED18 (Figures 1, 2, 3 and 4) and also appearance in (Table 1).
Figure 1: Effect of AgNPs on area development in control group
10 12 14 16 18 20
ED12 ED15 ED18 ED21
A
re
a
(mm
2
)
©2009-2019, JGPT. All Rights Reserved 734
Figure 2: Effect of AgNPs on perimeter in control group
Figure 3: Effect of AgNPs on TD in control group
Figure 4: Effect of AgNPs on TD in control group
10 12 14 16 18 20
ED12 ED15 ED18 ED21
P
eri
met
er
(mm
2
)
Age (days)
50 70 90 110 130 150 170 190 210 230 250 270 290 310 330 350 370 390 410 430 450
ED12 ED15 ED18 ED21
T
D
diamet
er
(µm)
Age (days)
200 220 240 260 280 300 320 340 360 380 400 420 440 460 480 500
ED12 ED15 ED18 ED21
A
P
diamet
er
(µm)
©2009-2019, JGPT. All Rights Reserved 735
Table 1: morphometric analysis of cerebellum in control group in different selected embryonic stage
TD diameter (µm) AP diameter (µm)
Perimeter (mm2)
Area (mm2)
Age (days)
52.6308 367.0041
9.804 14.0815
ED12
120 454.011
12.324 14.561
ED15
421.574 364.48
15.431 15.721
ED18
431.6 225
16.267 18.969
ED21
256.45±59.2 352.62±47.3
13.45±1.48 15.83±1.10
mean
Treated Groups
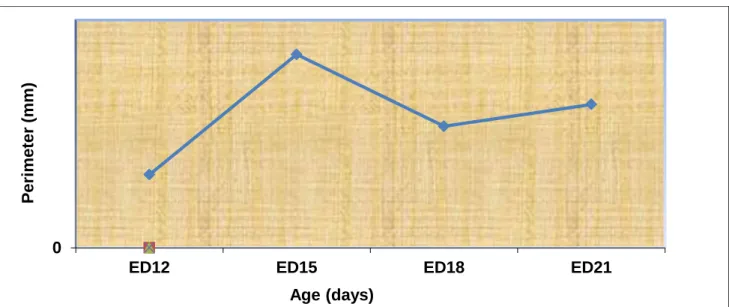
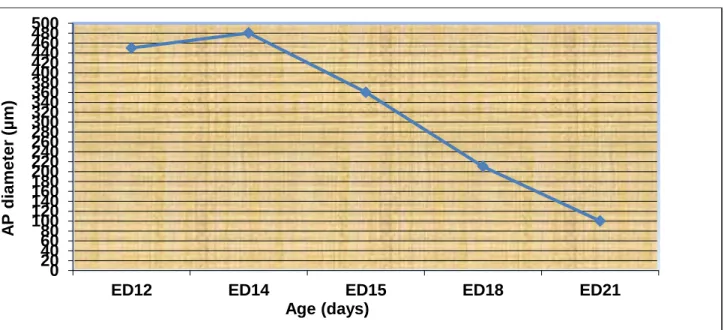
In the G2 and G3 treated groups, all the morphometric parameters of the development metencephalon except the area, the result showed significant increase (P≤0.05) until reach to the maximum growth at ED14. After this embryonic day the dimensions of growing cerebellum were decreased significantly (P≤0.05) compared with control group. In the area measurement, the results was found an increase in the total area of the cb as in the control group but not reach to the
optimal growth at ED21, while reach to the maximum value at ED18 then the cb growth was inhibited (Figures 5, 6, 7 and 8) and in the G3group as showed in (Figures 9, 10,11and 12) The mean of this ED in both doses when compare with control group as showed in (Figures 13,14,15 and 16) and this parameters present in (Table 2 and 3). The statistical analysis between low dose (G2) and high dose (G3) of the AgNPs was shown that the higher dose has more deleterious effects on the area and the TD of the growing cb than the lower dose (Table 4).
Figure 5: Effect of AgNPs in 2 mg concentration on area
Figure 6: Effect of AgNPs in 2mg concentration on area
40 50 60 70 80 90 100 110 120 130 140 150
ED12 ED15 ED18 ED21
A
rea
(mm
2)
Age (days)
0
ED12 ED15 ED18 ED21
P
eri
met
er
(mm
)
©2009-2019, JGPT. All Rights Reserved 736
Figure 7: Effect of AgNPs in 2mg concentration on AP diameter
Figure 8: Effect of AgNPs in 2mg concentration on T diameter
And the results in higher dose showed as Figure 9, 10, 11 and 12.
Figure 9: Effect of AgNPs in 20 mg concentration on the area
0 20 40 60 80 100 120 140 160 180 200 220 240 260 280 300 320 340 360 380 400
ED12 ED15 ED18 ED21
AP
diamet
er
(µm)
Age (days)
0 20 40 60 80 100 120 140 160 180 200 220 240 260 280 300 320 340 360 380 400 420 440 460 480 500
ED12 ED15 ED18 ED21
TD
diam
eter
(
µ
m)
Age (days)
0 20 40 60 80 100 120 140 160 180 200
ED12 ED14 ED15 ED18 ED21
A
rea(m
m
2)
©2009-2019, JGPT. All Rights Reserved 737
Figure 10: Effect of AgNPs in 20mg concentration on the perimeter
Figure 11: Effect of AgNPs in 20mg concentration on the AP diameter
Figure 12: Effect of AgNPs in 20mg concentration on the T diameter
0 0.4 0.8 1.2 1.6 2
ED12 ED14 ED15 ED18 ED21
P
eri
met
er
(mm
2)
Age (days)
0 20 40 60 80 100 120 140 160 180 200 220 240 260 280 300 320 340 360 380 400 420 440 460 480 500
ED12 ED14 ED15 ED18 ED21
A
P
diamet
er
(µm)
Age (days)
150 170 190 210 230 250 270 290 310 330 350 370 390 410 430 450 470 490 510 530 550 570 590 610 630 650
ED12 ED14 ED15 ED18 ED21
T
D
diamet
er
(µm)
©2009-2019, JGPT. All Rights Reserved 738
Figure 13: Effect of G2 and G3 of AgNPs on area of cb compare of control group
Figure 14: Effect of G2 and G3 of AgNPs on perimeter of cb compare of control group
Figure 15: Effect of G2 and G3 of AgNPs on AP diameter of cb compare of control group
0 20 40 60 80 100 120
G1:
Control
G2
G3
15.83 c
78.69 b
113.03 a
Ar
ea
The Groups
0 2 4 6 8 10 12 14
G1: Control G2 G3
13.45 a
1.75 b
0.205 c
P
er
im
ete
r
The Groups
0 100 200 300 400
G1: Control
G2
G3
352.62 a
248 b
280.28 b
AP
d
iam
ete
r
©2009-2019, JGPT. All Rights Reserved 739
Figure 16: Effect of G2 and G3 of AgNPs on TD of cb compare of control group
Table 2: Effect of different parameters on development of cerebellum in treated group with 2mg/kg/B.wt pre implantation
TD diameter (µm) AP diameter (µm)
Perimeter (mm2)
Area (mm2)
Age (days) 259.341 188.788 0.964 47.437 ED12 606.2384 796.8767 3.221 50.80 ED14 498.809 341.299 2.548 68.21 ED15 436.203 330.415 1.601 130.220 ED18 121.7 131.5 1.889 68.909 ED21 329.01±45.71a 248.00±52.10 b 1.75±0.32 b 78.69±17.88b mean
Table 3: Effect of different parameter on development of cerebellum in treated group with 20mg/kg/B.wt pre implantation
TD diameter (µm) AP diameter (µm)
Perimeter (mm2)
Area(mm2)
Age (days) 600.11 450.11 0.256 80.11 ED12 522.71 480.44 1.321 94.34 ED14 400.5744 360.48 0.543 125.13 ED15 300.11 210.33 0.021 140.56 ED18 188.12 100.21 0.001 100.21 ED21 372.23±47.47 280.28±77.78 0.205±0.12 113.03±13.95 mean
Table 4: Compare between G2 and G3 of AgNPs on development of cerebellum by using different parameters (pre-implantation)
The groups Area (mm2)
Perimeter (mm2)
APD
(µm) (µm) TD
G2: 2mg / day 78.69±17.88 b 1.75±0.32 a 248.0±52.10 a 329.01±45.71a G3: 20mg/ day 113.03±13.95 a 0.205±0.12 b 280.28±77.78 a 372.23±47.47 a
LSD 16.483 * 0.492 * 57.81 NS 64.07 NS
* (P<0.05), NS: Non-Significant
Discussion
These normal morphometrical changes that occurred in the cerebellum may be due to the normal response of the early development of cb to changes in its shape. The vertical feature through early growth of the cerebellum anlage by projection from the metencephalon and undergo to several histological changes and formation of fissures and folia in the cortex of cb after ED15 when it’s shape will convert to the vertical shape rather than horizontal shape [10]. From the previous results, observed many different alterations may be occurred on the dimension of the early developing cb when exposed indirectly to the action of the silver
nanoparticles through the placenta and BBB during the neurogenesis process.
This process includes many dynamics movements of the stem cells from the neuroepithelium of the nerve tube and proliferate to many kinds of cells differ in morphology and physiology [11].The expansion in the cerebellum is linked with the proliferation of the EGL and migration of precursor cells to the IGL. The migration from the ventricular zone to the deep cerebellar nuclei is conclusion near gestational week 30 in human and after ED18 in rats [12, 13]. Increased the area of the development cerebellum may occurred result of nanoparticles effect on neuron and
0 100 200 300 400
G1:
Control
G2
G3
256.45 b
329.01a
372.23 a
©2009-2019, JGPT. All Rights Reserved 740
glial cell in cerebellar cortex and formation depletion and dispersed and form intracellular space of cortex cells may be lead to increased the area in treated groups. On the other hand, found that AgNPs exposure could attenuate the viability of rat cerebellum granule cells through apoptosis and may be leaded to reduce neurons in the cortex then decreased the perimeter after ED15.
Reduce the formation and differentiation of the granule cells and Purkinje cells which are formed the developing cortex, as [14]. The cerebellar ratio of total brain volume found increased significantly from 2.4% to 3.7% more than during period of embryonic development in all mammals. Therefore; the cerebellum was increasing in size relatively faster than the cerebrum [15].
In the treated groups revealed significant decrease after ED15 compare of control group, this may be due to effect of silver nanoparticles on mitosis and proliferation of granular cells during development lead to less dense of EGL compare of control results and these unstable decreased results of unregulated migration of granule cells. Yin et al., (2015) suggested that when AgNPs treatment in (1 mg/kg/day) caused obvious distortions in both Purkinje layer and granular layer.
The granular layer was degenerated with loosen and separated structure, and the Purkinje layer was not distinct due to the deficiency of Purkinje cells, therefore observed unregulated development in both APD and TD.
References
1. Allen DC, Cameron RI (2004) Histopathology specimens: clinical, pathological and laboratory aspects. London: Springer.
2. Arora S, Rajwade JM, Paknikar KM (2012) Nanotoxicology and in vitro studies: 164 the need of the hour. Toxicol. Appl. Pharmacol., 258: 151-165.
3. Charehsaz M, Hougaard KS, Sipahi H, Ekici Asiye, IDÇ Kaspar, Culha M, Bucurgat ÜÜ Aydin A (2016) Effects of developmental exposure to silver in ionic and nanoparticle form: A study in rats. DARU. J. Of Pharma. Sciences, 24: 24. 4. Gottesman R, Shukla S, Perkas N,
Solovyov LA, Nitzan Y, Gedanken A (2011) Sonochemical coating of paper by microbiocidal silver nanoparticles, Langmuir, 27(2): 720-726.
5. Gonzalez-Carter DA, Leo BF, Ruenraroengsak P, Chen S, Goode AE, Theodorou IG et al (2017) Silver nanoparticles reduce brain inflammation and related neurotoxicity through induction of H 2 S-synthesizing enzymes. Scientific reports, 7: 42871.
6. SAS (2012) Statistical Analysis System, User's Guide. Statistical. Version 9.1th ed. SAS. Inst. Inc. Cary. N.C. USA.
7. Scott JA, Hamzelou KS, Rajagopalan V, Habas PA, Kim K, Barkovich AJ, Glenn OA, Studholme C (2012) 3D Morphometric Analysis of Human Fetal Cerebellar
Development. Cerebellum. NIH-PV, 11(3): 761-770.
8. Scott JA, Habas PA, Kim K, Rajagopalan V, Hamzelou KS, Corbett-Detig JM, Studholme C (2011) Growth trajectories of the human fetal brain tissues estimated from 3D reconstructed in utero MRI. Int. J. Dev. Neurosci., 29(5): 529-536.
9. Sokołowska P, Białkowska K, Siatkowska M, Rosowski M, Kucińska M, Komorowski P et al (2017) Human brain endothelial barrier cells are distinctly less vulnerable to silver nanoparticles toxicity than human blood vessel cells: A cell-specific mechanism of the brain barrier?. Nanomedicine: Nanotechnology, Biology and Medicine, 13(7): 2127-2130.
10.Skalska J, Frontczak-Baniewicz M, Strużyńska L (2015) Synaptic degeneration in rat brain after prolonged exposure to silver nanoparticles. Neurotoxicology, 46: 145-154.
11.Triulzi, F, Parazzini C, Righini A (2006) Magnetic resonance imaging of fetal cerebellar development. The cerebellum, 5(3):199-205.
12.Volpe JJ (2009) Cerebellum of the premature infant: rapidly developing, vulnerable, clinically important. J. Child. Neurol., 24(9): 1085-1104.
©2009-2019, JGPT. All Rights Reserved 741
weight and neurotoxicity in rats. Biochemical and Biophysical research communications, 458(2): 405-410.
14.Yin N, Liu Q, Liu J, He B, Cui L, Li Z, Yun Z, Qu G, Liu S, Zhou Q, Jiang G (2013) Silver nanoparticle exposure attenuates the viability of rat cerebellum granule cells through apoptosis coupled to oxidative stress. Small, 9: 1831-1841.
15.Yin N, Zhang Y, Yun Z, Liu Q, Qu G, Zhoua Q, Hu L, Jiang G (2015) Silver
nanoparticle exposure induces rat motor dysfunction through decrease in expression of calcium channel protein in cerebellum. Toxicology letters, 237 (2): 112-120.