Munich, Germany 2
Department of Informatics, Technical University of Munich, Garching, Germany E-mail:[email protected]
CO
Authors contributed equally to this work
Received: 1 April 2019 / Last revision received: 11 June 2019 / Accepted: 6 August 2019
DOI:10.17815/CD.2019.21
Abstract Pedestrian dynamics is an interdisciplinary field of research. Psychologists, so-ciologists, traffic engineers, physicists, mathematicians and computer scientists all strive to understand the dynamics of a moving crowd. In principle, computer simulations offer means to further this understanding. Yet, unlike for many classic dynamical systems in physics, there is no universally accepted locomotion model for crowd dynamics. On the contrary, a multitude of approaches, with very different characteristics, compete. Often only the experts in one special model type are able to assess the consequences these char-acteristics have on a simulation study. Therefore, scientists from all disciplines who wish to use simulations to analyze pedestrian dynamics need a tool to compare competing ap-proaches. Developers, too, would profit from an easy way to get insight into an alternative modeling ansatz. Vadere meets this interdisciplinary demand by offering an open-source simulation framework that is lightweight in its approach and in its user interface while offering pre-implemented versions of the most widely spread models.
Keywords Pedestrian dynamics · microscopic simulation · open-source· software · framework
1. Introduction
Pedestrian dynamics is an active and versatile research area that attracts scientists from sociology and psychology to engineering, computer science and mathematics. This inter-disciplinary scientific community shares a common goal: to enhance the understanding of crowd behavior. Scientists approach this goal from different angles: For example, sociol-ogists and psycholsociol-ogists observe and analyze the human behaviors that affect pedestrian movement [1]. They describe their findings verbally. Mathematicians and physicists mold the observed behavior into equations [2]. Computer scientists develop computer models based on these equations [3]. Each researcher wants to get new insights by using different but connected techniques and by asking different but connected questions.
The interdisciplinary character of pedestrian dynamics entails communication prob-lems and misunderstandings: For example, the term “agent” [4] used by computer sci-entists to denote a simulated pedestrian may not be immediately understood as such by psychologists. The term “crowd” has a very rich meaning for social psychologists [5–7] while a physicist may simply think of an aggregation of individuals like an aggregation of particles [8]. A third prominent example is the term “panic”. While panic is considered as myth by sociologist and human behaviour scientists [9], this word is still used by many computer scientists [10,11]. Thus terms might even be misleading in an interdisciplinary group. The consequences of these language difficulties go beyond research as soon as decision makers at crowded events, such as city planners and the police apply research results.
A pedestrian simulation tool reflects the interdisciplinary character of the field. Be-haviors that were observed and described by empirical scientists are operationalized, then mapped to equations, algorithms, and finally computer programs. These computer pro-grams can be executed to reenact real scenarios in a virtual world, where they can be re-observed. Therefore, they are a powerful tool to foster interdisciplinary understanding in pedestrian dynamics.
Laboratory and field experiments are essential to understand pedestrian behavior, but they need participants and bind a lot of scientific and non-scientific human resources. Here simulations can help out [12,13]. Also, they are generally more time-efficient. Generating data such as trajectories is easy and often fully automated, while to this day, extracting trajectories from video footage remains a semi-manual process. Parameter variation is straight forward while it is costly and time-consuming in controlled experi-ments and impossible in field observations. Aside from practical and economic consider-ations, simulations can address situations that would be unethical in an experiment, e. g. situations with dangerously high densities. Beside simulations, virtual and augmented reality environments offer possibilities to test such critical scenarios without endangering probands [14–16].
In addition, scientists can learn from studying the model, that is, the set of equations itself, provided the model matches reality sufficiently well. Whether a match is good or not depends on the particular research question.
1970 1980 1990 2000 2010 2020 Year
0 50 100 150 200
#Publications
(a) Publications per year
27.6% 17.8%
Mathematics 15.6%
Physics and Astronomy
9.6%
Social Sciences
7.7%
Environmental Science
4.8% Others
16.8%
(b) Overall publications per subject
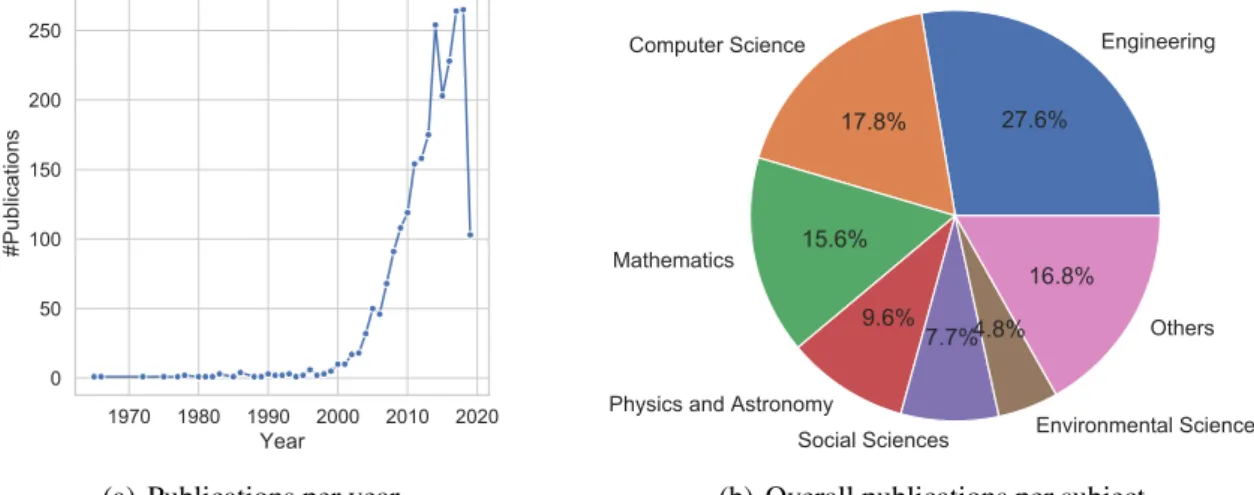
Figure 1 Scopus search result for the term “pedestrian dynamics” on the 5th of June in 2019. Overall 2422 document are listed.
One way to categorize pedestrian simulation models is by their scale: macroscopic and microscopic [20]. For both categories, the goal is to reproduce coarse-scaled quantities like densities (measured in persons per area) or flow (measured in persons per second). While macroscopic models, such as [21,22], see the crowd as a continuum, microscopic models see it as an aggregate of individuals. Consequently, individuals are simulated based on their distinct attributes, such as their desired speeds. In addition to coarse-scaled quantities, fine-scaled quantities like the velocity or step length of a pedestrian at a certain time can be measured. Therefore, fine-scaled phenomena observed in the real world, such as the decrease in step length with increasing density, can be reproduced as well.
Microscopic models are often conceptually divided into three levels: (1) the strategic level: activity choice, (2) the tactical level: activity schedule, area and route choice to reach the area and (3) the operational level: walking behavior. A description can be found in [23]. The operational level, that is, the walking behavior, is embodied by a specific locomotion model.
In short, even on the locomotion level alone, practitioners and researchers can pick and choose from a rich selection of solution proposals that may or may not be suitable for their research question. For example, in a large and open field scenario with millions of pedestrians a fast cellular automaton model may be a good, and perhaps the only choice, to gain first insights, while it will fail in situations with fine granularity. It is very difficult to make decisions on model descriptions alone.
This is where we introduce Vadere. It is a free and open-source pedestrian simulation framework for microscopic pedestrian dynamics that was expressively conceived to fa-cilitate comparison between locomotion models. Thus, it comes with pre-implemented versions of the most widely spread locomotion models. Vadere is released under the LGPL license.
Alternative implementations of the above-mentioned models are offered by a large number of commercial simulators, like PTV (social force model), LEGION (unknown model) and accu:rate (optimal steps model). However, to understand the dynamics of a simulation, not only the mathematical formulation of the model but also its implemen-tation must be known and well understood. Indeed, the mathematical description will often differ from its implementation [40]. For example, the mathematical model defini-tion might be through an ordinary differential equadefini-tion (ODE) as in force based models. The algorithmic formulation, on the other hand, is through a numerical solver, such as Euler’s method, which may – or may not – converge to the solution of the ODE. See [41] for numerical issues. Another example is the use of different pseudo random number generators with different starting seeds. We assume a world of irrational numbers and true random numbers which do not exist in the coding world. Those details are often not mentioned in the model description. Thus, easy access to the code is a key requirement.
Several other open-source pedestrian dynamics simulators exist, for example FDS+Evac [42], JuPedSim [40], Menge [43], MomenTUMv2 [44] and SUMO [45]. All frameworks share common conceptual characteristics but differ in their goals. Vadere is a lightweight simulator. The framework focuses on comparing existing and implementing new loco-motion models and, at this point, solely covers the operational level, to keep the core simple and expandable. Developers can focus only on the model code, the rest is offered by the common code base. As a consequence, Vadere offers modern algorithms and data structures, and many more tools like a graphical user interface (GUI), Python scripts to compare simulation outputs and a command line interface to run multiple simulations in a systematic manner. All those features support and simplify the scientific work, especially the calibration and validation of locomotion models whose importance is emphasized in [40]. In the spirit of interdisciplinary collaboration, the secondary focus of Vadere is its usability, which we continuously improve. The open-source approach allows other researchers to use and extend Vadere to their needs.
2.1. Locomotion models
In order to simulate realistic pedestrian behavior, adequate locomotion models are neces-sary. Researchers of various areas have been studied the way pedestrians move and have translated their findings into mathematical models.
Historically, three development phases of locomotion models can be observed. In 1984, Stephen Wolfram introduced the idea of a cellular automaton to describe “systems con-structed from many identical components, each simple, but together capable of complex behavior” [17]. Gipps and Marksj¨o picked up this idea to describe “interactions between pedestrians” [25] through a cellular automaton.
The second phase started with Helbing und Moln´ar’s publication of the social force model (SFM) in 1995 [2]. They renewed the idea of using “forces” to describe pedestrian movements that was introduced by Hirai and Tarui in 1975 [46]. In the SFM, pedestrian motion is driven by a superposition of forces called “social” forces that, according to the authors, represent a “measure for the internal motivation of the individuals to perform certain actions (movement)” [2]. The SFM was extended by several researchers such as [31] to cope with some of its problems like the treatment of inertia.
The current third phase started around 2000 when model development further branched out. ODE-based modeling turned from second order equations present in the SFM to first order equations, thus eliminating several artifacts known in the SFM [47]. The re-sults are so-called velocity-based models [33,34]. At the same time several more model types emerged: velocity-obstacle-based models [48–50] for collision avoidance inspired by robotics, rule-based models such as [35,36] and models which combine different ap-proaches like the optimal steps model (OSM) [19]. Most models have been adjusted and extended to fit the findings from interdisciplinary experiments and studies. For example, the OSM was extended based on the (inter-) personal space theory [37,38] and the social identity theory [39].
Cognitive heuristics, social forces, Newtonian mechanics, velocity obstacles, social identities and personal space theory, computational geometry, queuing theory, cellular au-tomata, and even fuzzy logic are ideas and techniques used in the development of modern microscopic pedestrian models. This shows that the exact nature of microscopic pedes-trian behavior is open to debate. The scientific discourse will continue and the number of models will further increase. As a result, scientists need a software to compare them all.
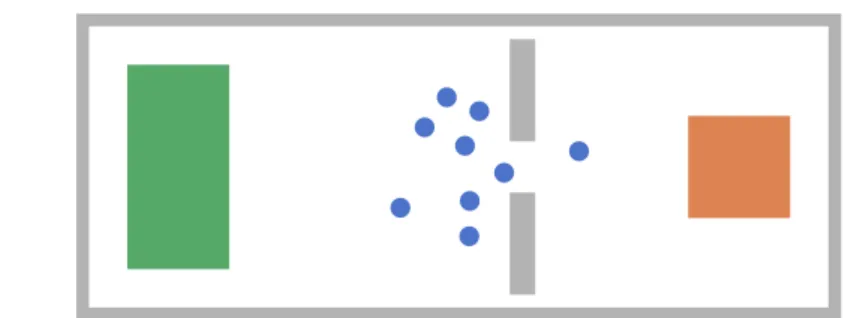
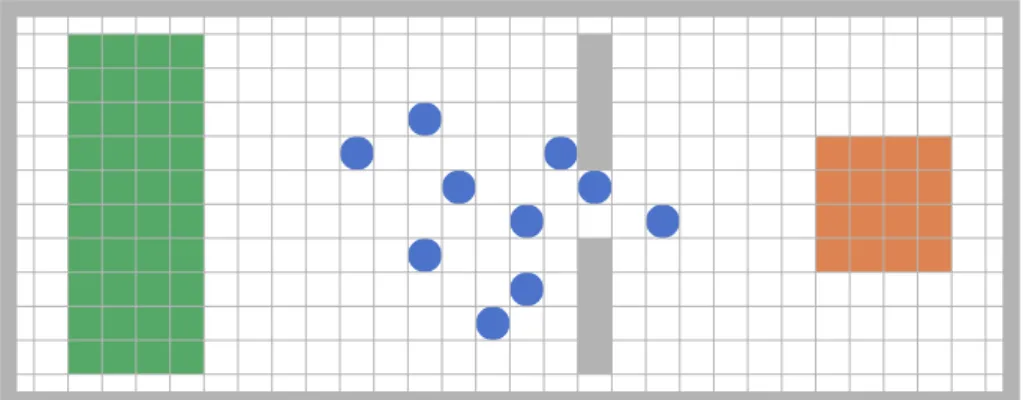
Figure 2 The four basic components of pedestrian crowd simulations: (1) agents (blue) who move from a (2) starting point (green) to a (3) destination (red) while avoiding (4) obstacles (gray).
are widely used: cellular automata, forced based models and the optimal steps model.
2.1.1. Common ground for all locomotion models
Topography All locomotion approaches that we describe here use four basic modeling components: (1) agents — simulated pedestrians — who move from a (2) starting point (also called source or origin) to a (3) destination or target while avoiding (4) obstacles and other agents. These four basic components are illustrated in Fig.2. Together they form what we call topography.
(a) Euclidean distance ignores obstacles. (b) Geodesic distance considers obstacles.
Figure 3 Differences in pedestrian routing when using the Euclidean distance and the geodesic distance as a basis for calculating floor fields.
(a)t=0s (b) Static floor field (f =1).
(c)t=6s (d) Dynamic floor field,t=6s
(e)t=32s (f) Dynamic floor field,t=32s
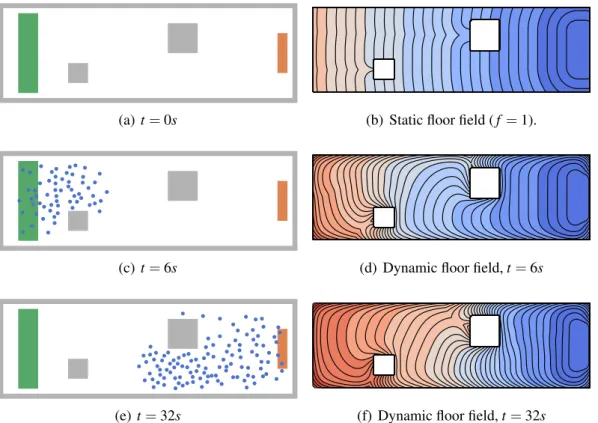
Figure 4 Dynamic floor fields: The situation is illustrated on the left. The traveling timeuis plotted on the right. The wave propagates from the destination area (red) and flows around obstacles (gray). Dark blue colors represent small values ofu(x)while brighter blue and red colors represent higher values ofu(x). For a pointxinside an obstacle, the wave stops (speed f(x) =0), i. e., the travel time is infinite (u(x) =∞). For a dynamic floor field fdepends on the current density with respect to pedestrians and obstacles.
geodesic distance between a destination and each position in the topography. The eikonal equation is a non-linear partial differential equation:
||∇u(x)||f(x) =1 forx∈Ω⊂R2
u(x) =0 ifx∈Γ. (1)
The solutionuof the eikonal equation is the travel time of a wave front that starts at the target regionΓ⊂Ωand propagates across the topography areaΩwith speed f ≥0. For
all positions inside obstacles, f is zero, that is, the wave stops. Compare to Fig. 4. If
xwhile skirting obstacles. To achieve more realistic medium scale avoidance behavior, one can choose a speed function f for the wave front that depends on the pedestrian density. By lowering f at crowded locations, that is slowing the wave down, medium-scale avoidance of other pedestrians can be modeled [52,53]. In this case, the floor field becomes dynamic and must be recomputed regularly.
Recently, a lot of progress has been achieved in the calibration of navigation fields in the context of cellular automata. For example, in [54,55] the authors use empirical trajectory data to improve the static floor field of their model. This data-driven approach might be beneficial beyond cellular automata. Analyzing the influence of floor fields and calibrating them on empirical evidence is an important task which could be supported by Vadere.
2.1.2. Cellular automata (CA)
Stephen Wolfram generalized the idea of a cellular automaton:
Cellular automata are mathematical idealizations of physical systems in which space and time are discrete, and physical quantities take on a finite set of discrete values. A cellular automaton consists of a regular uniform lattice (or “array”), usually infinite in extent, with a discrete variable at each site (“cell”). [...] A cellular automaton evolves in discrete time steps, with the value of the variable at one site being affected by the values of variables at sites in its “neighborhood” on the previous time step. [56]
In the context of pedestrian dynamics, the concept of CA is implemented as follows. The topography area is divided into cells of equal shape that are either empty or occupied by a pedestrian, a target or an obstacle. The state of a cell is updated at each time step, that is, agents move from cell to cell according to certain rules. In most CA-models for pedestrian dynamics the rules depend on a floor field as described above and positions are updated instantaneously. There are several ways to define the update order of pedestrians. The order in which pedestrians are updated has an impact on the simulation outcome [57]. It is rarely parallel, to avoid collisions, and thus differs from Wolfram’s original definition of cellular automata. Furthermore, the state of a cell is not purely defined by the state of neighboring cells but also by some global information. Fig.5visualizes the concept of a cellular automaton at one specific time step.
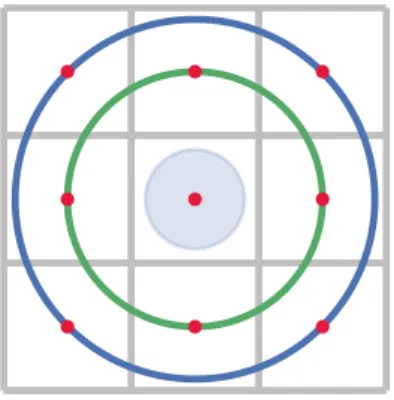
Figure 5 Cellular automaton based on an evenly-spaced grid over the topography content. Agents move from a source (green) green area to a target (red).
Vadere implements cellular automata as a special case of the optimal step model where certain constraints hold. See Sec.2.1.4. Thus, the Vadere implementation does not do jus-tice to the computational efficiency a cellular automaton can achieve. However, it allows scientists to judge for themselves whether or not the grid artifacts would compromise the validity of their simulation study.
Shortest Path
Simulated Path
(a) Movement artifacts: Agents walk in a zig-zag manner.
(b) Impact of the grid resolution: A too coarse grid hinders agents to pass through a narrow passage.
Figure 6 Two drawbacks when using cellular automata: movement artifacts and impact of the grid reso-lution on the motion.
2.1.3. Force-based models
In 1975 a first force-based model, inspired by the motion of a shoal, was introduced in Japan [46]. Four years later, [59] proposed a model inspired by forces between magnets. The best known and analyzed force-based model is Helbing’s and Moln´ar’s social force model (SFM) from 1995 [2]. Extensions were proposed by Helbing and his group [60,61] as well as others [31,41,62–65]. Agents are treated like particles that are accelerated or decelerated by “social” forces taking Newton’s second law of dynamics as a guiding principle. The primary force Flt of all these models is the force that drives an agent l
towards its destination
Flt = 1
τl
Herev0l is the agent’s free-flow velocity,xl its position,el the direction pointing towards the target region andτl the agent’s reaction time. If the agent can move unhindered, that is, if there are no obstacles or other agents, this is the only force affecting the agent. In the following, we describe the SFM in its original form without its extensions.
While obstacles always evoke a repulsive force pushing agents away, forces defined between two agents can either attract, e. g. to model groups, or repulse. Acceleration is described through
˙
wl=Fl+f luctuation, (3) wherewl is the unrestricted velocity induced by the sum of all forcesFlacting on agentl
[2]. The f luctuationterm was added to take random variations into account. The actual velocity ˙xlof agentlis limited to some maximum speedvmaxl :
˙
xl=vl(wl) =
(
wl if||wl|| ≤vmaxl wlv
max l
||wl|| otherwise.
(4)
In its original version, the direction towards the target el is the normed vector pointing to the closest point of the target region. This entails numerical problems when an agent “steps” on the target [41]. Instead the normed gradient ofu(xl)at the agent’s positionxl, defined by Eq.1, that is
el = −∇u(xl)
||∇u(xl)||
, (5)
gives a more sophisticated definition of the target direction [66] which is used in Vadere. The social force model has been reported to reproduce collective phenomena like lane formation, the “faster-is-slower” effect, oscillations at bottlenecks and clogging at exit doors [31]. Johansson et al. provide an overview of extensions of the social force model, such as the inclusion of physical forces, a constrained interaction range and limiting the number of other pedestrians considered [67]. The social force model is very popular, but it has also been criticized for artifacts that stem from its proximity to Newtonian mechanics, namely oscillating trajectories and overlapping agents [47,68], and for numerical issues [41]. Another problem of all force-based models arises with the multiple roles of the relaxation time τl in Eq. 2. It affects how precisely agents follow their preferred path,
and at the same time, how they avoid collisions [67]. These two behaviors may not be correlated. The authors believe that it is up to the scientists to decide which artifacts can be tolerated in view of their specific research questions. Vadere facilitates this decision: scientists can visually compare simulation outcomes for test scenarios of their choosing.
2.1.4. Optimal steps model (OSM)
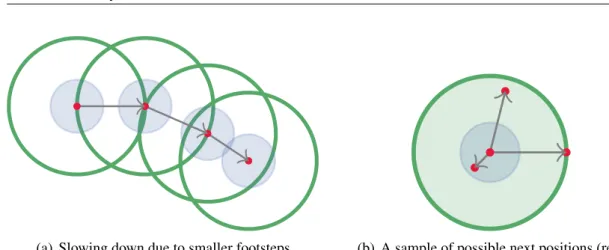
(a) Slowing down due to smaller footsteps. (b) A sample of possible next positions (red).
Figure 7 Illustration of footsteps of an agent in the OSM. The circles (green) indicate the actual step radius and the area (blue) represents the agent torso. Since each step takes the same amount of time, smaller steps (left) lead to a lower walking velocity. All positions inside the circles (green) are possible next positions.
During the simulation, each agent lperforms a series of steps as depicted in Fig.7(a). The next foot position is found by optimizing utility within a circle around the agent. The utility is encoded in a floor field Pl as described in Sec.2.1.1. Pl can also be interpreted as a potential field. The radiuss0l of the step circle is correlated with the agent’s free-flow velocityv0l. More precisely
s0l =β0+β1·v0l+ε, β0,β1>0, ε∼N (0,σ2), (6)
where the error termε is assumed to be normally distributed [19]. In crowded situations
the agents make shorter step, shorter than s0l, while the duration between steps, s0l/v0l, remains unchanged. Thus deceleration in a crowd is an emergent behavior of the OSM. Vadere’s OSM uses an event driven update scheme [69] and each step of an agent is an event. Stepping events of multiple agents are ordered in an event queue and executed accordingly [57].
The potential fieldPl of an agentl is given by a sum of sub-utilities or sub-potentials:
Ptcontributes attraction to the target or utility from proximity to the target and is given by the solution of the eikonal Eq.1 for all agents that share a target. It is defined globally, that is, on the whole simulation area. Pp,l,i causes local repulsion (or dips in utility) by other agents, andPo,jlocal repulsion from obstacles:
Pl(x) =Pt(x) +
n
∑
i=1,i6=l
Pp,l,i(x) + max
j∈{1,...,m}Po,j(x), (7)
withnagents andmobstacles in the topography (compare [19] and [3, p. 63]).
correspond to the personal space, the intimate space and the torsos of agentslandi.
Pp,l,i(x) =
plper,i (x) +pintl,i(x) +ptorl,i (x) ifdi(x)<(ri+rl)
plper,i (x) +pintl,i(x) if (ri+rl)≤di(x)<δlint+rl
plper,i (x) ifδlint+rl ≤di(x)<δlper+rl
0 else.
(8)
Hereyi is the position,ri the radius of the torso of agentiandδlper, δlint are the radii of
the personal and intimate space of agentl. di(x)gives the Euclidean distance betweenyi
andx, that is, di(x) =||yi−x||. In the current implementation of the OSM the personal spaces and radii of all agents are equal. For more details we refer to [38,71].
Letxk be the position of an agentl, then its next positionxk+1minimizesPl (or maxi-mizes−Pl) with respect to all reachable positions, that is,
xk+1= arg min y∈disc(xk)
Pl(y) (9) with
disc(xk) ={y∈R2:||y−xk|| ≤s0l}. (10) Different floor field definitions can be used to reproduce competitive jostling or more cooperative queuing at bottlenecks [72] and several other behaviors [38,53,73,74]. The optimization is robust and with carefully designed potentials, the OSM is free of overlaps and oscillations.
Using the OSM leads to solving many optimization problems. For each step of each agent a non-trivial optimization problem has to be solved. This optimization is compu-tational expensive and requires most of the overall computation time. Introducing more complex potential functions complicates the evaluation ofPlwhich contributes directly to the computation time of the optimization. This is aggravated by fact that a strict event-driven update hinders parallelization of the computation. Therefore, simulating thousands of agents in real-time using the OSM with Vadere is not yet possible. Performance im-provement is one of the topics we are currently working on.
Gradient navigation model (GNM) The gradient navigation model is similar to velo-city-based models that avoid the acceleration equation of the harmonic oscillator charac-teristic for force-based models. The GNM uses a superposition of gradients of distance functions to directly change the direction of the velocity vector [33]. Speed is a scalar that is adapted according to the difference between the desired speed and the actual speed while considering that reaction is delayed. Therefore, the relaxation timeτis disentangled
from path finding.
Behavioral heuristics model (BHM) The behavioral heuristics model (BHM) follows a completely different approach [35]: simple heuristics rooted in cognitive psychology determine each agent’s next step. Each agent uses one of four heuristics that correspond to four levels of cognitive capacity. The simplest is the step or wait heuristic: The agent checks whether the next full step in the desired direction leads to a collision. If so, it waits and if not, it steps forward. The tangential evasion heuristic allows the agent to evade another agent in its path tangentially, if the evasion step does not cause a collision. This requires two additional collision tests. Two more levels of cognitive effort are modeled. See Fig.9.
Step or Wait Tangential
Evasion SidewaysEvasion Follow
Figure 9 Illustration of behaviors with the four heuristics defined by the behavioral heuristics model: step or wait, tangential evasion, sideways evasion and follow (compare [35]).
the computational complexity of the model is low. Furthermore, the ability to combine different steering behaviors and the code accessibility furthers the software development process. New steering behaviors can be introduced without inventing a whole new model and an open-source implementation of Reynolds’ work is available on his website. De-spite the different target audience, Reynolds’ model is used in pedestrian dynamics to compare it against other models. In [76], for example, the authors compare the social force model, a velocity-obstacle-based model presented in [49] and Reynolds’ steering behavior model.
2.2. Existing simulation frameworks
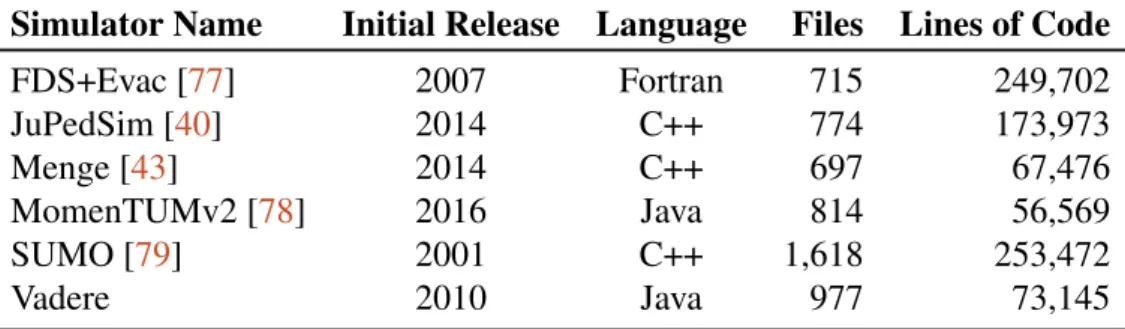
Several companies like, PTV, LEGION and accu:rate, offer licenses for commercial crowd simulators based on microscopic models. However, their implementations are proprietary. The code cannot be analyzed to understand it in detail and to ensure that computer exper-iments can be reproduced exactly. This hinders comparison between models and thus the knowledge transfer between researchers that we strive for in this contribution. Therefore, we limit this discussion to open-source frameworks. The overview in Tab.1lists frame-works that have been documented through publications or tutorials and have undergone recent development activities. The table shows the initial release date, the programming language the simulator is based on, the number of files and the lines of code1. For a more extensive, but never exhaustive overview, we refer to [71, p. 17–22].
Among the six simulators in Tab. 1, SUMO (simulation of urban mobility) plays a special role. SUMO focuses on complete intermodal traffic systems including road vehi-cles, public transport and pedestrians, while FDS+Evac, JuPedSim, Menge and Momen-TUMv2 concentrate on the actual pedestrian dynamics.
Simulator Name Initial Release Language Files Lines of Code
FDS+Evac [77] 2007 Fortran 715 249,702
JuPedSim [40] 2014 C++ 774 173,973
Menge [43] 2014 C++ 697 67,476
MomenTUMv2 [78] 2016 Java 814 56,569
SUMO [79] 2001 C++ 1,618 253,472
Vadere 2010 Java 977 73,145
Table 1 Open-source simulation frameworks for pedestrian dynamics (in alphabetical order).
FDS+Evac The Fire Dynamics Simulator (FDS) has been developed by the National Institute of Standards and Technology (NIST) since 2000 [80]. FDS started as a pure large-eddy simulator for slow flows which focuses on smoke and heat transport from fires. In the following years, the VTT Technical Research Centre of Finland joined this devel-opment and integrated the evacuation module FDS+Evac into FDS in 2007. FDS+Evac
1Lines of code excluding test code, blank lines and comments counted with “cloc” software tool. See
JuPedSim JuPedSim’s development is mainly driven by the Forschungszentrum J¨ulich. JuPedSim is a framework for the simulation of pedestrian dynamics at a microscopic level that focuses on evacuation scenarios. JuPedSim consists of four modules: (1) JP-Score simulates the movement of agents. JPJP-Score provides three models on the tactical layer: a shortest path strategy, a quickest path strategy and a cognitive map to explore the environment, e. g. to discover doors. On the operational layer, JPScore provides three continuous models based on ordinary differentials: the force-based generalized centrifu-gal force model [31], the collision-free velocity model [81] and the wall-avoidance model [82]. (2)JPSreport includes tools for density, velocity and flow measurements to analyze agent trajectories. (3)JPSvis visualizes simulation results through 2D or 3D animations. JPSvis can be directly connected to JPScore to get an online visualization of a simulation run. (4)JPSeditor is a tool for editing model parameters and the topography.
Menge The Menge framework originated at the University of North Carolina. Like for Vadere, the goal is to facilitate model comparison. For this, the Menge developers provide a very generic framework and invite researchers to contribute to the project. Menge breaks the simulation down into six sub-problems: (1) Target selection. (2) Plan computation: find the destination by using graphs or potential fields. (3)Plan adaption: use local navi-gation to find the preferred velocity(4). Motion synthesis: this means the physical motion of an agent including head, shoulder and feet movement which is not yet addressed within the Menge framework. (5)Environmental queries: identify influencing factors which are in line-of-sight of agent. (6)Crowd systems: simulations of aggregated individuals. Com-pared to Vadere, Menge offers but also insists on a software structure which realizes all three levels of pedestrian behavior defined in [23]: the operational (locomotion) layer, the tactical layer, and the strategic layer. This predefined structure is valuable if the model can be mapped onto it but hampering if not. Overhead and additional complexity result in longer development times before a researcher can compare locomotion models.
Functional - run simulations of pedestrian crowd behavior
- specify and store parameters in text files with a simple format - generate output that describes the trajectories of individuals - online processing of the simulation
- online and post-visualization - integrated graphical user interface
Non-functional - only use open-source software - run on modern desktop hardware - platform independence
- object-oriented, high-level programming language - implement new models without changing the framework - framework must not impose any model concept or structure - modular design and architecture
- reusability of basic algorithms and data structures
Table 2 Software requirements for Vadere (taken from [3, p. 17])
layer provides models for walking and waiting agents. Both models can either use a cel-lular automaton or a force-based model for locomotion. Compared to Vadere, and similar to Menge, the three-layered structure in the software introduces development overhead before two locomotion models can be compared.
SUMO SUMO is spearheaded by the Institute of Transportation Systems of the German Aerospace Center (DLR). The SUMO simulator allows to evaluate infrastructure changes before implementing them in a real environment. Its scope and its user community are much larger than that of Vadere and the three other pedestrian dynamics simulators. We mention it, because in the long run, an interface between SUMO and well-established lo-comotion models from the pedestrian community would benefit the scientific community.
3. Vadere: A framework to compare different locomotion
models
/Linux, MacOS and Microsoft Windows. Vadere follows the KISS principle [83]: keep it simple, stupid. For this reason, Vadere reads in simulation parameters, like the topography or an agent’s radius, from a human-readable JSON-based text file instead of using a binary format. Also, the simulation results — usually x and y coordinates for each pedestrian and a time step — are written to text files. In this way, users can use text editors to create input files for Vadere and they can open result files from Vadere with 3rd-party software like MATLAB. Furthermore, text files allow users to modify parameters quickly in an automated way. This is essential for studies where parameters must be varied and, thus, thousands of simulations must be run.
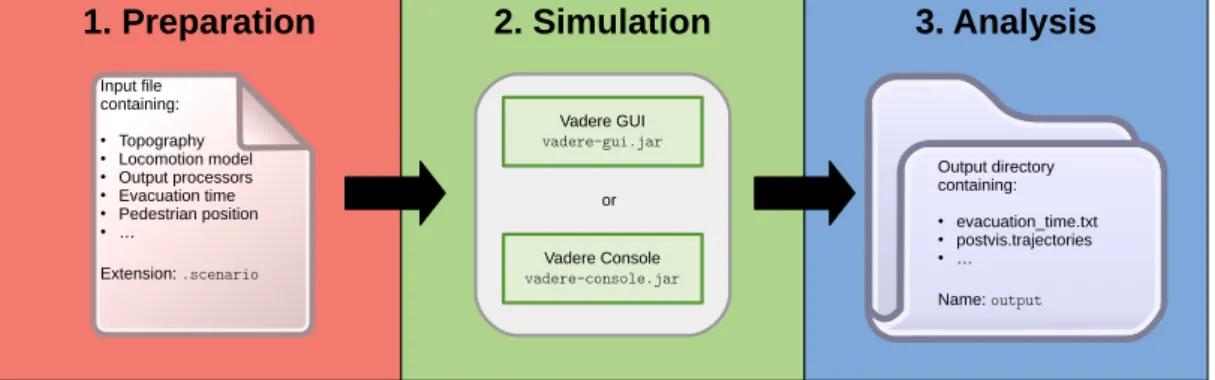
Performing simulations with Vadere requires three steps visualized in Fig.10and sum-marized below:
1. Create an input file for the simulation.
2. Run the simulation with the input file from (1).
3. Analyze the simulation results.
The graphical user interface supports all three steps. Step (1) and (3) can also be carried out with 3rd-party applications that a researcher might be more familiar with.
1. Preparation 2. Simulation 3. Analysis
Vadere GUI
vadere-gui.jar
Vadere Console
vadere-console.jar
or Input file
containing:
Topography Locomotion model Output processors Evacuation time Pedestrian position …
Extension: .scenario
Output directory containing:
evacuation_time.txt postvis.trajectories …
Name: output
Figure 10 Three steps of a simulation in Vadere: (1) Create an input file with extension.scenario(2) Run Vadere GUI or Console with the input file (3) Analyze the output files using Vadere GUI or a 3rd-party software.
let multiple output processors write into the same file. Listing1visualizes the structure of an example output file written by Vadere.
timeStep pedestrianId x y
1 1 1.6654341119190224 4.871023637696483 1 2 1.5881140640080735 3.0259345093049403 1 3 1.3134937811396925 2.512808181284221 2 1 2.39821467392553 5.137733950515711 2 2 2.291974452089554 2.7697502789642234 2 3 1.764197128690711 1.7321670841844834 ...
Listing 1 Shortened example of an output file written by Vadere describing trajectories of three agents.
We think that a highlight for the scientific community lies in our simple, but effective approach to make simulation results completely reproducible. When compiling Vadere from sources — which are under version control using Git — Vadere adds the commit hash to the simulation output files. The commit hash allows to exactly track with which Vadere version a simulation was executed.
3.1.2. Vadere: graphical user interface
Vadere includes an optional graphical user interface (GUI) to simplify usage. The GUI has multiple features. Firstly, it provides an overview of the scenario files and the corre-sponding simulation outputs. Secondly, it offers a simple but effective drawing program to define the topography and to manipulate the attributes of topography elements like agents, sources, targets, obstacles and stairs. Thirdly, during the design of a simulation study, possible problems are identified and transmitted to the user, e. g. if a pedestrian is defined without a target. The fourth useful GUI feature is the possibility to visualize the simulation run online and offline. Through this monitoring option developers get an immediate visual feedback whether or not agents move “properly” [84]. Fig. 11shows a screen shot of the Vadere GUI.
We provide an executable file, called vadere-gui.jar that includes all functionali-ties. In addition, we provide a console version calledvadere-console.jar. that should
be used to automate simulation runs, for example, when running multiple instances or running Vadere on a remote computer.
3.1.3. Vadere: locomotion models supported in Vadere
Figure 11 Vadere GUI: the top left side lists the available input files, the bottom left side lists the output files and the middle pane contains the online visualization of the simulation.
does not do justice to the computational speed that a well-designed cellular automaton achieves.
3.2. Vadere for developers
The following section shows Vadere’s software architecture in more detail. Moreover, this section sheds light on how to write a generic simulation framework that supports different locomotion models and demands minimal effort for add-ons.
3.2.1. Vadere: architecture
Vadere’s architecture applies the model view controller (MVC) software pattern [85]. Therefore, Vadere is divided into three interconnected modules: state, gui and simulator. Moreover, Vadere is complemented by two supporting modules: utilsand meshing. In sum, it is composed of five separated modules depicted in Fig.12.
utils consists of utility classes implementing algorithms required by all other
mod-ules such as basic math functions, algorithms for computational geometry, or simple I/O-handling. meshingis a specialized computational geometry library that offers methods
simulator gui
utils
state meshing
Figure 12 Illustration of Vadere’s layered software architecture: A rectangle represents an isolated soft-ware module. The softsoft-ware modules in the upper layers depend on modules in the lower layers.
topography elements like agents, targets, sources and all attributes, that is, all objects that define the simulation state.simulatoris the most important module for developing new
locomotion models. It contains all locomotion models, the simulation loop itself and all other controller components. The gui module contains all classes that are part of the
graphical user interface. It is optional but recommended, especially for starters, since it improves usability. The MVC pattern leads to a clear separation of responsibilities for the three MVC modules within Vadere:
• Model (state): the model layer does not contain any logic. Instead, it is the
sim-ulation state, i. e. the composition of agents, sources, obstacles, targets and their corresponding attributes like the number of agents a source creates.
• Controller (simulator): the control layer contains the logic to change objects of
the model layer. For instance, to update the x and y coordinates of all agents in each time step. Mainly, the control layer holds implementations for different locomotion models.
• View (gui): The view visualizes the current state of the model objects in form of a
GUI. Note that the GUI itself implements the MVC pattern but on another level.
Fig.13 shows a package diagram containing important classes of Vadere and how these classes interact with each other.
3.2.2. The simulation loop
User
triggers
uses is seen by - AttributesBHM
- AttributesBMM - AttributesGNM - AttributesOSM - AttributesOVM - AttributesReynolds - AttributesSFM - ... - ...
Figure 13 Package diagram showing important classes in Vadere and how they are embedded into the MVC pattern. Blue arrows indicate communication between the MVC components. Black arrows show how classes communicate with each other. The controller classes hold the logic to change the model classes which are visualized by the view classes.
Model model = ... // loaded from input file
double simulationTime = 0; ...
while (simulationIsRunning) {
// use "SourceController" and "TargetController" ...
// update the locomotion model model.update(simulationTime); simulationTime++;
... }
Listing 2 Simulation loop of Vadere.
Despite Vadere’s versatility its core is a singlewhile-loop. Fig.14 shows how the
sim-ulation loop updates agents’ positions at three different time steps using the OSM loco-motion model. Listing2alludes to theSourceControllerand theTargetController
controller in a comment line (line 6). TheSourceControllerspawns new agents inside
the topography. The TargetControllerremoves agents from the topography once they
(a)t=2,4s (b) t=6s
(c)t=10,8s
Figure 14 Agent positions at three different times using the OSM locomotion model.
Models based on differential equations.
<<Interface>>
Model
+void initialize(...)
+void preLoop(double simTimeInSec) +void postLoop(double simTimeInSec)
+void update(double simTimeInSec)
...
<<Class>>
Social Force Model
<<Class>>
Optimal Velocity Model
<<Class>>
Gradient Navigation
Model
<<Abstract Class>>
ODEModel
<<Class>>
Reynolds Steering Model
<<Class>>
Optimal Steps Model
<<Class>>
Biomechanics Model
<<Class>>
Behavioural Heuristics
Model
Figure 15 The common locomotion model interface “Model” and its implementations.
3.2.3. Including different locomotion models using the strategy pattern
Vadere’s goal is to offer a generic framework to support different locomotion models. The challenge is to keep development effort minimal. The solution idea is to provide an interface. More precisely, each locomotion model must implement a common interface that contains four methods. See Fig.15:
step, the locomotion model has access to the topography object that encapsulates all
required elements like agents, obstacles and targets.
3.3. Quality assurance: Unit testing and continuous integration
Errors can occur at each stage in the modeling process from real-world observations to the mathematical formulation of a locomotion model to its algorithmic formulation, and finally its implementation. See Fig. 16. Therefore, verification and validation are cru-cial. Through verification we want to assure that the software fulfills the requirements that we formulated, without questioning the requirements. The latter is the objective of validation where we interpret simulation outcomes as hypotheses derived from our model and compare those to empirical findings. While this can never be more than a failure to falsify one’s own model [87] it is essential for building trust. In view of this, we establish a verification and validation process as integral part of Vadere.
Modeling Algorithmic Formulation Real
World
Locomotion
Model SimulationProgram
Simulated World
observe
translate
implement
simulate
validate
verify
Figure 16 Verification and validation throughout the modeling process: We verify software implementa-tions. We validate the whole model against empirical observaimplementa-tions.
3.3.1. Unit Testing
Crucial code is best developed in a test-driven manner to enforce correctness of written source code. Listing 3shows the principle of unit testing in the Vadere project with an example. We use the Java unit testing framework JUnit [88]. Vadere’s test suite currently covers 24%2of the productive source code excluding theViewcomponents. See Fig.13.
2Retrieve the detailed test report at https://gitlab.lrz.de/vadere/vadere/-/jobs/
Developers Version Control
Server and Deployment WorkerContinuous Integration
1. Run verfification tests.
2. Run validation tests.
3. Deploy on www.vadere.org/releases
commit changes to
triggers
Figure 17 The three actors in the continuous integration and deployment cycle: Developers commit changes to the version control server. The version control server triggers worker computers which validate, verify and deploy Vadere.
One could argue that this is a low coverage compared to industrial software [89], but we believe it is sufficient for a research simulator that needs to stay flexible. Also, we focus on testing core classes to make the simulations reliable while keeping development fast.
public class TestGeometry { ...
@Test
public void testLineCircleIntersectionZeroResults() {
VCircle circle = new VCircle(1, 1, 1); // x,y,radius
VLine line = new VLine(3,0, 4, 1); // x1,y1,x2,y2
// Method under test.
VPoint[] intersectionPoints =
GeometryUtils.intersection(line, circle); assertTrue(intersectionPoints.length == 0); }
... }
Listing 3 The test classTestGeometrytests the code in classGeometry.
3.3.2. Continuous integration and deployment
Our second strategy for error reduction is so-called continuous integration. In our case this means that a test pipeline is invoked each time the Vadere source code is modified and pushed to the source code repository. First, the test pipeline performs all unit tests. This represents the code verification. Then, special test scenarios which are defined by the RiMEA “Guideline for Microscopic Evacuation Analysis” [90, pp. 38–51] are executed. The guideline defines 15 test cases for evacuation scenarios which shall be passed by a pedestrian dynamics’ simulator. Additionally, we define 16 scenarios based on experi-ments published and evaluated in [91] and compare simulation results to real world data. Test scenarios serve partly as model verification and partly as model validation. Currently, for the OSM locomotion, at least 49 test runs with different parameter sets are executed. Finally, the verified and validated executable of the Vadere simulator is placed on the
web-site http://www.vadere.org/releases/. The website hosts Vadere versions
In this paper, we presented the free and open-source simulation framework Vadere for pedestrian dynamics. Vadere contains implementations of several locomotion models, among them the cellular automata, the social force model and the optimal steps model to facilitate model comparison. We described Vadere’s architecture and showed how to integrate new locomotion models in a straightforward way. Each model’s implementation is verified based on JUnit tests and validated against the standard test scenarios from the RiMEA guidelines. In addition, for any change in the code both verification and validation tests are automatically run and results are communicated to the developers. This mechanism assures a high source code quality and gives developers an immediate feedback when a result is considered implausible by the scientific community.
Our vision of Vadere is a tool that encourages research within and is used by the whole interdisciplinary pedestrian dynamics community instead of just serving the purposes of our research group. We encourage each member of this interdisciplinary community to use Vadere in the way that suits him or her: as a user who conducts and analyzes simu-lation experiments, as a modeler who introduces new models or as a software developer who improves and extends the software.
Acknowledgements We thank the research office (FORWIN) of the Munich University of Ap-plied Sciences and the Faculty Graduate Center CeDoSIA of TUM Graduate School at Technical University of Munich for their support.
Authors’ contributions B. K. drafted the article. B. Z. revised the article, especially Sec.1
and2.1. M. G. critically reviewed the article and provided input for the conclusion. G. K. critically revised the article and added the abstract and gave final approval for publication.
Funding B. K. is supported by the German Federal Ministry of Education and Research through the project OPMoPS to study organized pedestrian movement in public spaces (grant no. 13N14562). B. Z. and M. G. are supported by the German Federal Ministry of Education and Research through the project S2UCRE to study the acceleration of microscopic pedestrian simu-lations by designing efficient and parallel algorithms (grant no. 13N14463).
References
[1] Drury, J., Reicher, S.: Collective action and psychological change: The emergence of new social identities. British Journal of Social Psychology39(4), 579–604 (2010).
doi:10.1348/014466600164642
[2] Helbing, D., Moln´ar, P.: Social Force Model for pedestrian dynamics. Physical Review E51(5), 4282–4286 (1995). doi:10.1103/PhysRevE.51.4282
[3] Seitz, M.J.: Simulating pedestrian dynamics: Towards natural locomotion and psychological decision making. Ph.D. thesis, Technische Universit¨at M¨unchen, Munich, Germany (2016). URL https://mediatum.ub.tum.de/?id= 1293050
[4] Adrian, J., Bode, N., Amos, M., Baratchi, M., Beermann, M., Boltes, M., Corbetta, A., Dezecache, G., Drury, J., Fu, Z., Geraerts, R., Gwynne, S., Hofinger, G., Hunt, A., Kanters, T., Kneidl, A., Konya, K., K¨oster, G., K¨upper, M., Michalareas, G., Neville, F., Ntontis, E., Reicher, S., Ronchi, E., Schadschneider, A., Seyfried, A., Shipman, A., Sieben, A., Spearpoint, M., Sullivan, G.B., Templeton, A., Toschi, F., Y¨ucel, Z., Zanlungo, F., Zuriguel, I., van der Wal, N., van Schadewijk, F., von Kr¨uchten, C., Wijermans, N.: A glossary for research on human crowd dynamics. Collective Dynamics (2019). doi:10.17815/CD.2019.19
[5] Reicher, S.D.: The St. Pauls’ riot: An explanation of the limits of crowd action in terms of a social identity model. European Journal of Social Psychology14(1), 1–21 (1984). doi:10.1002/ejsp.2420140102
[6] Drury, J., Reicher, S.: The intergroup dynamics of collective empowerment: Sub-stantiating the social identity model of crowd behavior. Group Processes & Inter-group Relations2(4), 381–402 (1999)
[7] Challenger, R., Clegg, C.W., Robinson, M.A., Leigh, M.: Understanding crowd behaviours: Supporting evidence. Tech. rep., University of Leeds (2009)
[8] Templeton, A., Drury, J., Philippides, A.: From mindless masses to small groups: Conceptualizing collective behavior in crowd modeling. Review of General Psy-chology19(3), 215–229 (2015). doi:10.1037/gpr0000032
[9] Fahy, R.F., Proulx, G., Aiman, L.: Panic or not in fire: Clarifying the misconception. Fire and Materials36(5–6), 328–338 (2012). doi:10.1002/fam.1083
[10] Helbing, D., Farkas, I., Vicsek, T.: Simulating dynamical features of escape panic. Nature407, 487–490 (2000). doi:10.1038/35035023
[14] Kinateder, M., Ronchi, E., Nilsson, D., Kobes, M., M¨uller, M., P., P., M¨uhlberger, A.: Virtual reality for fire evacuation research. In: 2014 Federated Con-ference on Computer Science and Information Systems, pp. 313–321 (2014).
doi:10.15439/2014F94
[15] Feng, Z., Gonz´alez, V.A., Amor, R., Lovreglio, R., Cabrera-Guerrero, G.: Im-mersive virtual reality serious games for evacuation training and research: A systematic literature review. Computers & Education 127, 252–266 (2018).
doi:10.1016/j.compedu.2018.09.002
[16] Lovreglio, R.: A review of augmented reality applications for building evacuation. In: 17th International Conference on Computing in Civil and Building Engineering (2018). URLhttp://arxiv.org/abs/1804.04186
[17] Wolfram, S.: Cellular automata as models of complexity. Nature 311, 419–424 (1984). doi:10.1038/311419a0
[18] Antonini, G.: A discrete choice modeling framework for pedestrian walking be-havior with application to human tracking in video sequences. Ph.D. thesis, ´Ecole polytechnique f´ed´erale de Lausanne (2005)
[19] Seitz, M.J., K¨oster, G.: Natural discretization of pedestrian move-ment in continuous space. Physical Review E 86(4), 046108 (2012).
doi:10.1103/PhysRevE.86.046108
[20] Papadimitriou, E., Yannis, G., Golias, J.: A critical assessment of pedestrian be-haviour models. Transportation Research Part F: Traffic Psychology and Bebe-haviour 12(3), 242–255 (2009). doi:10.1016/j.trf.2008.12.004
[21] Hughes, R.L.: A continuum theory for the flow of pedestrians. Trans-portation Research Part B: Methodological 36(6), 507–535 (2001).
doi:10.1016/S0191-2615(01)00015-7
[22] Treuille, A., Cooper, S., Popovi´c, Z.: Continuum crowds. ACM Transactions on Graphics (SIGGRAPH 2006) 25(3), 1160–1168 (2006).
[23] Hoogendoorn, S.P., Bovy, P.H.L.: Pedestrian route-choice and activity scheduling theory and models. Transportation Research Part B: Methodological 38(2), 169– 190 (2004). doi:10.1016/S0191-2615(03)00007-9
[24] Zheng, X., Zhong, T., Liu, M.: Modeling crowd evacuation of a building based on seven methodological approaches. Building and Environment 44(3), 437–445 (2009). doi:10.1016/j.buildenv.2008.04.002
[25] Gipps, P., Marksj¨o, B.: A micro-simulation model for pedestrian flows. Mathematics and Computers in Simulation 27(2–3), 95–105 (1985).
doi:10.1016/0378-4754(85)90027-8
[26] Burstedde, C., Klauck, K., Schadschneider, A., Zittartz, J.: Simulation of pedestrian dynamics using a two-dimensional cellular automaton. Phys-ica A: StatistPhys-ical Mechanics and its ApplPhys-ications 295, 507–525 (2001).
doi:10.1016/S0378-4371(01)00141-8
[27] Kirchner, A., Kl¨upfel, H., Nishinari, K., Schadschneider, A., Schreckenberg, M.: Simulation of competitive egress behavior: comparison with aircraft evacuation data. Physica A: Statistical Mechanics and its Applications 324(3–4), 689–697 (2003). doi:10.1016/S0378-4371(03)00076-1
[28] Was, J., Gudowski, B., Matuszyk, P.: Social distances model of pedestrian dynam-ics. In: El Yacoubi, S., Chopard, B., Bandini, S. (eds.) Cellular Automata,Lecture Notes in Computer Science, vol. 4173, pp. 492–501. Springer Berlin Heidelberg (2006). doi:10.1007/11861201 57
[29] Ezaki, T., Yanagisawa, D., Ohtsuka, K., Nishinari, K.: Simulation of space acquisition process of pedestrians using proxemic floor field model. Phys-ica A: StatistPhys-ical Mechanics and its ApplPhys-ications 391(1–2), 291–299 (2012).
doi:10.1016/j.physa.2011.07.056
[30] Zhang, P., Jian, X.X., Wong, S.C., Choi, K.: Potential field cellular au-tomata model for pedestrian flow. Physical Review E 85(2-1), 021119 (2012).
doi:10.1103/PhysRevE.85.021119
[31] Chraibi, M., Seyfried, A., Schadschneider, A.: Generalized centrifugal-force model for pedestrian dynamics. Physical Review E 82(4), 046111 (2010).
doi:10.1103/PhysRevE.82.046111
[32] Chraibi, M., Kemloh, U., Schadschneider, A., Seyfried, A.: Force-based models of pedestrian dynamics. Networks and Heterogeneous Media 6(3), 425–442 (2011).
doi:10.3934/nhm.2011.6.425
gram based direction choices using uni- and bi-directional trajectory data. Physical Review E97(5) (2018). doi:10.1103/PhysRevE.97.052127
[37] von Sivers, I., K¨oster, G.: How stride adaptation in pedestrian models improves nav-igation. arXiv1401.7838(v1) (2014). URLhttp://arxiv.org/abs/1401. 7838v1
[38] von Sivers, I., K¨oster, G.: Dynamic stride length adaptation according to utility and personal space. Transportation Research Part B: Methodological74, 104–117 (2015). doi:10.1016/j.trb.2015.01.009
[39] von Sivers, I., Templeton, A., K¨unzner, F., K¨oster, G., Drury, J., Philip-pides, A., Neckel, T., Bungartz, H.J.: Modelling social identification and helping in evacuation simulation. Safety Science 89, 288–300 (2016).
doi:10.1016/j.ssci.2016.07.001
[40] Chraibi, M., Zhang, J.: JuPedSim: an open framework for simulating and analyz-ing the dynamics of pedestrians. In: SUMO2016 - Traffic, Mobility, and Logis-tics, Proceedings,Berichte aus dem DLR-Institut f¨ur Verkehrssystemtechnik, vol. 30, pp. 127–134. SUMO Conference 2016, Berlin (Germany), 23 May 2016 - 25 May 2016, Deutsches Zentrum f¨ur Luft- und Raumfahrt e. V., Institut f¨ur Verkehrssys-temtechnik, Braunschweig (2016). URL http://juser.fz-juelich.de/ record/809790
[41] K¨oster, G., Treml, F., G¨odel, M.: Avoiding numerical pitfalls in social force models. Physical Review E 87(6), 063305 (2013).
doi:10.1103/PhysRevE.87.063305
[42] FDS+Evac Contributors: Fire Dynamics Simulator with Evacuation (FDS+Evac). Online: http://virtual.vtt.fi/virtual/proj6/fdsevac/
documents/FDS+Evac_webpages.pdf(2019). Accessed 27. May 2019
[43] Curtis, S., Best, A., Manocha, D.: Menge: A modular framework for simulating crowd movement. Collective Dynamics (2016)
[45] SUMO Contributors: SUMO – Simulation of Urban MObility. Online:
www.dlr.de/ts/en/desktopdefault.aspx/tabid-9883/16931_
read-41000/(2015). Accessed 11. January 2016
[46] Hirai, K., Tarui, K.: A simulation of the behavior of a crowd in panic. In: Proc. of the 1975 International Conference on Cybernetics and Society, p. 409 (1975)
[47] Dietrich, F., K¨oster, G., Seitz, M., von Sivers, I.: Bridging the gap: From cellular au-tomata to differential equation models for pedestrian dynamics. Journal of Computa-tional Science5(5), 841–846 (2014). doi:10.1016/j.jocs.2014.06.005
[48] Fiorini, P., Shiller, Z.: Motion planning in dynamic environments using velocity obstacles. The International Journal of Robotics Research 17(7), 760–772 (1998).
doi:10.1177/027836499801700706
[49] Berg, J., Guy, S.J., Lin, M., Manocha, D.: Reciprocal n-body colli-sion avoidance. Springer Tracts in Advanced Robotics 70, 3–19 (2011).
doi:10.1007/978-3-642-19457-3 1
[50] Curtis, S., Guy, S.J., Zafar, B., Manocha, D.: Virtual Tawaf: A Velocity-Space-Based Solution for Simulating Heterogeneous Behavior in Dense Crowds, chap. 1, pp. 181–209. Springer Science + Business Media (2013).
doi:10.1007/978-1-4614-8483-7 8
[51] Seitz, M.J., Dietrich, F., K¨oster, G., Bungartz, H.J.: The superposition principle: A conceptual perspective on pedestrian stream simulations. Collective Dynamics 1, A2 (2016). doi:10.17815/CD.2016.2
[52] Hartmann, D., Mille, J., Pfaffinger, A., Royer, C.: Dynamic medium scale naviga-tion using dynamic floor fields. In: Weidmann, U., Kirsch, U., Schreckenberg, M. (eds.) Pedestrian and Evacuation Dynamics 2012, pp. 1237–1249. Springer Interna-tional Publishing (2014). doi:10.1007/978-3-319-02447-9-102
[53] K¨oster, G., Z¨onnchen, B.: Queuing at bottlenecks using a dynamic floor field for navigation. In: The Conference in Pedestrian and Evacuation Dynamics 2014, Transportation Research Procedia, pp. 344–352. Delft, The Netherlands (2014).
doi:10.1016/j.trpro.2014.09.029
[54] Dias, C., Lovreglio, R.: Calibrating cellular automaton models for pedestri-ans walking through corners. Physics Letters A 382(19), 1255–1261 (2018).
doi:10.1016/j.physleta.2018.03.022
[55] Ruggiero, L., Charitha, D., Xiang, S., Lucia, B.: Investigating pedestrian navigation in indoor open space environments using big data. Applied Mathematical Modelling 62, 499–509 (2018). doi:10.1016/j.apm.2018.06.014
1 pedestrian movement by the application of magnetic models. Trans-actions of the Architectural Institute of Japan 283, 111–119 (1979).
doi:10.3130/aijsaxx.283.0 111
[60] Johansson, A., Helbing, D., Shukla, P.: Specification of the social force pedestrian model by evolutionary adjustment to video tracking data. Advances in Complex Systems10, 271–288 (2007). doi:10.1142/S0219525907001355
[61] Moussa¨ıd, M., Perozo, N., Garnier, S., Helbing, D., Theraulaz, G.: The walking behaviour of pedestrian social groups and its impact on crowd dynamics. PLoS ONE5(4), e10047 (2010). doi:10.1371/journal.pone.0010047
[62] Yu, W.J., Chen, R., Dong, L.Y., Dai, S.Q.: Centrifugal force model for pedestrian dynamics. Physical Review E 72, 026112 (2005).
doi:10.1103/PhysRevE.72.026112
[63] Lakoba, T.I., Kaup, D.J., Finkelstein, N.M.: Modifications of the helbing-moln´ar-farkas-vicsek social force model for pedestrian evolution. Simulation 81(5), 339– 352 (2005). doi:10.1177/0037549705052772
[64] Pelechano, N., Allbeck, J.M., Badler, N.I.: Controlling individual agents in high-density crowd simulation. In: Metaxas, D., Popovic, J. (eds.) ACM SIGGRAPH/Eu-rographics Symposium on Computer animation (2007)
[65] Parisi, D.R., Gilman, M., Moldovan, H.: A modification of the social force model can reproduce experimental data of pedestrian flows in normal conditions. Phys-ica A: StatistPhys-ical Mechanics and its ApplPhys-ications 388(17), 3600–3608 (2009).
doi:10.1016/j.physa.2009.05.027
[66] Kretz, T., Große, A., Hengst, S., Kautzsch, L., Pohlmann, A., Vortisch, P.: Quickest paths in simulations of pedestrians. Advances in Complex Systems 10, 733–759 (2011)
[67] Johansson, F., Duives, D., Daamen, W., Hoogendoorn, S.: The many roles of the relaxation time parameter in force based models of pedes-trian dynamics. Transportation Research Procedia 2, 300–308 (2014).
doi:10.1016/j.trpro.2014.09.057. The Conference on Pedestrian and
[68] Chraibi, M.: Oscillating behavior within the social force model. arXiv (2014)
[69] Conway, R.W., Johnson, B.M., Maxwell, W.L.: Some problems of dig-ital systems simulation. Management Science 6(1), 92–110 (1959).
doi:10.1287/mnsc.6.1.92
[70] Hall, E.T.: The Hidden Dimension. Anchor (1990). URLwww.worldcat.org/ isbn/0385084765
[71] von Sivers, I.K.M.: Modellierung sozialpsychologischer Faktoren in Personen-stromsimulationen - Interpersonale Distanz und soziale Identit¨aten. Ph.D. thesis, Technische Universit¨at M¨unchen (2016). URLhttps://mediatum.ub.tum. de/doc/1303742/1303742.pdf
[72] Z¨onnchen, B.: Navigation around pedestrian groups and queueing using a dynamic adaption of traveling. Bachelor’s thesis, Hochschule M¨unchen (2013)
[73] Seitz, M.J., Dietrich, F., K¨oster, G.: The effect of stepping on pedestrian trajecto-ries. Physica A: Statistical Mechanics and its Applications 421, 594–604 (2015).
doi:10.1016/j.physa.2014.11.064
[74] K¨oster, G., Z¨onnchen, B.: A queuing model based on social attitudes. In: Knoop, V.L., Daamen, W. (eds.) Traffic and Granular Flow ’15, pp. 193–200. Springer International Publishing, Nootdorp, the Netherlands (2016).
doi:10.1007/978-3-319-33482-0. 27–30 October 2015
[75] Reynolds, C.W.: Flocks, herds and schools: A distributed behavioral model. ACM SIGGRAPH Computer Graphics 21(4), 25–34 (1987).
doi:10.1145/37402.37406
[76] Wolinski, D., J. Guy, S., Olivier, A.H., Lin, M., Manocha, D., Pettr´e, J.: Parame-ter estimation and comparative evaluation of crowd simulations. Comput. Graph. Forum33(2), 303–312 (2014). doi:10.1111/cgf.12328
[77] Korhonen, T., Hostikka, S., Heli¨ovaara, S., Ehtamo, H., Matikainen, K.J.: Integra-tion of an agent based evacuaIntegra-tion simulaIntegra-tion and state-of-the-art fire simulaIntegra-tion. In: Proceedings of the 7th Asia-Oceania Symposium on Fire Science & Technology, Hong Kong (2007). URL https://pdfs.semanticscholar.org/5ea1/ 8b163221a6e736a47a0df9e785efbcf6df64.pdf
[78] Kielar, P.M., Borrmann, A.: Modeling pedestrians’ interest in locations: A concept to improve simulations of pedestrian destination choice. Simulation Modelling Prac-tice and Theory61, 47–62 (2016). doi:10.1016/j.simpat.2015.11.003
[82] Graf, A.: Automated Routing in Pedestrian Dynamics. Master’s thesis, Fachhochschule Aachen (2015). URL http://juser.fz-juelich.de/ record/276318
[83] Hanik, F.: The kiss principle. Online: https://people.apache.org/
˜fhanik/kiss.html(2006). Accessed 05. November 2018
[84] Gipps, P.: The role of computer graphics in validating simulation mod-els. Mathematics and Computers in Simulation 28(4), 285–289 (1986).
doi:10.1016/0378-4754(86)90049-2
[85] Gamma, E., Helm, R., Johnson, R., Vlissides, J.: Design Patterns: Elements of Reusable Object-Oriented Software. Addison-Wesley, Boston, MA (1994)
[86] Z¨onnchen, B., K¨oster, G.: A parallel generator for sparse unstructured meshes to solve the eikonal equation. Journal of Computational Science (2018).
doi:10.1016/j.jocs.2018.09.009
[87] Popper, K.: The Logic of Scientific Discovery (1934, 1959). Routledge Classics, London and New York (2002)
[88] JUnit test tool, http://www.junit.org. http://www.junit.org. Accessed: 2018-11-07
[89] ISO: Road vehicles — Functional safety — Part 6: Product development at the soft-ware level (2018). URLhttps://www.iso.org/standard/68388.html
[90] RiMEA: Guideline for Microscopic Evacuation Analysis. RiMEA e.V., 3.0.0 edn. (2016). URLhttp://www.rimea.de/
[91] Zhang, J., Klingsch, W., Schadschneider, A., Seyfried, A.: Transitions in pedestrian fundamental diagrams of straight corridors and t-junctions. Jour-nal of Statistical Mechanics: Theory and Experiment 2011(06), P06004 (2011).
doi:10.1088/1742-5468/2011/06/P06004
A. Appendix
A.1. Obtain lines of code (LOCs) for different simulators
The lines of code exclude unit tests, blank lines and comments. The “cloc” software tool3 version 1.74 was used to obtain the lines of code. The hash contained in the
--report-file indicates the analyzed simulator version according to the Git version
control system.
FDS+Evac: cloc
--report-file=fds-5c0149698-cloc_report.txt .
JuPedSim: cloc
--exclude-dir=Utest --exclude-lang=XML
--report-file=jupedsim-d942c947-cloc_report.txt jpscore/ jpseditor/ jpsreport/ jpsvis/
. Menge:
cloc
--match-d=src --exclude_dir=test
--report-file=menge-menge-c3eb429-cloc_report.txt .
MomenTUMv2: cloc
--exclude-dir=momentum-documentation,tests --exclude-lang=HTML,CSS,XML
--report-file=momentumv2-55c8f3a-cloc_report.txt .
SUMO: cloc
--match-d=src
--report-file=sumo-1.0.1-cloc_report.txt .
Vadere: cloc
--exclude-dir=tests
--exclude-lang=JSON --report-file=vadere-87b4fe32-cloc_report.txt .
![Figure 9 Illustration of behaviors with the four heuristics defined by the behavioral heuristics model: step or wait, tangential evasion, sideways evasion and follow (compare [35]).](https://thumb-us.123doks.com/thumbv2/123dok_us/8088672.2143191/13.892.198.680.758.879/figure-illustration-behaviors-heuristics-behavioral-heuristics-tangential-sideways.webp)
![Table 2 Software requirements for Vadere (taken from [3, p. 17])](https://thumb-us.123doks.com/thumbv2/123dok_us/8088672.2143191/16.892.136.756.140.490/table-software-requirements-vadere-taken-p.webp)