Vol 2, No 1 (2014) ISSN 2167-8677 (online) DOI 10.5195/d3000.2014.21
This work is licensed under a Creative CommonsAttribution 3.0 United States License.
This site is published by the University Library System, University of Pittsburgh as part of its D-Scribe Digital Publishing Program and is cosponsored by the University of Pittsburgh Press.
Hypoxic conditions alter developing branchial arch-derived structures
in zebrafish
Trish E. Parsons1, Seth M. Weinberg1, Michael Tsang2, Alexandre R. Vieira1
1
Department of Oral Biology, School of Dental Medicine, University of Pittsburgh, Pittsburgh, PA, USA
2
Department of Developmental Biology, School of Medicine, University of Pittsburgh, Pittsburgh, PA, USA
Abstract
Background: Previous epidemiological findings have implicated hypoxia as a risk factor for
craniofacial defects including cleft lip, microtia and branchial arch anomalies. This study tests the hypothesis that hypoxic exposure results in craniofacial shape variation in a ze-brafish model. Methods: Three sets of zeze-brafish embryos were raised in uniform conditions with the exception of dissolved oxygen level. At 24 hours past fertilization (hpf) embryos were placed in hypoxic conditions (70% or 50% dissolved oxygen tank water) and compared to unexposed control embryos. After 24 hours of exposure to hypoxia, the embryos were incubated under normoxia. Larvae were collected at 5 days post fertilization (dpf) and stained for cartilage. Images were taken of each specimen and subsequently landmarked to capture viscerocranial morphology. A geometric morphometric analysis was performed to compare shape variation across groups. Results: The mean branchial arch shape of each exposure group was significantly different from controls (p<0.001). Principal components analysis revealed a clear separation of the three groups, with controls at one end of the shape spectrum, the 50% hypoxia group at the other end, and the 70% hypoxia group spanning the variation in between. Conclusions: This experiment shows that hypoxia expo-sure at 24hpf is capable of affecting craniofacial shape in a dose-dependent manner. These results may have implications not only for high altitude fetal health, but other environ-ments, behaviors and genes that affect fetal oxygen delivery.
Citation: Parsons TE, Weinberg SM, Tsang M, Vieira AR.
(2014) Hypoxic conditions alter developing branchial arch-derived structures in zebrafish.. Dentistry 3000. 1:a001 doi:10.5195/d3000.2014.21
Received:February 3, 2014
Accepted:July 12, 2014
Published: August 6, 2014
Copyright: ©2014Parsons et al. This is an open access article licensed under a Creative Commons Attribution Work 3.0 United States License.
Email: [email protected]
INTRODUCTION
There are multiple lines of evidence indicating that hypoxia can alter craniofacial development. Most research has focused on the midface and the effects of reduced oxygen on the development of orofacial clefts. For example, maternal cigarette smoking has been shown to increase the risk of oral clefts in offspring [1], the incidence of clefting ap-pears to be elevated in certain high-altitude populations [2], and cleft mouse models show increased incidence of clefting after hypoxia exposure [3]. There is also evidence that hy-poxia can affect a broader range of structures comprising the craniofacial complex, including branchial-arch related morphology [2,4]. For example, the observed prevalence rate for microtia is five times greater for individuals living at high-altitude compared with those living at low altitude in the same general re-gion, suggesting that development of the first
and second branchial arches is susceptible to hypoxia [5].
It is critical to understand the multi-tude of the factors capable of altering the underlying developmental architecture ulti-mately resulting in craniofacial malformations. Animal models are tools that help determine which factors warrant further scrutiny. Ze-brafish (Daniorerio) provide a relatively quick and inexpensive way to screen for factors involved in phenotypes of interest [6]. While zebrafish are most often used to explore ge-netic questions, they also provide an oppor-tunity to test environmental effects such as oxygen availability on phenotypic outcomes. Previous experiments with zebrafish in low-oxygenated water have resulted in general growth retardation and developmental delay [7,8].
The present experiment focuses on the zebrafish viscerocranium. The structures comprising the viscerocranium are derived
from branchial arches. The branchial arches consist principally of neural crest cell-derived mesenchyme and are separated by endoder-mal pouches. In fish, the first and second branchial arches give rise to various structures of the craniofacial complex; the first arch gives rise to Meckel s cartilage and the dorsal palatoquadrate, while the second arch forms the ceratohyal, basihyal, interhyal and hyosimplectic[9]. In mammals, first and sec-ond arch derivatives include parts of the mid-dle ear, mandibular process, maxillary process and part of the hyoid bone [10].
Hypoxicconditionsalterdevelopingbranchialarch-derivedstructuresinzebrafish
Vol 2, No 1 (2014) DOI 10.5195/d3000.2014.21
Figure 1: Landmark key.
MATERIALS AND METHODS
Zebrafish Maintenance
Adult wildtype zebrafish AB* were maintained in a zebrafish housing system (Aquaneering Inc.). Adult fish are maintained at 25-27oC with reconstituted Reverse Osmo-sis Water (pH 7.0-7.5; Conductivity: 650-750 µS/ cm; Dissolved Oxygen: 7.5mm Hg) in 14 h: 10 h light: dark photoperiod. Male and Female adult zebrafish were set up the day before and embryoswere collected in the morning and staged according to Nuesslein-Volhard et al [6]. Embryos were transferred to petri dishes containing E3 solution (5mM NaCl, 0.17 mMKCl, 0.33 mM CaCl2, 0.33 mM MgSO4) and incubated at 28.5oC.
Specimen Preparation and Data Collection
Embryos from a single clutch were divided into three different conditions: nega-tive control/ normal O2 level(6.5-6.6mm Hg,
which was considered 100% O2), 50% O2level,
and 70% O2level)at 24 hours post fertilization
(hpf) for a period of 24 hours. Oxygen levels were manipulated by bubbling nitrogen gas and measuring dissolved oxygen level with a dissolved oxygen meter (SonTek/ YSI modell 58, Fisher Scientific) in E3 media. Embryos were added to the deoxygenated E3 and placed into 50ml conical tubes and sealed, thereby reducing the amount of oxygen trans-fer in the process. The embryos were incu-bated at 28.5oC and after the 24 hours the larvae under hypoxic conditions were re-turned to normoxic E3 media.
At 120hpf, a portion of specimens from each group were sacrificed with tricaine treatment (MS-222, Sigma) and fixed in 4% paraformaldehyde. The five-day time point(120 hpf)was chosen because it is within a developmental window where the visceral cartilages are well developed but just prior to the stage when feeding occurs. The mechan-ics of feeding could introduce mechanical influences on shape that would confound our analysis. The skin surrounding the anterior half of the embryo and the brain were re-moved from each specimen. At this time the eyes were also removed as they inter-fered with the visualization of certain cra-niofacial structures. After dissection the specimens were dehydrated with a series of ethanol treatments and stained for carti-lage with Alcian blue (0.1% Alcian blue dissolved in 80% ethanol/ 20% glacial acetic acid) followed by the addition of sodium borate to neutralize the acid [11].
Ventral images of the branchial arches were captured using a
camera-mounted microscope, similar to the methods used by Lopez-Romero and co-workers [12]. Subsets of specimens from each of the three experimental rounds were included in the data collection for a total sample size of 35 (70% O2,n=19; 50% O2,n=9; normal controls,
n=7). Each larva was held in place with pins through their caudal end to minimize orienta-tion error in the images. Eight two-dimensional landmarks were collected on first and second gill arch-derived structures by a single digitizer using tpsDIG2 [13] and the corresponding x,y coordinates saved for analysis. Landmark locations were based on those presented in Alberston and Yelick[14] which are listed and presented in Figure 1.Institutional ethical approval was obtained prior to any animal experimentation (Univer-sity of Pittsburgh IACUC Protocol #0409348)
Statistical Shape Analysis
A geometric morphometric (GM) approach was used to analyze the landmark coordinate data. When performing a GM analysis, the first step after landmark collec-tion is a Procrustes superimposicollec-tion of the entire coordinate dataset to align all the landmarks in the same coordinate system, which makes all specimens comparable to one another [15,16]. The Procrustes coordinates were then regressed on centroid size (pooled within-groups approach) to remove any varia-tion in shape that is due to size (i.e. allome-try). The residuals from this regression were
then used as the shape variables for the ensu-ing multivariate statistical tests. All analyses were performed in MorphoJ 1.04a [17].
To test the first hypothesis, the branchial arch mean shape from each reduced O2group was compared to the control group.
This wasaccomplished by computing the Pro-crustes distance from each group mean to the control mean; statistical significance was de-termined via a 5000-round permutation test. To test the second hypothesis of a directional relationship between hypoxia levels and shape variation, both a principal components analysis (PCA) and a canonical variate analysis (CVA) were applied to the shape data. The PCA reduces the multivariate data to a set of tractable axes representing the major modes of shape variation; the first few principal components (PCs) represent the axes
contain-ing the greatest amount variation in the sam-ple, with each subsequent PC representing a lesser amount. By using GM methods, the shape variation these axes display can be modeled with wireframes that are warped using a thin plate spline technique [18]. CVA is a similar data-reduction method, but where PCA reduces the data without any assump-tions regarding group membership, in a CVA the groups are specified a priori. In effect, the CVA seeks to maximize the shape variation that most effectively discriminates among groups [16].
RESULTS
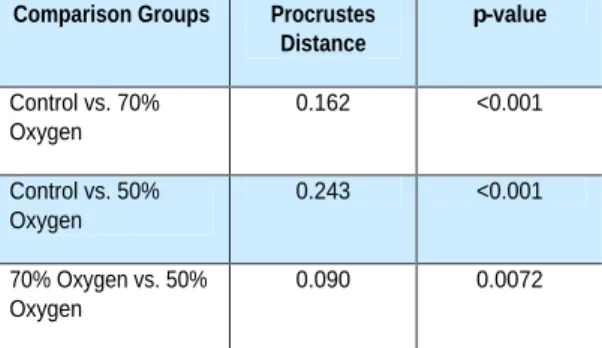
Results of the mean shape com-parison between the hypoxia groups and the control group are listed in Table 1. Based on the permutation test, the mean shapes of both the 70% oxygen group and the 50% oxygen group are statistically sig-nificantly different compared to that of the control group (p<0.001). The two experi-mental groups were also statistically
dif-Table 1: Procrustes distances between the mean shapes of each group and their associated p-values as determined by a permutation test (5000x).
Comparison Groups Procrustes Distance
p-value Control vs. 70%
Oxygen
0.162 <0.001 Control vs. 50%
Oxygen
0.243 <0.001 70% Oxygen vs. 50%
Oxygen
Hypoxicconditionsalterdevelopingbranchialarch-derivedstructuresinzebrafish
Vol 2, No 1 (2014) DOI 10.5195/d3000.2014.21
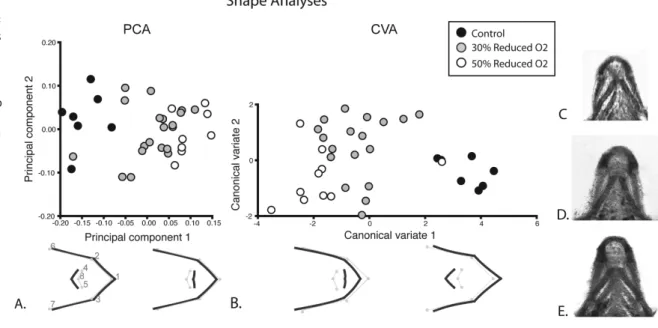
Figure 2: Shape analysis results.
ferent from each other in terms of shape (p = 0.0072).The centroidsizes of the experimental groups were both statisti-cally lower compared to the control group (70% versus control, p = 0.013; 50% versus control, p = 0.002).
The results of the PCA and CVA are depicted in Figure 2. The scatter plot of the first two PCs indicates that the greatest axis of variation, PC1, corresponds to hypoxia level. PC1 accounts for 57.4% of the shape variation in the dataset. The control shapes cluster at one end of the plot; the 70%
oxygen specimens are largely in the middle with the 50% at the opposite end from the controls. The 70% oxygen group shows the widest range of shape variation along PC1, spanning nearly the entire axis.The variance in scores associated with PC1 did not differ statistically among the three groups (p > 0.05; non-parametric Levene s test for equality of variances).
The shapes corresponding to the first PC are also modeled in Figure 2. The wire-frame at the negative end of the axis, corre-sponding to the control group, shows a slightly wider first arch and a more posteriorly located anterior portion of the second arch. The anterior most point of the first arch of this shape also extends beyond that of the over-all consensus shape, which is the average shape derived from all specimens included in the analysis. The wireframe corresponding to the positive end and the 50% oxygen group ap-pears slightly compacted relative to the con-sensus; it appears slightly narrower in all re-spects and the second arch appears anteriorly displaced, while the anterior most point of the first arch is located relatively closer to the second arch.
The CVA also revealed a difference in shape variation between the three groups. Similar to the PCA scatter plot, the first CV shows three discrete clusters with the con-trols at one end, 50% oxygen group at the opposite end, and the 70% oxygen group in the middle. The corresponding shapes also mimic those of the PCA, largely confirming the analysis.
Neither 70% nor 50% hypoxia expo-sure at 24 hpf for 24 hoursresulted in excess embryo mortality. However, mortality rates
at three months were increased 50% and 22%, respectively. None of the treatments caused obvious vascular phenotypes, although this judgment was based solely on gross visual inspection.
DISCUSSION
The results of this hypoxia experi-ment show that reduced oxygen availability changes the morphology of the anterior vis-cerocranium in developing zebrafish. Addi-tionally, the extent of the phenotypic out-come depends on the severity of hypoxia exposure. These preliminary results support the hypothesis that hypoxia is one of many environmental factors capable of altering craniofacial development, specifically first and second arch-derived structures. While these shape differences could have been a result of developmental stage differences, every at-tempt was made to harvest specimens at the same time point. To further reduce error due to size, the shape data were subjected to a regression to minimize size effects in the sample. This would have also reduced shape differences due to developmental stage, as stage is highly correlated with size in zebrafish [19].
The data as presented in the PCA in Figure 2 reveal that the largest axis of varia-tion in the sample separates the first and sec-ond branchial arch shapes of the three groups. The 50% oxygen group is at one ex-treme end of the shape spectrum and the controls at the opposite extreme. Interest-ingly, the 70% oxygen group spans the entire area of variation between the other two, overlapping with both groups. This indicates
that while there is a dosage affect and a 50% reduction in oxygen level leads to anterior viscerocranial shapes outside that of normal (control) shape variation, a 30% reduction has widely variable results. In some animals it leads to the extreme phenotype, while oth-ers are within in the realm of normal varia-tion. The CVA and permutation tests statisti-cally confirmed the mean shape differences between the three groups. This type of result from the 70% oxygen group fits previous ob-servations of the possible effect of hypoxia on human craniofacial anomalies; prevalence is increased, but the deleterious effects are not uniform and exhibit a range of severity [2,5]. Moreover, a similar dose-dependent effect and wide range of phenotypic response has been reported in the developing craniofacial complex of chicks following acute hypoxia exposure [4].
Hypoxicconditionsalterdevelopingbranchialarch-derivedstructuresinzebrafish
Vol 2, No 1 (2014) DOI 10.5195/d3000.2014.21
neurocranium leading some to conclude that these craniofacial elements are under the same genetic control [20]. Additionally, many of the zebrafish mutants with craniofacial phenotypes exhibit both affected jaws and anterior neurocrania[11,21,22]. That these structures appear to be under similar genetic control makes it tempting to speculate that they might have similar reactions to environ-mental factors and therefore hypoxia could hinder outgrowth in both structures, not just the first branchial arch.
As mentioned above, the shape of the second branchial arch is also affected by the hypoxia exposure. The 50% reduced oxy-gen second arch shape is both located anteri-orly and more widely angled compared to the shape associated with the control group. Altered shape of the developing arches could have implications for a relationship between hypoxia and several branchial arch syn-dromes. An example of one such syndrome is oculo-auriculo-vertebral syndrome (OAVS; OMIM 144210), which encompasses a wide spectrum of phenotypic variability that in-cludes microtia, hemifacial microsomia and other mild ear malformations such as preauri-cular tags, and vertebral defects either singly or in combination. The etiology of OAVS is unclear, but it is thought to result from dys-morphogenesis of first and second branchial arch derivatives [23]. Interestingly, when compared to low elevation populations, iso-lated microtia and the expansive OAVS pheno-type have been found at higher frequencies in infants born to women in the high altitude city of Quito, Ecuador [2,5].
While both hypotheses tested in this study are supported by the data, the conclu-sions are of limited scope. Although zebrafish are phylogenetically far removed from hu-mans, much of our biomedical knowledge has been studied through the use of animal mod-els. Indeed, the zebrafish larvae form the same skeletal elements as higher vertebrates and the zebrafish is increasingly used to study jaw formation specifically [24]. While these results do not directly apply to mammals and humans specifically, they do provide eviden-tiary support that further research into this interaction between hypoxia and craniofacial development is warranted. Now that a clear phenotypic effect has been established, a natural next step would be to elucidate the biological mechanisms underlying it. Recent experimental work by Smith and colleagues [4] suggests that hypoxia-induced craniofacial malformations in chick embryos result from a combination of increased cell death and de-creased cell proliferation.Zebrafish provide an excellent avenue for further investigations into the possible genetic and molecular
machinations of hypoxia s effects on craniofa-cial development. Additional experiments testing hypotheses of gene-environment in-teractions involving hypoxia and different craniofacial phenotypes would provide useful insight into determining the etiology of com-plex and multifactorial human craniofacial malformations such as OAVS and cleft lip/palate.
ACKNOWLEDGEMENTS
The authors have no conflicts of interest to report. This project is supported by the Uni-versity of Pittsburgh Central Research Devel-opment Fund (CRDF to A.R.V.).
REFERENCES
1. Unraveling human cleft lipand pal-ate research. Vieira AR. J Dent Res. 2008 Feb;87(2):119-25. Review. PMID: 18218836.
2. Altitudeas a risk factorfor congeni-tal anomalies. Castilla EE, Lopez-Camelo JS, Campaña H. Am J Med Genet. 1999 Sep 3;86(1):9-14. PMID: 10440822.
3. Hyperoxia and hypoxia in preg-nancy: simple experimental manipu-lation alters the incidence of cleft lip and palate in CL/ Fr mice. Millicovsky G, Johnston MC. Proc Natl Acad Sci U S A. 1981 Sep;78(9):5722-3. PMID: 6946511.
4. The effect of hypoxia on facial shape variation and disease phenotypes in chicken embryos. Smith F, Hu D, Young NM, Lainoff AJ, Jamniczky HA, Maltepe E, Hallgrimsson B, Marcucio RS. Dis Model Mech. 2013
Jul;6(4):915-24. doi:
10.1242/ dmm.011064. Epub 2013 Apr 16. PMID: 23592613.
5. Prevalence rates of microtia in South America. Castilla EE, Orioli IM. Int J Epidemiol. 1986 Sep;15(3):364-8. PMID: 3771073.
6. Nüsslein-Volhard C, Gilmour DT, Dahm R (2002) Zebrafish as a sys-tem to study development and or-ganogenesis. In: Nüsslein-Volhard C, Dahm R, editors. Zebrafish; A practi-cal approach. New York: Oxford University Press. pp. 1-5.
7. Insulin-like growth factor-binding protein-1 (IGFBP-1) mediates hy-poxia-induced embryonic growth and developmental retardation. Ka-jimura S, Aida K, Duan C. Proc Natl Acad Sci U S A. 2005 Jan
25;102(4):1240-5. Epub 2005 Jan 11. PMID: 15644436.
8. Understanding hypoxia-induced gene expression in early develop-ment: in vitro and in vivo analysis of hypoxia-inducible factor 1-regulated zebra fish insulin-like growth factor binding protein 1 gene expression. Kajimura S, Aida K, Duan C. Mol Cell Biol. 2006 Feb;26(3):1142-55. PMID: 16428465.
9. Molecular dissection of craniofacial development using zebrafish. Yelick PC, Schilling TF. Crit Rev Oral Biol Med. 2002;13(4):308-22. Review. PMID: 12191958.
10. Sperber GH, Sperber SM, Guttman
GD (2010) Craniofacial
Embryogenetics and Development. Shelton: People's Medical Publishing House. 251p.
11. Jaw and branchial arch mutants in zebrafish II: anterior arches and car-tilage differentiation. Piotrowski T1, Schilling TF, Brand M, Jiang YJ, Heisenberg CP, Beuchle D, Grandel H, van Eeden FJ, Furutani-Seiki M, Granato M, Haffter P, Hammer-schmidt M, Kane DA, Kelsh RN, Mul-lins MC, Odenthal J, Warga RM, Nüsslein-Volhard C. Development. 1996 Dec;123:345-56. PMID: 9007254.
12. Asymmetric patterns in the cranial skeleton of zebrafish (Daniorerio) exposed to sodium pentachloro-phenate at different embryonic de-velopmental stages. López-Romero F1, Zúñiga G, Martínez-Jerónimo F. Ecotoxicol Environ Saf. 2012
Oct;84:25-31. doi:
10.1016/j.ecoenv.2012.06.008. Epub 2012 Jul 19. PMID: 22818112. 13. Geometric morphometrics: ten
years of progress following the Revolution. Adams, DC, Rohlf JF, Slice DE. Ital J Zool. 2002 Jan;71:5-16.
14. Albertson RC, Yelick PC (2009) Morphogenesis of the jaw: Development beyond the embryo. In: Dietrich III HW, Westerfield M, Zon LI, editors. Essential Zebrafish Methods. Boston: Elsevier. pp. 457-477.
Hypoxicconditionsalterdevelopingbranchialarch-derivedstructuresinzebrafish
Vol 2, No 1 (2014) DOI 10.5195/d3000.2014.21
16. Zelditch ML, Swiderski DL, Sheets HD, Fink WL (2004) Geometric morphometrics for biologists. San Diego: Elsevier Academic Press. 478 p.
17. MorphoJ: an integrated software package for geometric morphomet-rics. Klingenberg CP. Mol Ecol Re-sour. 2011 Mar;11(2):353-7. doi: 10.1111/j.1755-0998.2010.02924.x. Epub 2010 Oct 5. PMID: 21429143. 18. Principal warps: Thin-plate splines
and the decomposition of deforma-tions. Bookstein FL. IEEE Trans Pat-tern Anal. 1989 Jun;11(6):567-85. 19. Schilling TF (2002) The morphology
of larval and adult zebrafish. In: Nuessleid-Volhand C, Dalm R, editors. Zebrafish. Oxford: Oxford University Press. pp. 59-94.
20. Genetic basis of adaptive shape dif-ferences in the cichlid head. Albert-son RC, Streelman JT, Kocher TD. J Hered. 2003 Jul-Aug;94(4):291-301. PMID: 12920100.
21. Jaw and branchial arch mutants in zebrafish I: branchial arches. Schil-ling TF, Piotrowski T, Grandel H, Brand M, Heisenberg CP, Jiang YJ, Beuchle D, Hammerschmidt M, Kane DA, Mullins MC, van Eeden FJ, Kelsh RN, Furutani-Seiki M, Granato M, Haffter P, Odenthal J, Warga RM, Trowe T, Nüsslein-Volhard C. Devel-opment. 1996 Dec;123:329-44. PMID: 9007253.
22. Specification and morphogenesis of the zebrafish larval head skeleton. Kimmel CB, Miller CT, Moens CB. Dev Biol. 2001 May 15;233(2):239-57. Review. PMID: 11336493. 23. Gorlin R (2001) Branchial arch and
co-acral disorders. In: Gorlin R, Hennekam RC, editors. Syndromes of the head and neck. Oxford: Oxford University Press. pp. 790-849.
24. Examination of a palatogenic gene program in zebrafish. Swartz ME1, Sheehan-Rooney K, Dixon MJ,
Eber-hart JK. DevDyn. 2011
Sep;240(9):2204-20. doi:
10.1002/dvdy.22713. PMID: 22016187.