49
UNIVARIATE AND MULTIVARIATE ANALYSIS OF SOME GARLIC
LANDRACES FOR BULBS TRAITS
CIULCA S., RENATA ŞUMǍLAN, SORINA POPESCU , BRIGITTA SCHMIDT, ŞUMĂLAN R.
Keywords: garlic, landraces, bulbs traits.
ABSTRACT
The objectives of this paper were to evaluate 12 garlic landraces collected from South-Western saline area of Timis County regarding the bulbs traits and interrelationship among them, with a view to exploiting some of these landraces directly in the crop or using these landraces in breeding program. In this region growers use mostly garlic landraces with a high adaptability to specific environmental conditions, like soil salinity.
The results prove the existence of a large phenotypic diversity of bulb traits, even between landraces from the same location (Livezile, Sanmartin, Foieni) which suggests that the adaptation to specific environmental conditions have been associated with different morphological features of bulbs. The height followed by the diameter of bulbs has a significant contribution to the achievement of theirweight.
INTRODUCTION
Despite its asexual reproduction, garlic (Allium sativum L.) exhibits wide diversity for morphological and agronomic characters due to accumulation of mutations (Mohammadi et al., 2014). On the other hand, although mutations may be a source of variability, they are rather limited; therefore, breeding using this strategy has not resulted in significant progress (Etoh and Simon, 2002). The lack of sexuality in garlic limits the increase of variability that is useful for breeding for economically important traits, such as tolerance to biotic and abiotic stress, earliness, yield and quality (Kamenetsky, 2007).
Garlic yield is the integration of many variables that affect plant growth during the growing period. The knowledge of genetic association between garlic yield and its components would improve the efficiency of breeding programs by identifying appropriate indices for selecting garlic varieties (Singh, et al., 2011).Bulb diameter was reported by many researchers as the most closely variable related to yield per unit area and was often used in selecting high yielding garlic (Rahman and Das, 1985; Kohli and Nutan, 1993; Singh and Singh, 1999).Because garlic is highly adaptive to its growth environment, yields remain consistent or may improve when bulbs are replanted in similar conditions in which they were produced (Volk and Stern, 2009).
As garlic being a vegetative propagated crop, genetic variability is maintained mainly between rather than within populations. Therefore, a low number of individuals from each population may be sufficient to represent the genetic variability within and between genotypes (De Bustos et al. 1998).
Saline soils affect around 15% of the agricultural lands in Timiscounty. There are two main geographical areas affected by soil salinity: the South-Western area – represented by Livezile, Cruceni, Foeni, Uivar, Cenei, Săcălaz, Peciu-Nou Ciacova, and the North-Western area - Dudestii-Vechi, Beba-Veche, Cenad, Sînicolaul-Mare, Sînpetru-Mare and Teremia Sînpetru-Mare villages (Camen et al. 2012).
50
MATERIAL AND METHOD
The biological material was composed of 12garlic landraces from localities of TimişCounty with saline soils. The studied materialwas obtainedfrom the work of a group of researchers from BUASVM Timişoara who have collected bulbs of red onion landraces from areas affected by salinity in Banat region, activity which was financed from the project “The screening of salinity tolerance of some local vegetable landraces in order to conserve the genetic potential and biodiversity” through PN-II-PT-PCCA-2011 program.
The biological material was planted in autumn using a randomized complete block (RCB) with three replicates. From each plot 20 bulbs were evaluated for the following traits: bulb height (Ib); bulb diameter (Db); bulb weight (Gb); shape index (If).
The data were analyzed by Jaccard similarity coefficients, UPGMA cluster analysis (Fielding, 2007), principal components, ANOVA (Ciulca, 2006). The significance ofdifferenceswas expressedbased onletters, variantsmarked withdifferent letters beingconsidered as significantly different. The interrelationshipsbetween the bulbs traits were analyzedusingmultipleregressions (Ciulca, 2006).
The distance matrix was used for cluster analysis using the unweighted pair-group method with arithmetic averages (UPGMA), with the Neighbor program of the Phylip package, version 3.5c. To make possible the display in a single graph of the performance of each genotype for each of the five traits, the basic principle of the biplot technique developed by Gabriel (1971) and GGE biplot method developed by Yan et. al. (2000) was used.
RESULTS AND DISCUSSIONS
The bulbs heightofgarlic landraces showed a medium inter genotypic variability(10,56 %), with values from 3,15 in Foieni 375 and 4,30 cm in Livezile 333 landraces, under the conditions ofa variation amplitude of 1.15 cm. Livezile333landraceshowed asignificantly superiorbulbs heighttowardsthe landraces: Sanmartin S. 180b, Foieni 375; CraiNou 82 şiCruceni 249. High valuesof thistrait, ofover 4cmwere also recorded by Livezile 498 and Sânmartinu S. 180a landraces.
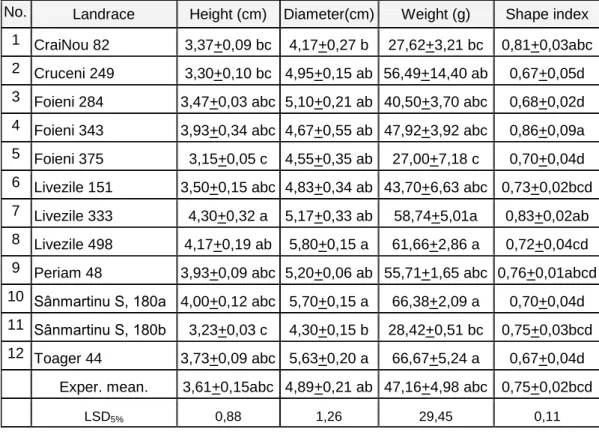
Table 1
Mean values of the studied bulb traits in garlic landraces from Timis County
No. Landrace Height (cm) Diameter(cm) Weight (g) Shape index
1 CraiNou 82 3,37+0,09 bc 4,17+0,27 b 27,62+3,21 bc 0,81+0,03abc 2 Cruceni 249 3,30+0,10 bc 4,95+0,15 ab 56,49+14,40 ab 0,67+0,05d 3 Foieni 284 3,47+0,03 abc 5,10+0,21 ab 40,50+3,70 abc 0,68+0,02d 4 Foieni 343 3,93+0,34 abc 4,67+0,55 ab 47,92+3,92 abc 0,86+0,09a 5 Foieni 375 3,15+0,05 c 4,55+0,35 ab 27,00+7,18 c 0,70+0,04d 6 Livezile 151 3,50+0,15 abc 4,83+0,34 ab 43,70+6,63 abc 0,73+0,02bcd 7 Livezile 333 4,30+0,32 a 5,17+0,33 ab 58,74+5,01a 0,83+0,02ab 8 Livezile 498 4,17+0,19 ab 5,80+0,15 a 61,66+2,86 a 0,72+0,04cd 9 Periam 48 3,93+0,09 abc 5,20+0,06 ab 55,71+1,65 abc 0,76+0,01abcd 10 Sânmartinu S, 180a 4,00+0,12 abc 5,70+0,15 a 66,38+2,09 a 0,70+0,04d 11 Sânmartinu S, 180b 3,23+0,03 c 4,30+0,15 b 28,42+0,51 bc 0,75+0,03bcd 12 Toager 44 3,73+0,09 abc 5,63+0,20 a 66,67+5,24 a 0,67+0,04d
Exper. mean. 3,61+0,15abc 4,89+0,21 ab 47,16+4,98 abc 0,75+0,02bcd
51
In terms ofbulbs diameterthe studied landraces showed avariation amplitudeof 1.63cm associated with amedium inter-genotypicvariability(10.65%), ranging from 4,17 cm for CraiNou 82 and 5,80 cm for Livezile 498 landraces. As such, Livezile 498,Sânmartinu S. 180a and Toager 44 landraces showed a significantly superior diameter of bulbsto CraiNou 82 and Sânmartinu S. 180b landraces.All other populationswere notstatisticallydifferentiated for this trait.
For bulbs weight, the studied landraces have shown avery highvariability (39,78 %), associated with an amplitude of 54,59 g. In the case of Toager 44, Sânmartinu S. 180a, Livezile 498 and Livezile 333 landraces were recorded thehighest values ofbulbs weightassociated statisticallyincreasestowardsthe landraces: Foieni 375, Sânmartinu S. 180b and CraiNou 82.
Regarding theshapeof bulbs, all landracesshowedflattenbulbs havingregard to theshapeindex valuesbetween0.67and0.86, under alow inter-genotypic variability. The landraces: Cruceni 249, Foieni 284, Foieni 375, Sânmartinu S, 180a and Toager 44, registered the mostflattenbulbs, significantly different inshapecompared tomajority of the otherlandraces.
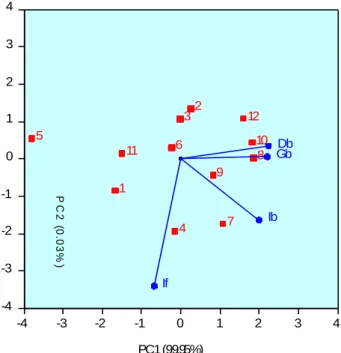
Fig. 1.Biplot for the studied garlic landraces and bulb traits
The biplot (Fig. 1) based on thefirst two principal componentsexpress99.98% of the variability of the fourtraits. Based onthe vectors positionof genotypestowards the differenttraits their performanceswereexpressed.
As such, it is noted that Toager 44, Sanmartin S 180a and Livezile 498 landraces express high valuesforbulbs diameterandweight. For these twotraits,higher valuesthan the averagewere found in the landraces: Cruceni 249, Foieni 284 and Periam 48. In the case of Foieni 375, Sânmartinu S. 180b and CraiNou 82, the lowvaluesofbulbs diameterwerealso associated with alow weight. The vectorspositionof the four traits certifies thatattheselandraces thebulbsdiameterhas a major contributionto the achievement oftheir weight.
Considering thedata from Table 2 it is observed that85.54 % of the bulbs weight variability maybeexplained as theresult of the influenceof the other threetraitsfrom in
11
2 3
4 5
12
6
1
7 8 9
10 Gb
Ib Db
If
4
-3
-4 -2
-2 -1
0 0
2 1
4 2
3
-4
-1 1 3
-3
PC1 (99.95%)
P
C
2
(0
.0
3
%
52
thisregressionmodel, this resultsare relevantconsidering also thevalue of adjusted coefficient of determination. The bulbsheightshowed thehighestinfluence (56.04 %) ontheir weight. Also, the bulbs diameter has asignificant contribution (28.30)to the achievement of theirweight, while the bulbs shape hasa small (2.30 %) and statistically uninsured influence.
Table 2
Variance components of multiple regression between bulbs weight and other bulbs traits for garlic landraces
Variability source SS DF MS F
Regression 2080.80 3 693.60 15.78** Bulbs height (x1) 1363.24 1 1363.24 31.02** Bulb diameter (x2) 688.47 1 688.47 15.66** Shape index (x3) 29.10 1 29.10 0.66
Residual 351.60 8 43.95
Total 2432.40 11
y = -4,776+ 0,005x1+0,092x2+0,179x3; R 2
=0,8554; R2a = 0,8012; SDE = 6.63 g; DW=2,92
The regressionmodelallowsa meaningful assessment ofbulbs weightwithan error of+6.63g. Giventhat theDurbin-Watson indexisgreater than 1.4, it follows thatthe errorswhich accompanythe experimental resultsare notauto correlated, and the orderof traitsin theequation of regressiondoes not influencethe estimated values of bulbs weight for these garlic landraces.
1 2 3 4 5 6 7 8 9 10 11 12
25 30 35 40 45 50 55 60 65 70 75
Estimated bulbs weight (g)
25 30 35 40 45 50 55 60 65 70 O bs er v ed bul bs w ei ght (g) 1 2 3 4 5 6 7 8 9 10 11 12 95% confidence
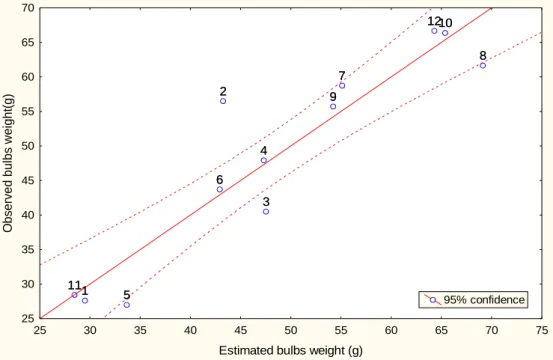
Fig. 2. Observed andestimatedvaluesofbulbs weightbased onmultipleregression model for garlic landraces
Based on theFigure2 it is noted thatgenerallythere are nosignificant differences betweenthe observedvaluesandtheestimatedbulbs weightthroughthe regression, as suchthe contribution of differenttraitsto the variability of bulbsweightis relevant for10 ofthe 12garlic landraces. Thus,atCruceni249 landrace, the experimentally observed weight of bulbs is significantlyhigher to theestimated one, whileatFoieni 384 the massbulbsappreciatedbased onthe other threetraitsissignificantly lowerthanthe real one.
284-53
Livezile 151 (97,91 %); Cruceni 249-Foieni 284 (97,50 %); CraiNou 82-Sânmartinu S. 180b (97,30). The highestdiversityunder the aspect ofthesefour traitswasobserved between landraces: Foieni 375-Sânmartinu S. 180a (68,07%); Foieni 375-Toager 44 (64,70 %); Foieni 375-Livezile 333 (61,01 %).
Having regard to thephenotypic similarityof the 12garlic landraces,the dendrogram(Figure 3) was madeusing cluster (groups) averagemethod. Thisdendrogramshows twomainclusters, among whichthere is aphenotypicdiversityof about 29%. The first cluster is composed from the landraces with small bulbs, like: CraiNou 82, Sânmartinu S. 180b and Foieni 375, amongwhich there isa phenotypic similarityof about87%.
Fig. 3.UPGMA clustering of garlic landraces from TimişCounty for bulb traits
The secondclusterconsists of two sub clusters; seven landraces showing an averagesimilarityof approx.93% are located in the first sub clusters, respectively. A secondsub clusteriscomposed of Livezile 333 and Foieni 343 landraces between which there isa similarityof approximately96.5%, and which havehighvaluesofthe bulbs height, slightly moreelongatedthan at theother landraces.
Table 3
Analysis of variance for garlic landraces concerning the bulb traits
Landraces Between groups Within groups F Test
SS DF SS DF
CraiNou 82 462,64 1 6,16 2 150,18**
Cruceni 249 2148,03 1 9,32 2 460,98**
Foieni 284 1050,01 1 9,99 2 210,16**
Foieni 343 1503,04 1 8,16 2 368,27**
Foieni 375 74,40 1 3,09 2 48,09*
Livezile 151 1241,15 1 8,75 2 283,67**
Sanmartinu S.180
Cruceni 249
Foieni 284
1.00
Livezile 498
0.95
Toager 44
0.90
Livezile 333
0.85 0.80 0.75 0.70 0.65
Livezile 151
Foieni 343 Sanmartinu S.180a
Periam 48 Crai Nou 82
Foieni 375
54
Livezile 333 2294,12 1 10,54 2 435,14**
Livezile 498 2531,42 1 13,46 2 376,27**
Periam 48 2060,37 1 10,46 2 394,01**
Sânmartinu S 180a
2968,57 1 12,93 2 459,29**
Sânmartinu S 180b
493,83 1 6,63 2 148,91**
Toager 44 3007,70 1 12,52 2 480,28**
Table 4
Analysis of variance for bulb traits of garlic landraces
Trait Between groups Within groups F Test
SS DF SS DF
Bulbs height 1,46 1 1,49 10 9,77*
Bulbs diameter 2,95 1 3,08 10 9,56*
Bulbs weight 2400,60 1 874,46 10 27,45**
Shape index 0,01 1 0,04 10 0,03
Regarding theanalysis of variancefor thetraitsstudied inthese landraces, it is noted that forbulbweight high and distinctlysignificantvalues of the variancewererecorded (Table 4). Thus, this trait manifestsa high capacityto differentiateboth betweenthe landraces ofthe sameclusteras well as betweenthose fromdifferent clusters. Thelowestvariabilitybetween landraceswas observedforthe bulbs shape.
CONCLUSIONS
The results prove the existence of a large phenotypic diversity of bulb traits, even between landraces from the same location (Livezile, Sanmartin, Foieni) which suggests that the adaptation to specific environmental conditions have been associated with different morphological features of bulbs. The height followed by the diameter of bulbs has a significant contribution to the achievement of theirweight.Some of these landraces are valuable resources for plant breeding programs as a source of salinity tolerant genes that were lost during the selection process of commercial varieties.
ACKNOWLEDGEMENT
This work was supported by a grant of the Romanian National Authority for Scientific Research, CNDI-UEFISCDI project number PN-II-PT-PCCA-2011-3.1-0965. Special thanks to all persons from villages which were very kind to let us visit their gardens and supplied us with the necessary plant material.
REFFERENCES
55
Ciulca S. 2006 - Metodologii de experimentare în agricultură şi biologie. Ed. Agroprint, Timişoara;
De Bustos A, Casanova C, Soler C, Jouve N. 1998 -RAPD variation in wild populations of four species of the genus Hordeum (Poaceae). TheorAppl Genet 96:101–111;
Etoh, T., Simon, P. W. 2002 -Diversity, Fertility and Seed Production of Garlic. In: Allium Crop Sciences: Recent Advances , Rabinowitch, H. D., & Currah, L., Eds., pp. 101-117, CAB International, Wallingford, U. K;
Fielding A.H. 2007 -Cluster and classification techniques for the biosciences. CambridgeUniversity Press;
Gabriel K.R.1971-The biplot graphic display of matrices with application to principal component analysis.Biometrika, 58: p. 453-467;
Kamenetsky, R. 2007 - Garlic: Botany and Horticulture. Hort. Rev. , Vol. 33, pp. 123-171;
KohliU.K., Nutan M. 1993. Yield performance and correlation studies in garlic - A note.
Haryana Journal of Horticultural Sci., 22(2): 163-165;
Mohammadi B., Khodadadi M., Karami E., Shaaf S. 2014 -Variation in
Agro-morphological Characters in Iranian Garlic Landraces International Journal of Vegetable Science Vol. 20, Issue 3, 202-215;
Rahman A.K., Das M.K. 1985 -Correlation and path analysis in garlic.Bangladesh J. Ahric. Research, 10: 50-54;
Singh J.P., Singh S.B. 1999 -Evaluation of different selections/varieties of garlic for yield and some yield contributing parameters, Crop Research, 18(2): 216-217;
Singh R.K., Dubey B.K., Bhonde S.R., Gupta R.P. 2011 -Correlation and path coefficient studies in garlic (Allium sativumL.), Journal of Spices and Aromatic Crops, 20(2): 81-85;
Volk G.M., Stern D. 2009 - Phenotypic Characteristics of Ten Garlic Cultivars Grown at Different North American Locations. Hort Science 44(5):1238–1247;