Abstract— It is well known that the electrode shape, surface conditions and variety of involved processes objectively stipulate a number of factors which may lead to the breakdown in gases. Comprehensive studies indicate that the electric field distribution of different electrode configurations is different although the same voltage is applied across the electrode, which further leads to the disparate breakdown voltage amplitude. In this paper, the dependence of the breakdown formation and characteristics on the electrode arrangements (cylinder-cylinder, sphere-sphere and cylinder-sphere) have been studied by using COMSOL simulation package. The obtained simulation results agree well with the available experimental data and reveal that the breakdown voltage curves are strongly affected by the geometry of the electrode especially its edge sharpness. Based on the time evolution of the electron density and the electric potential distributions including electric field arrows the plasma formation between various electrode configuration could be followed. In addition, the calculated values for the breakdown voltage have been fitted in accordance with the simple empirical law. Results, presented here, could be useful in order to determine which configuration of electrodes will lead more easily to the breakdown.
Index Terms—Electrode configuration, breakdown, simulation, COMSOL.
I. INTRODUCTION
The electrical breakdown in a gas represents the transition of non-sustaining discharges into a self-sustaining discharge [1-12]. The electric field characteristics and their distribution in the vicinity of various electrode configurations are very interesting and useful field of study. Furthermore, a sufficient understanding of the electric field behavior will contribute to a very good extent to the understanding of the discharge phenomena and the principles behind them [13-15].
Electrical breakdown always starts with the multiplication of some primary seed electrons in cascade ionization when accelerated by the electric field [16]. Further development of
Manuscript received Dec 10, 2019.
Marija Radmilović-Radjenović, Institute of Physics, University of Belgrade, Belgrade, Serbia. (e-mail: [email protected]).
Dimitrije Radjenović, Faculty of Mathematics, University of Belgrade, Belgrade, Serbia. (e-mail: [email protected]).
Branislav Radjenović, Institute of Physics, University of Belgrade, Belgrade, Serbia. (e-mail: [email protected]).
the discharge depends on several parameters such as the gas geometry of the system, etc. Although the breakdown composition, the pressure, distance between the electrodes, mechanism in simple geometries is well understood, it is hardly predictable in various electrode configuration assemblies.
Many physical and empirical approaches adopted to define breakdown voltage for various electrode configurations can be found in the literature [17-20]. Comprehensive studies indicate that the electric field distribution of different electrode configurations is different although the same voltage is applied across the electrode, which further leads to the disparate breakdown voltage amplitude. In the past few decades, computer modeling and simulations have evolved to an effective tool that complements laboratory experiments and analytic models. Numerical modeling for different electrode configurations [21-24] leads to the better understanding, but also reveals the difficulties in simulating direct current (DC) breakdown.
Figure 1. The dependence of the breakdown voltage on the molecular density and the gap spacing plotted according expression (1). Values of parameters G, Oand t are taken from [25].
It was shown that, under uniform field condition, breakdown voltage of gases can be satisfactorily described by a simple empirical law [25] (graphically presented in Fig. 1):
,
G O
U
d
t
(1) where U is the DC or peak accelerating current (AC) breakdown voltage (expressed in kV), d is the gap spacing (in millimeters), is the molecular density (in mole per liter),Simulation studies of the electrode configuration
effect on the breakdown phenomenon
International Journal of Advanced Research in Computer Science and Electronics Engineering Volume 8, Issue 12, December 2019
while G, O and t represent a set of experimentally determined coefficients which characterizes each gas. According expression (1) the breakdown voltages, for a given gap length, must remain straight lines when plotted on logarithmic scales and the slope of these lines corresponds to coefficient G. Empirical law (1) can be also used for non-uniform fields with G which has the same value than in uniform field, but with different values of O and t that are valid only for onlyone electrode configuration [25].
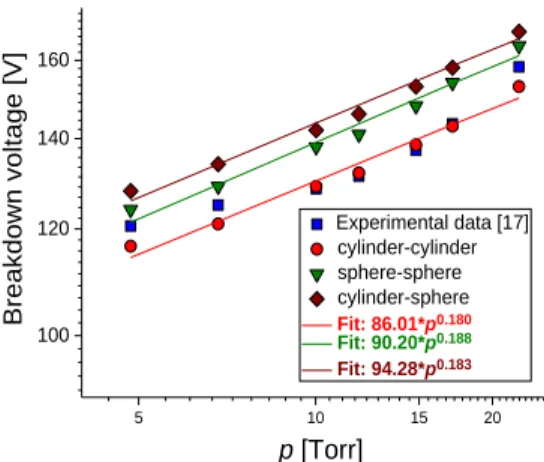
In this paper the shape of the electrodes has been considered as the top priority. Calculations have been performed for: cylinder-cylinder, sphere-sphere and cylinder-sphere electrode arrangements have been performed by using COMSOL Multiphysics [26]. For this study, simulations conditions include: the interelectrode separation for 1. 3 cm, the pressure range from around 5 Torr up to 22 Torr and the work function of the electrode material 3. 68 eV. The shapes of the electrodes were cylinder and sphere with the radius and the height of 4 cm and 6 cm, respectively. It was found that the dependence of the breakdown voltage on the pressure for the electrode arrangements with at least one sphere electrode have the same tendency as the Paschen curve for cylinder-cylinder geometry. Also, the breakdown voltages calculated when electrodes are cylindrical are less than 10 V and 15 V, as compared to the sphere-sphere and cylinder-sphere electrodes, respectively. Breakdown voltage curves for all electrode configurations can be fitted in accordance with the simple empirical law (1). The time evolution of the electron density and the electric potential during breakdown for the electrode arrangements with the one or two cylindrical electrodes are similar and clearly illustrate the edge effects. On the other hand, characteristic of the cylinder-cylinder configuration with the less sharpness of the edge is similar to the characteristics for the sphere-sphere electrodes.
II. NUMERICAL METHOD
In this study, the DC argon breakdown is analyzed by using software package COMSOL based on applying finite element method for the continuity and transport equations in combination with Poisson’s equation [27]. Electrons and ions are considered to move independently in an immobile background gas. The species flow is assumed to be laminar which is fulfilled if the Knudsen number n=mfp/d<1, where d is the smallest distance in the geometry, while mfp is the mean free path defined as the average distance that a particle travels before a collision.
The electron density and mean electron energy are computed by solving a pair of drift-diffusion equations [26]:
ne ne
e E
De ne Re,t
(2)
E
D E , (3)
ne ne e e ne e R
t
with e
eE
neDeneand Dee eT, 5 / 3eand DTe. The electron source term is expressed as:
1
,
M
e j j n e j
R
x k N n
(4)where xj is the mole fraction of the target species for reaction j with the rate coefficient kj, while Nn is the total neutral number density. The electron energy loss can be obtained as sum of the collisional energy loss over all reactions:
1
,
P
j j n e j j
R
x k N n
(5)where j represents the energy loss from reaction j. For DC discharges, the Townsend coefficients are usually used instead of rate coefficients, so the electron source term
and the electron energy loss can be rewritten [27]:
1 M
e j j n e
j
R
x
N
and1
,
Pj j n e j
j
R
x
N
(6)where j is the Townsend coefficient for reaction j and e is the electron flux.
Electrons are lost due to a net flux of electrons from the plasma bulk to the wall and due to the random motion of electrons within the mean free path of the wall. On the other hand, a wall emits an electron with some probability when it is struck by an ion or other excited species.
Beside electrons, ions are also lost to the wall due to surface reactions and since the electric field is directed towards the wall. One of the crucial steps in finite element calculations is the meshing. Since the meshing means surface separation into a number of smaller elements, the computation time increases with the number of mesh elements. The meshing should therefore be fine enough to get accurate results, convergence and stability, and coarse enough to avoid long calculation times.
In the numerical simulation the breakdown is defined as a significant increase of electron density and net flux of electrons and ions. The simulation stop limit for breakdown is fixed when both density and current reach at least 1000 times their values calculated at the end of the initial stabilization time. When these two conditions are reached the simulation is stopped and the breakdown voltage is determined. 1000 times was chosen as a good limit because above this value the calculations needed much longer time to finish the computation due to the exponential increase of density. In order to takes into account the edge sharpness of the cathode, the radius of the cathode is multiplied by the coefficient corresponding to the shape of the electrode. When electrode is sphere, this coefficient is equal to 1.
III. RESULTS
between breakdown voltages calculated for different electrode configurations and the experimental data taken from the literature [28]. The best agreement with the measured data [28] (blue squares) has been achieved for the cylinder-cylinder electrodes (red circles). For configurations with one (brown diamond) or two spherical electrodes (green down triangle) breakdown voltages are higher, but no more than 10 V and 15 V, respectively than those calculated for the cylinder-cylinder electrodes. Following empirical law (1) breakdown voltages calculated for various electrode arrangements at a fixed gap spacing are fitted to the to the pressure dependence in the form: UB=plines. Also, the breakdown voltages, for a given gap length, must remain straight lines when plotted on logarithmic scales.
Figure 2. The breakdown voltage versus the pressure for the gap size of 1.3 cm. Experimental data taken from the literature [28] are shown by blue squares, while lines correspond to the fit of the calculated values.
Figure 3. Electrical potential at the initial time (t=0) for the electrode arrangement composed of: a) cylinder-cylinder, b) sphere- sphere and c) cylinder-sphere electrodes separated by 1.3 cm.
Results for theelectric potential at the initial time (without plasma) in the case of: a) cylinder-cylinder, b) sphere-sphere and c) cylinder-sphere electrodes are shown in Fig. 3. Upon applying voltage, electric potential and electron density start to change which will be illustrated by Fig. 4-Fig.7.
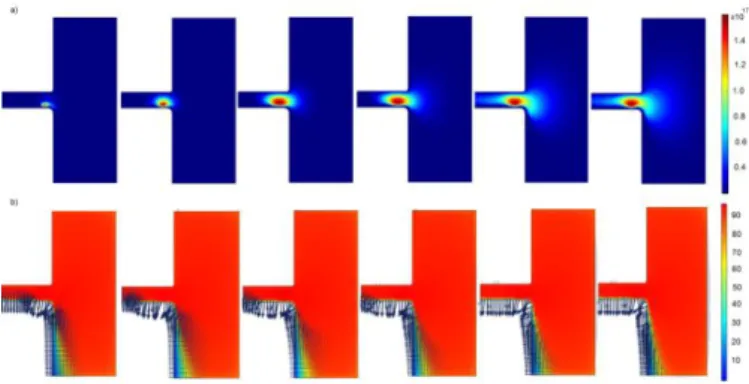
potential between the electrodes of: cylinder-cylinder, sphere-sphere and cylinder-sphere are shown in Fig. 4 and Fig. 5 and 6, respectively. As can be observed, both electron density and potential distributions are strongly affected by the
geometry of the electrodes. Practical electrodes with finite
Figure 4. The time evolution of the: a) electron density and b) electric potential including electric field arrows after breakdown starts for cylinder-cylinder electrodes separated by 1.3 cm under the pressure of 4.9 Torr.
Figure 5. The changes of the: a) electron density and b) electric potential during breakdown for the sphere-sphere electrodes at the gap spacing of 1.3cm and the pressure of 4.9 Torr.
Figure 6. The time evolution of the: a) electron density and b) the electric potential during breakdown for the gap length of the 1.3 cm between cylinder-sphere electrodes with the pressure of 4.9 Torr.
boundaries will have much enhanced field at the edges compared to that at the center. The sharper edge leads to higher field. Electron density and potential distributions are
5 10 15 20
100 120 140 160
Experimental data [17] cylinder-cylinder sphere-sphere cylinder-sphere
Fit: 86.01*p0.180
Fit: 90.20*p0.188
Fit: 94.28*p0.183
Breakdown voltag
e [V]
International Journal of Advanced Research in Computer Science and Electronics Engineering Volume 8, Issue 12, December 2019
similar for the electrode arrangements with at least one cylindrical electrode (Fig. 4 and Fig. 6) with the appropriate coefficient of 0.05 (sharper edge). For the sphere cathode, the coefficient is equal to 1. In these configurations, it looks like that the breakdown starts at the edge of one of the electrodes. Therefore, one may conclude that edge at the cylinder electrode could make some issues with starting and developing the discharges.
Results of calculations for the cylinder-cylinder configuration with the coefficient of 0. 1 (less sharpness of the edge) are shown in Fig. 7. In that case the time evolution of the electron density and electric potential are more similar to those calculated for sphere-sphere configuration (Figure 5). Later on the electrons are distributed across the gap mostly due to potential at any point in the surrounding space. For all arrangements, the electric field is non-uniform and is strong near the electrode.
Figure 7. a) The electron density and b) the electric potential including electric field arrows after breakdown starts for cylinder-cylinder electrodes (coefficient related to the sharpness of the edge is 0.1) separated by 1.3 cm under the pressure of 4.9 Torr.
IV. CONCLUSIONS
This study is dealing with the characteristics of the direct current argon discharges generated between three different electrode arrangements: cylinder-cylinder, sphere-sphere and cylinder-sphere. Simulations were performed by using finite element software COMSOL Multiphysics for the gap size of 1.3 cm, the pressure range from around 5 Torr to 22 Torr and the work function of 3.68 eV. The breakdown voltage curve calculated for a cylinder-cylinder geometry agree well with the experimental data taken from the literature [28]. The pressure dependence of the breakdown voltage for sphere-sphere and cylinder sphere assemblies has the same tendency as the breakdown voltage curve for cylinder-cylinder geometry. But, for the configurations composed of one or two spherical electrodes breakdown voltages are higher about 10 V and 15 V, respectively than values calculated for the cylinder-cylinder electrodes. It was shown that the breakdown voltages, for a given gap length, can be fitted in accordance with the simple empirical fit (1)
and remain straight lines when plotted on logarithmic scales.
Based on the time evolution of the electron density and the electric potential distributions we may conclude that geometry of the electrodes strongly affect the breakdown mechanism. For all electrode configurations the electric field is non-uniform. When arrangement contains one or two cylinder electrodes, edges brings some issues with starting and developing the discharges. In the case of the less sharpness of the edge the time evolution of the electron density and the electric potential is similar to those obtained for sphere-sphere electrodes. The presented results should provide an insight into fundamental properties of direct current (DC) breakdown in various electrode arrangements.
ACKNOWLEDGMENT
The authors would like to ackowledge support of the O171036 project Ministry of Education, Sceince and Technology Republic of Serbia.
REFERENCES
[1] P. Suleebka, and R. S. N. Rau, ―The mechanism of electrical breakdown of gases, initiated by a large number of electrons,‖ J. Phys.: Appl. Phys., vol. 5, pp. 2055, July 1972.
[2] E.E. Kunhardt, Electrical Breakdown and Discharges in Gases. NATO Advanced Science Institutes Series, vol 89a. Boston, MA: Springer, 1983. [3] Y. P. Raizer, Gas Discharge Physics. Berlin, Germany: Springer, 1997. [4] N.St. J. Braithwaite, ―Introduction to gas discharges,‖ Plasma Sources
Sci. Technol., vol. 9, pp. 517, June 2000.
[5] K. H. Becker, U. Kogelschatz, K. Schoenbach, and R. Barker,
Non-equilibrium Air Plasmas at Atmospheric Pressure. Bristol, UK: CRC Press, 2004.
[6] M. Darveniza, ―Electrical breakdown of air between insulated conductors,‖ in Proc. 6th International Conference on Properties and Applications of Properties and Applications of Dielectric Materials, Xi’an, 2000, pp. 615–620.
[7] M. Radmilović-Radjenović, and B. Radjenović, ―Modelling of a low-pressure argon breakdown in combined fields,‖ Plasma Sources Sci. Technol., vol. 15, pp. 1, Jan. 2006.
[8] P. Carazzetti, and H.R. Shea, ―Electrical breakdown at low pressure for planar microelectromechanical systems with 10- to 500-m gaps,‖ J. Micro/Nanolith. MEMS MOEMS, vol. 8, pp. 031305, Jul. 2009. [9] J. Lehr, and P. Ron, Foundations of Pulsed Power Technology.
Wiley-IEEE Press, pp: 369-438, 2017.
[10] M. Abdal-Salam, High-Voltage Engineering Theory and Practice, Second Edition, Revised and Expanded. Boca Raton, Florida: CRC Press, 2018.
[11] A.M. Loveless, G. Meng, Q. Ying, F. Wu, K. Wang, Y. Cheng, and A.L. Garne, ―The Transition to Paschen’s Law for Microscale Gas Breakadown at Subatmospheric Pressure,‖ Sci. Rep., vol. 9, pp. 5669, Apr. 2019.
[12] E.E. Kunhardt, and L.H. Luessen, Electrical Breakdown and Discharges in Gases: Parta A Fundamental Processes and Breakdown. New York, USA: Springer-Verlag, 2013.
[13] M. Radmilović-Radjenović, B. Radjenović, M. Klas, A. Bojarov, and Š. Matejčik, ― The breakdown mechanism in electrical discharges: The role of the field emission effect in direct current discharges in microgaps,‖
Acta Physica Slovaca, vol. 63, pp. 105, March 2013. doi: 10.2478/apsrt-2013-0003
[14] M.J Chen, Y.C Wu, K.L. Wen, M.T. Tsai, ―Estimating Probability of Gas Breakdown Using Grey-Fuzzy Logic,‖ Advances in Electrical and Computer Engineering, vol. 13, pp. 113, March 2013.
[15] C. Yuan, A.A. Kudryavtsev, and V.I. Demidov, Introduction to the Kinetics of Low Discharges. Bristol, UK: IOP Publishing, 2018. [16] R. Hackam, ―Effects of electrode configuration and voltage polarity on
vol. 44, pp. 653, Feb. 1973.
[18] D. Koning, and R. Heinemeyer, ―Breakdown voltages of dielectric-coated sphere-plane electrode configuration in high vacuum,‖ in Conference Record of the 1988 IEEE International Symposium on Electrical Insulation, Cambridge, MA, 1988, pp. 60.
[19] V.V. Choulkov, ―Effect of Electrode surface roughness on electrical breakdown in HV apparatus,‖ Dielectrics and Electric Insulation, IEEE Transactions, vol. 12, pp. 98, Jan. 2005.
[20] E.V. Ostroverkhov, V.V. Denisov, I.V. Lopatin, and N.N. Koval, ―Effect of the mesh emission electrode shape on the distribution of the plasma density generated in the working chamber,‖ J. Phys.: Conf. Ser.,
vol. 1115, pp. 032012, 2018.
[21] W.K.M. Brok, E. Wagernaas, J. Van Dijk, and J.J.A.M. Der Mullen, ―Numerical Description of Pulsed Breakdown Between Parabolic Electrodes,‖ IEEE Transactions on Plasma Science, vol. 35, pp.1325, Oct. 2007.
[22] R. Mohamed, A. Tilmatine, R. Ouiddir, and K. Medles, ―Experimental Modelling of the Breakdown Voltage of Air Using Design of Experiments,‖ Advances in Electrical and Computer Engineering, vol. 9, pp. 41, Feb. 2009.
[23] E.D. Fylladitakis, A.X. Moronis, and M. Theodoridis, ―Analytical model for determination of the unipolar ionic saturation current during positive corona discharge for geometries comprising cylindrical emitter electrodes,‖ IEEE Transactions on Dielectrics and Electrical Insulation, vol. 24, pp. 852, Feb. 2017.
[24] W.H. Lee, and J.C. Lee, ―Numerical Study of Alternating Current Breakdown Mechanism Between Sphere-Spehre Electrodes on Transformer Oil-Based Magnetic Nanofluids,‖J Nanosci Nanotechnol., vol. 18, pp. 6629, Sep. 2018.
[25] J.F. Drapeau, G. Olivier, and Y. Gervais, ―Non-uniform field breakdown of gases,‖ in Annual Report. Conference of Electrical Insulation and Dielectric Phenomena, Ottawa, 1988, pp. 238-244. [26] COMSOL Multiphysics, available at: www.comsol.com.
[27] AC/DC Module User's Guide, pp. 75-84, COMSOL AB,
Stockholm,Sweden. Available at:
https://doc.comsol.com/5.4/doc/com.comsol.help.acdc/ACDCModuleUs ersGuide.pdf,
[28] J.M. Meek, J.D. Craggs, Electrical breakdown of gases. Oxford, UK: Oxford Press, 1953.
Marija Radmilović-Radjenović received her Ph.D. degree from the
Faculty of Physics, University of Belgrade (2001). She is a Research Professor with the Institute of Physics, University of Belgrade. From 2004 to 2005, dr Radmilović-Radjenović was a Research Professor at POSTECH, University of Science and Technology, Pohang, Korea. She was a General Secretary of the Organizing Committee of the Fifth EU-Japan Workshop on Plasma Processing. She has published more than 150 papers in international journals and has been cited around 2000 times according Google Scholar
Dimitrije Radjenović is a student at the Faculty of Mathematics,
University of Belgrade. His programming skills also include C++, HTML, Java, ect. Until now, he has published 5 papers in the international journals.
Branislav Radjenović received the B.Eng., M.Sc., and Ph.D. degrees